Of what use is a website that does not sustain the attention of the netizens? Hence, a website must also be monitored on specific parameters like a regular store. Consider, for instance, the store of a brand selling motors for air-conditioners or, say, the website of a toy store like Hamleys. Over time, the trend has been that more business comes from online.
Need reports on how your website is performing on key metrics that impact your revenue. Find these website report templates here.
Yet, not all businesses are able to meet the customer online, as the website they have put up might not be designed well enough, or have issues with speed or the navigation design, and so on. In this scenario, website metrics are the key variables that businesses must monitor to ensure their website is up to scratch and is doing its job of creating new sales. However, mastering and implementing a website metrics scheme over several months is a pain point for businesses. They must create awareness among teams on website metrics, ensure their tracking is always on, and understand the metrics most relevant to their industry.
Metrics reporting serves multiple purposes: performance monitoring, decision support, continuous improvement, accountability, and communication. Get metrics reporting templates to kickstart your website here.
To tackle all this and resolve the pain point of businesses, SlideTeam has curated website metrics templates that provide the entire material, readymade and on point. You need to download these 100% editable and customizable templates and create magic through improvements and learnings from these slides.
Let's explore and see what these templates bring to the table for you!
Template 1 Key Revenue Pipeline Metrics for Measuring Website Contribution
Use this PPT Template to obtain total revenue derived through visitors, subjecting them to a pipeline or funnel for marketing. The pipeline starts at the broadest top with attract and acquire before entering the narrower nurture and qualify tunnel and ending at the bottom with engage when sales-ready on the right side of the PPT Template. This presentation offers a way to qualify leads. It involves a series of criteria the leads must satisfy, from visitors and prospects to sales-qualified leads and won deals. This is a valuable tool for pointing out areas where the revenue pipeline could be improved and implementing plans to strengthen it. Get it today!
Template 2 Monthly Comparison Key Website Metrics
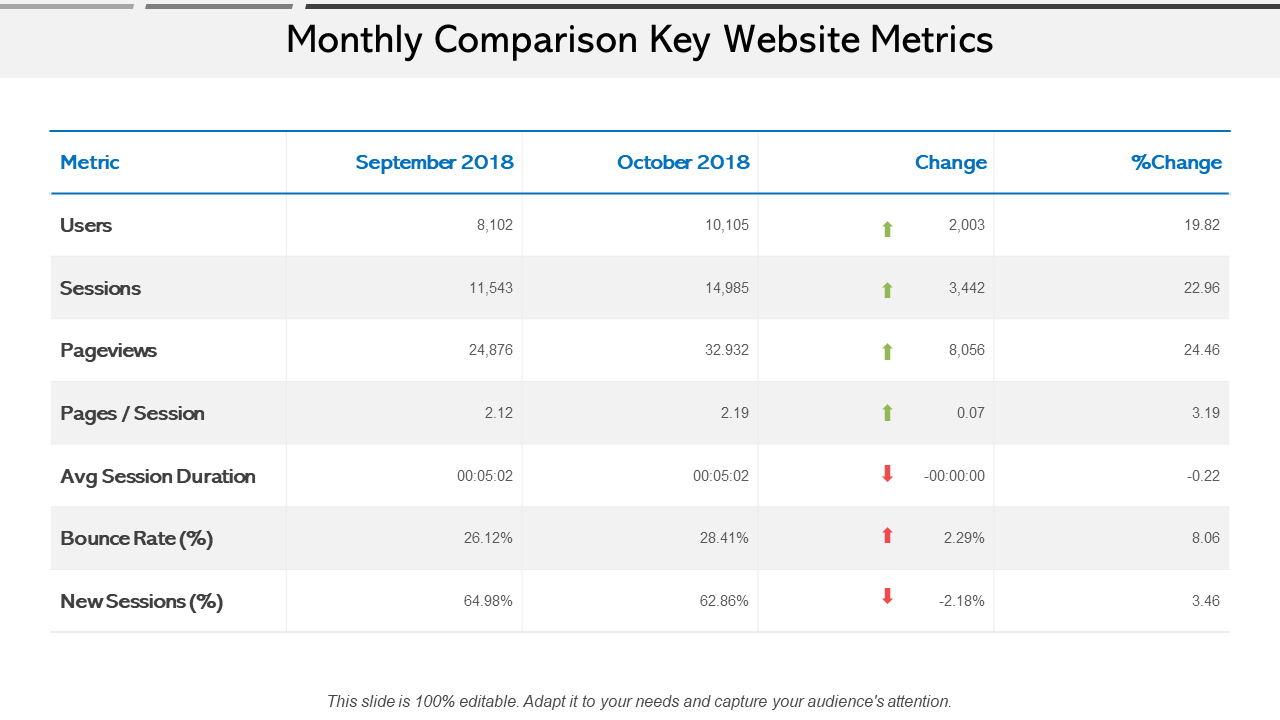
A monthly performance critical metrics analysis provides executives with a high-level perspective and digital marketing professionals with a detailed analysis. This website metrics table aids in the development and refinement of the website, with emphasis on capturing change and then acting to ensure it is always going in the right direction. It covers metrics like users, sessions, pageviews, pages/sessions, average session duration, bounce rate (%) and new sessions (%). This is a must-have for any well-equipped marketing team, social media professionals, marketing trainers, sales gurus, SEO officers, educators, marketing consultants, and other professionals. Build an effective, data-driven marketing strategy. Get it right away!
Template 3 Success Metrics Dashboard to Measure Website Progress
Use this PowerPoint Presentation to create a step-by-step guide demonstrating your company's efforts to ensure your website is the star. This slide shows the success metrics dashboard, including sessions, users, pageviews, average session duration, bounce rate, and percentage of new sessions with new and returning visitors. It also includes a donut chart depicting where you stand about getting repeat visitors. Download to measure your company's website progress.
Template 4 Website Content Audit with SEO Value and Engagement Metrics
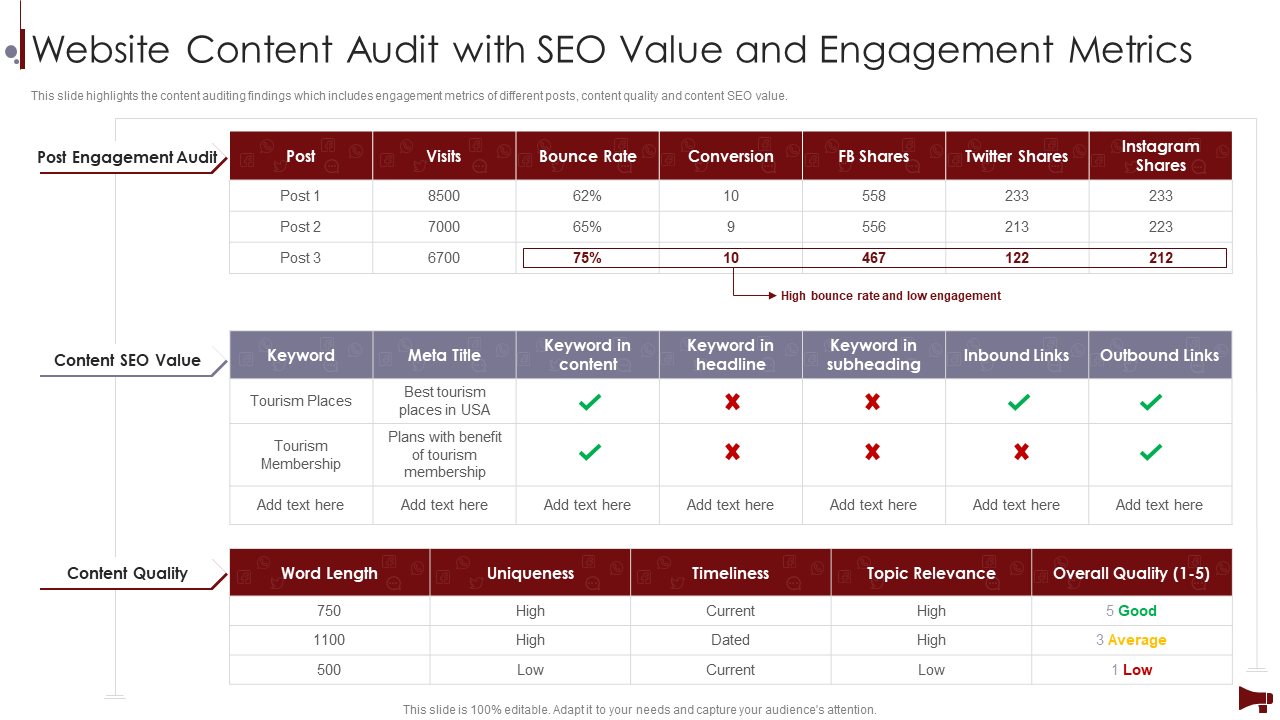
This PPT template demonstrates how to develop a robust website content audit and engagement metrics. It breaks down the process into three stages: Post-engagement audit, content SEO value, and content quality. The post-by-post analysis arrives at a consolidated conversion rate and bounce rate. In the content SEO table, one analyses everything from the presence of keywords and the links to the final score. Quality, timeliness, and topic relevance matter the most and are hence closely tracked.
Template 5 E-commerce Website Dashboard with New Orders and User Metrics
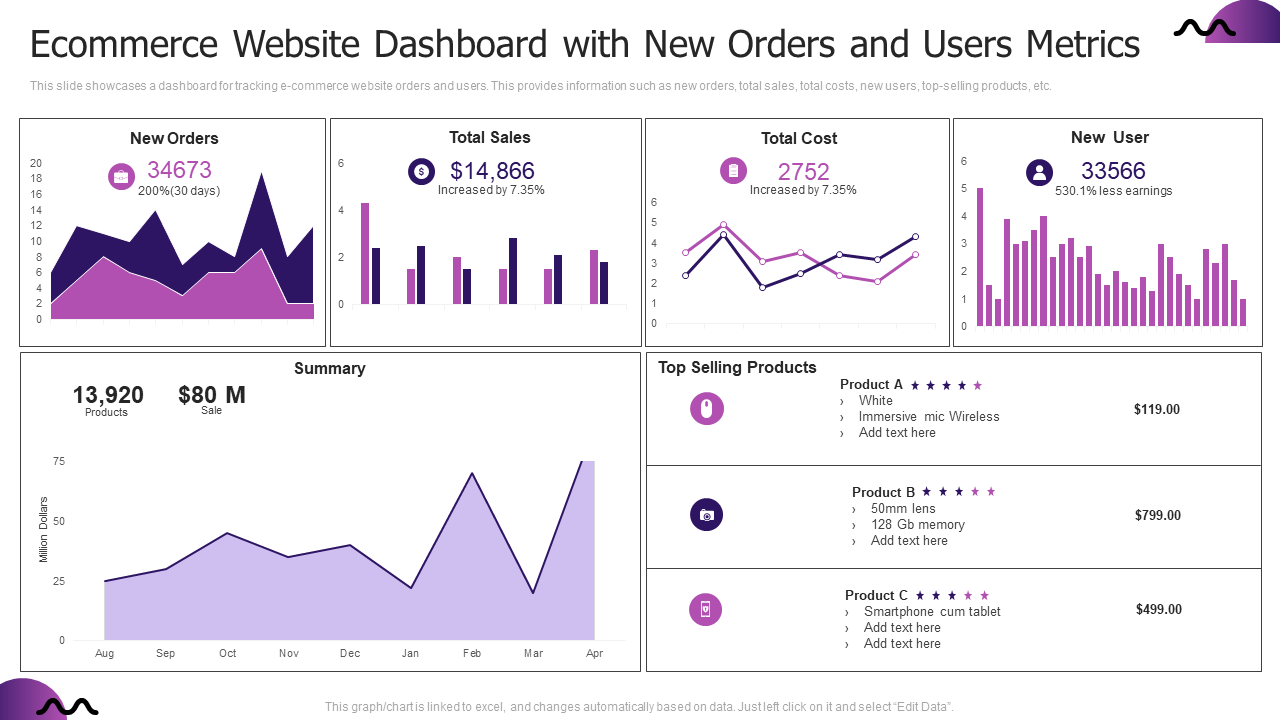
Ensure a solid stream of new orders on your website, and identify a world-class tracking mechanism through a dashboard. This slide showcases a dashboard for tracking e-commerce website orders and users. This provides information such as new orders, total sales, total costs, new users, top-selling products, etc. Download now and understand how a dashboard can reflect the reality of your efforts in numbers. There is space to conduct a detailed analysis of the products, making for an excellent tracking mechanism. Get it now!
Template 6 Efficient Analytics Metrics for Tracking Website Performance
This is a comprehensive PPT Template detailing metrics contributing to website performance and how to arrive at these efficiently. This slide exhibits measures to maintain site position in the market. This slide aims to improve the ratio of revenue to marketing costs while promoting business successfully. It includes information related to several visitors, bounce rates, etc. Use the customizable table to highlight average page views per session, the bounce rates, and so on, and move on to add the strategy to be adopted to ensure better numbers than the previous year. Grab this template now.
Template 7 Key Metrics to Measure Success of Website Marketing
Companies need to understand critical, non-negotiable metrics in the technical but wonderful world of website marketing. This PPT Template offers a dynamic and customer-centric approach for teams to evolve and realize the full potential of website marketing. The following template outlines primary metrics for real estate companies to evaluate website performance. The KPIs highlighted in the slide are total visitors, bounce rate, session duration, page views, customer conversion rate, etc. In the key takeaways, one can list three to four critical achievements.
Template 8 Marketing Website Monthly Performance Scorecard with Clicks and Conversions Metrics
This pre-designed PPT Template is a platform to assess your business' clicks and conversion metrics. The segment on campaigns with the most spending is important as it compares projects on the amount spent, objectives, results, cost per result, and impression. In clicks, the slide offers at least eight types to document and target improvement in each. In conversions, too, at a particular time, decision-makers can find website conversion, cost per website conversion, and the website conversion value. Get it now!
WEBSITES PROPEL BUSINESS
A website is a massive project and a huge business opportunity, but without the proper website metrics, it is nearly impossible to get revenue from it. The world might be a website's playground, yet the rules to get visitors onto your website are strict and must be followed. You can be creative but must abide by the numbers.
PS Websites follow a KPI-based system as well to track how it is performing. Understand these KPIs in greater detail with a click here


 Customer Reviews


