Consider a person called Alan who runs a business that sells furniture. He also has a website that has his entire catalog for e-commerce. Alan is a bit worried after he observes that although his store and website see footfall and sessions, he does not sell much from his website. He does a bit of web analytics and finds that the product pages have an unusually high bounce rate and average session duration. He finds that some of these links do not work, causing his online business to fumble. He fixes the issue and then studies the analytics over the past six months. He discovers that his online business has indeed picked up and is outpacing his in-store business.
This made-up but helpful scenario showcases how website KPIs guide businesses toward areas of improvement. These include traffic sources, page views, unique visitors, bounce rate, conversion rate, average session duration, etc.
For even small-scale businesses, employees or teams must access, analyze, and interpret this data correctly and execute suggested actions. A presentation is the most effective medium to share these insights with stakeholders.
Site Performance Metric Templates
SlideTeam’s PPT Presentations are designed to do the work for you. These templates contain content-ready and 100% editable slides that save you time and energy. The decks present the required well-researched material, and the elements can be tailored to suit your needs. No more starting from scratch; you can hit the ground running with our pre-made templates.
Let’s tour our curated collection of the 10 best Website KPI Templates.
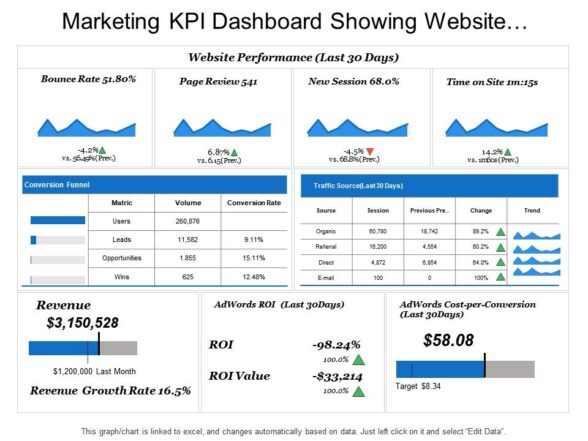
Template 1: Marketing KPI Dashboard Showing Website Performance Conversion Funnel and Revenue
Use this dashboard to collect and deliver information for your business’s online performance. Showcase data on KPIs such as the bounce rate, new sessions, revenue and its growth rate, AdWords ROI, etc. Tables are provided in the slide to present traffic sources and conversion funnel details. Employ this PPT Layout to present data in an easy-to-follow format that allows stakeholders to derive insights to make informed decisions.
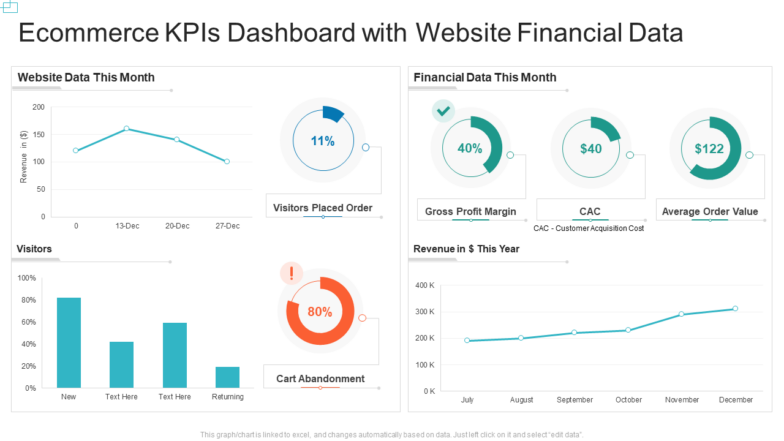
Template 2: E-commerce KPIs Dashboard Snapshot with Website Financial Data
This PowerPoint Layout focuses on financial metrics. The slide delivers information in four areas, which include website data for a given month, financial data for a given month, information on visitors, and revenue for the year. This information is aided by graphs and charts (histograms, pie charts, etc.) that convert numbers into visuals for KPIs like number of visitors that placed an order, gross profit margin, customer acquisition cost, card abandonment rate, etc. Download this template to provide the financial summary of your e-commerce venture.
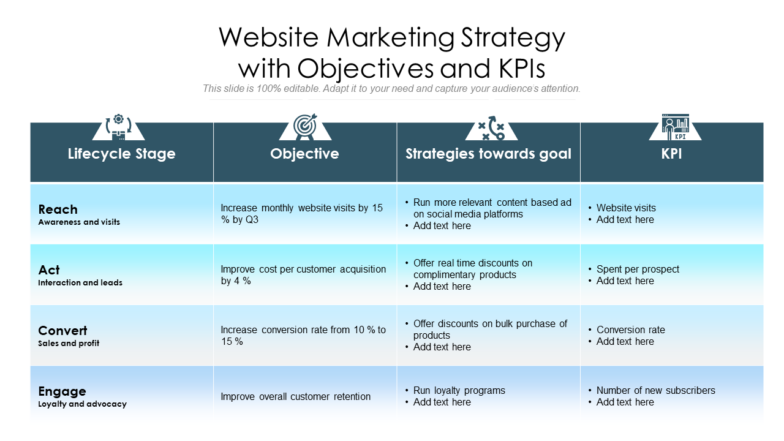
Template 3: Website Marketing Strategy with Objectives and KPIs
This PPT Layout provides easy reference for KPIs to keep in mind during marketing work for the website. The columns present the starting point with the lifecycle stage, objectives, implementation strategies, and KPIs. Factors such as reach, leads, conversions, and engagement are measured against those columns. Grab this slide from the link below to always have the roadmap to your goals within your sights.
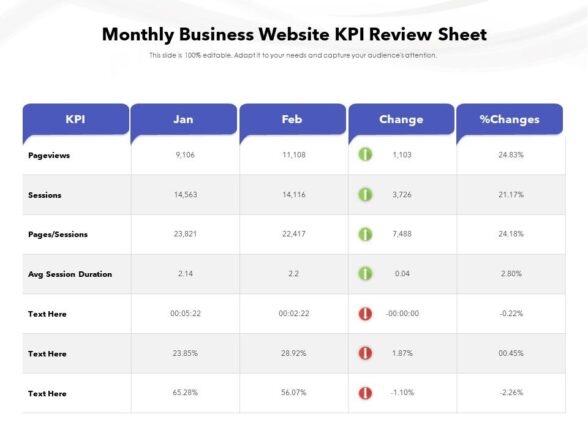
Template 4: Monthly Business Website KPI Review Sheet
This PPT Slide provides a comparative analysis to help you gauge how your website KPIs change over time. The table presents the KPIs, the months to compare, and the changes that have been noticed. This is essential to find out what the company is doing right and wrong and act accordingly. Some of these KPIs include page news, sessions, average session duration, etc. Download this template to analyze to find areas of improvement and boost policies that work.
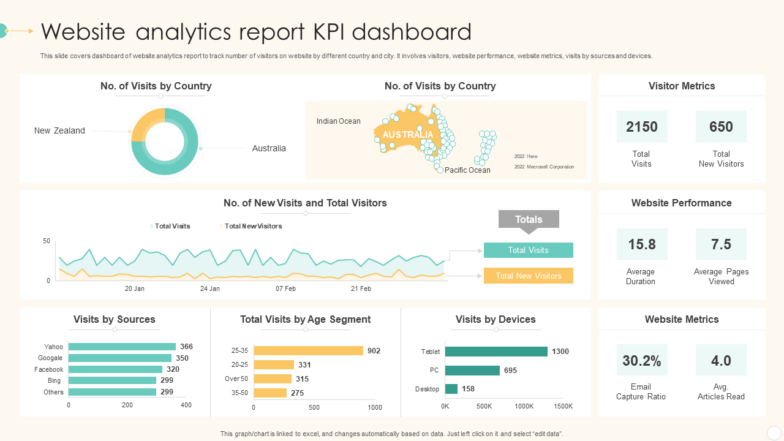
Template 5: Website Analytics Report KPI Dashboard Snapshot
Showcase the interaction of your website worldwide with this PowerPoint Slide. The slide is a hands-on collection of information on KPIs such as the number of visits by country, number of new visits and total visitors, visitor by source, age segment, and device, etc. The data is delivered through visual aids that make it intuitive for the audience and allow for easy and fast interpretation. Grab this template to repair any gaps and obstacles you may find in your website’s performance.
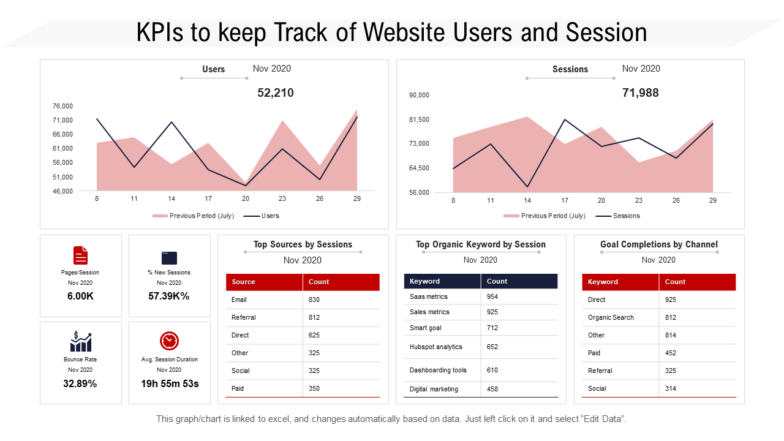
Template 6: KPIs To Keep Track of Website Users and Session
Provide an extensive overview of your website’s traffic and session details. Provide a line chart with the changes in users and sessions over months and deliver data in tables on sources of sessions, top keywords, and goal completions. The information is organized in a manner that is easy-to-follow and acts as an easy reference to keep track of your website’s performance. Grab this template from the link below.
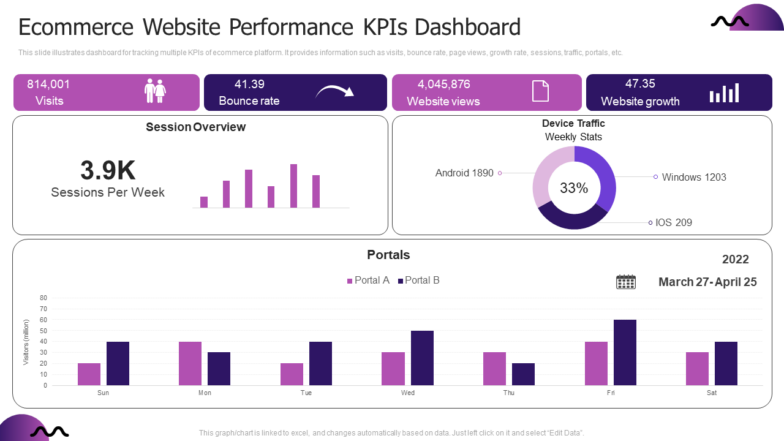
Template 7: Ecommerce Website Performance KPIs Dashboard
This dashboard layout makes an impact on the audience as you present website KPIs. With a bold pink and purple color scheme that organizes data in readymade spaces for the number of visits, bounce rate, website views and growth, etc. Visual aids provide session overviews and weekly statistics on the nature of devices. Grab this template to provide data on the portals accessed and use the information to make decisions.
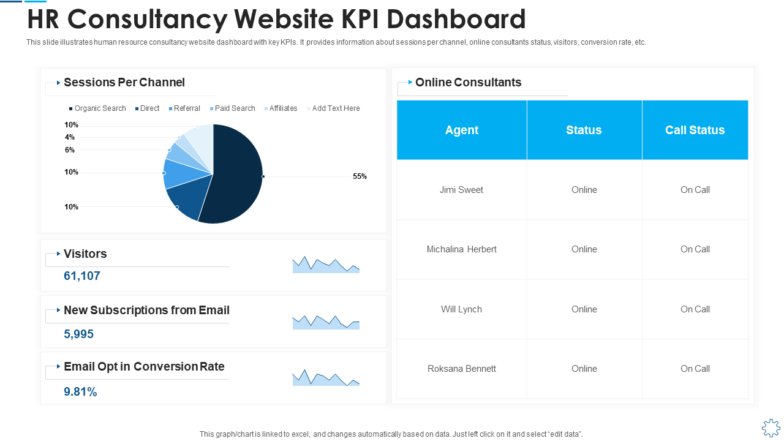
Template 8: HR Consultancy Website KPI Dashboard
This template takes HR consultancy as an example and presents the KPIs for its website’s performance. This includes sessions per channel (divided into organic search, direct, referral, etc. traffic). Present the numbers of visitors, email subscriptions, conversation rate, and details of the online consultants’ names and status. Grab this template from the link below.
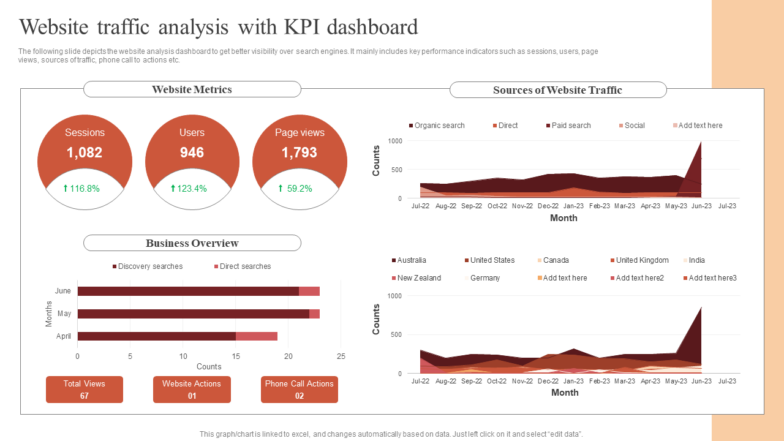
Template 9: Website Traffic Analysis with KPI Dashboard Paid Advertising Campaign Management
Present website analytics and rate it against KPIs using this PPT Slide. Present the website metrics, sources of website traffic, and business overview. This includes sessions, users, total views, website actions, and more. Download it now.
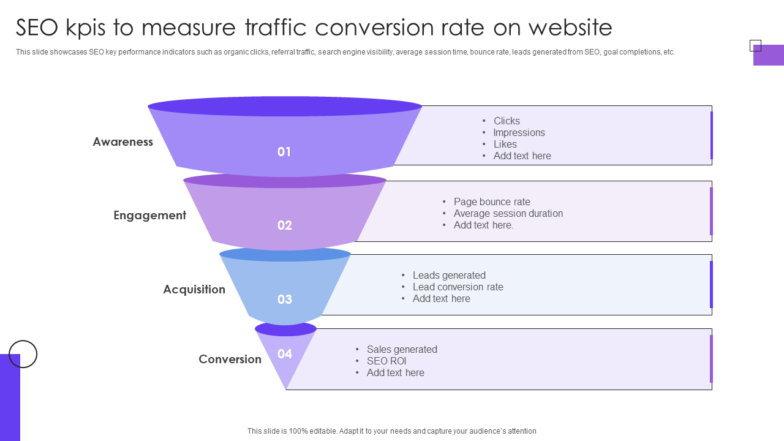
Template 10: SEO KPIs To Measure Traffic Conversion Rate on Website
Present the conversion funnel with this PPT Slide, beginning with awareness, engagement, and acquisition, and finishing with the conversion. For each step, present the KPIs that showcase information on the clicks, impressions, leads generated, conversion rate, sales generated, etc. Grab this presentation template now.
E-Commerce and More
E-commerce is the future with a solidly established presence. It’s what made Jeff Bezos the wealthiest man on Earth. As you place your business online, you will need our Website KPI Templates to do a good job of it.
Access these slides with a single click and streamline your e-commerce venture. You can choose one of our subscription services: monthly, semi-annual, annual, or annual+ with a click here.
P.S. The templates in this blog are not ranked in any particular order. Pick the one(s) you like and download it!





 Customer Reviews

