


Quarterly sales review complete powerpoint deck with slides
Do you have a tight deadline to meet? Are you looking for a quick way to complete your quarterly sales review PPT presentation? We can help you out. For this we have conceptualized a complete PPT sample file to present sales performance review data in an appealing manner. With this PowerPoint slide deck sales executives can discuss their selling results as well as can also put emphasis on sales plans to hit the targets in next quarter. Apart from this, our PowerPoint show helps sales managers to cast spotlight on current market position of the company and ongoing market trends. In short, this PPT model proves handy for sales managers to maximize the performance of their team. Best part is that PPT slides of sales cycle, quarter track record, opportunity timeline, product wise pipeline analysis and many more like these support professionals to aptly illustrate their sales performance.


You must be logged in to download this presentation.


Do you want to remove this product from your favourites?
 Impress your
 audience
Editable
of Time
PowerPoint presentation slides
Complete deck of 67 presentation templates for sales managers and sales force. Pre deigned high resolution PowerPoint graphics to save time. Sufficient space to mention titles, sub titles and text. Original and creative PowerPoint slide designs for better comprehension. Any sort of editing can be done manually and quickly. Simply put in company logo, trademark or name as per your choice. Well compatible with Google slides. Hassle free downloading process.

Content of this Powerpoint Presentation
The sales department is considered to be one of the most diligent departments across businesses. Especially, if the employees are paid predominantly in sales commissions, you’ll find them hustling, practically every second of the day. This is meant to ensure that they can get their numbers up on the chart and therefore confirm their wages (at least 80% of their take home is commission). This dedicated team gets their performance evaluated with a sales review. Be it for the overall team or the individual sales representatives, the results of the sale review are often determined by the number of successful transactions made from the new, existing, and returning customers. This department is functionally a fusion of three sub-sections namely: Lead generation, account executives, and the customer success. The respective functions being: spot potential customers, finalize purchase, and do everything in their power to retain customers.
A sales review evaluates performance in these areas and recognizes key performers/teams to attribute this success to them. When such a review is conducted for three business months (calendar or fiscal-wise) the evaluation is titled as a Quarterly sales review. It is, thus, an important assessment marking sales achievements during this time.
Explore this colorful take on quarterly sales review presentation rich in diagrams and graphs.
Every organization will have its unique mode of evaluating and awarding best sales performances for a quarterly review. Organizations can set specific sales goals that vary quarterly. Whether it is acquiring new leads, retaining customers, establishing presence in new markets, or as specific as crossing certain numbers in transactions or overall revenue, the objectives will be specific to organizations at specific moments. However, underneath the goals setting, the basic framework will be the same. Data will be collected for three months, compared against a standard, performances tallied, and the company’s revenue charts plotted. Such a sales review will also form the basis for business strategies. SlideTeam, the top resident for professional PPT Templates has designated this complete deck presentation for the sales team to evaluate how they fared in a particular quarter. Not only can you report progress, you can establish criteria for assessment of each quarter, define evaluating teams, and devise commissions for individual members with it. Hurry, let’s explore the details of this complete deck PPT Presentation.
Template 1: Quarterly Pipeline Summary
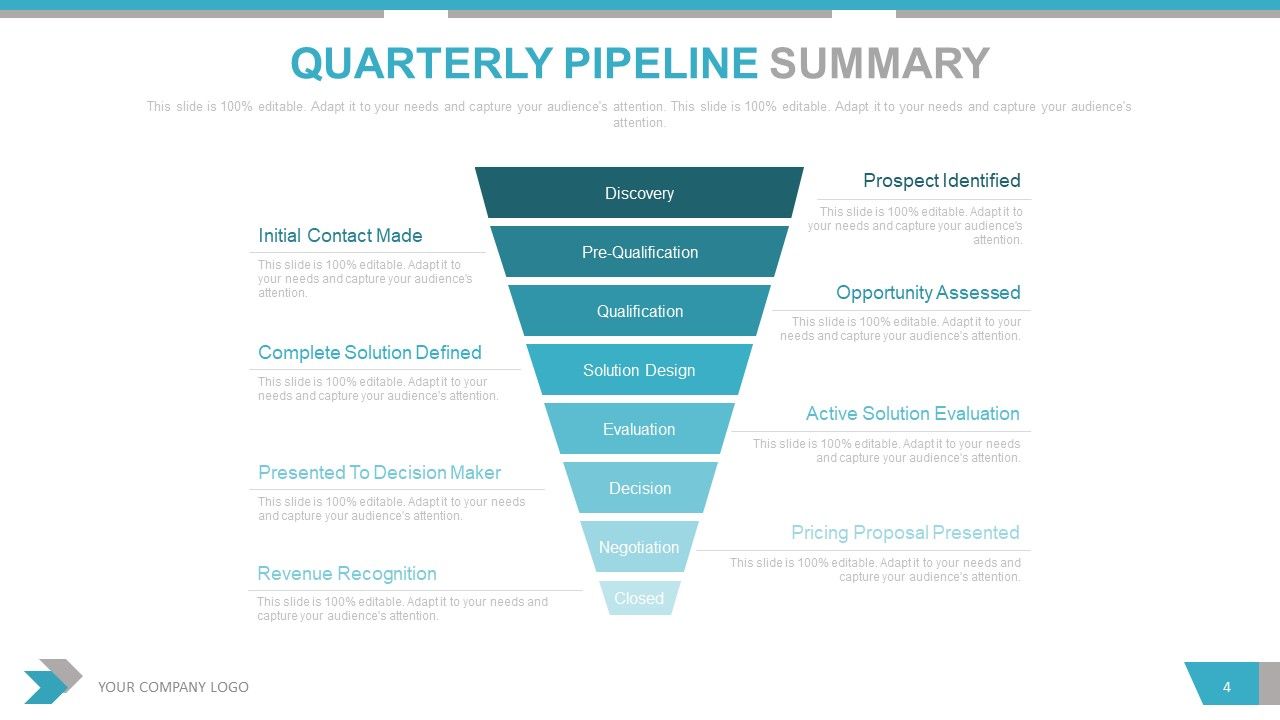
Use this pipeline diagram to outline steps involved in the sales process that were followed in the business quarter. Identify intermediate steps in closing deals right from the first step of prospect identification. Use the color gradience to structure and provide a direction for the flow of these steps. List the eight steps, as shown, till the process culminates in revenue collection.
Template 2: Sales Cycle

Share a snapshot of the sales cycle that was followed during the quarter. Use this PPT Diagram to identify steps like awareness, consideration, purchase,service, and loyalty as you inform and onboard new prospects into your sales cycle during that quarter.
Template 3: Key Sales Performance Metrics
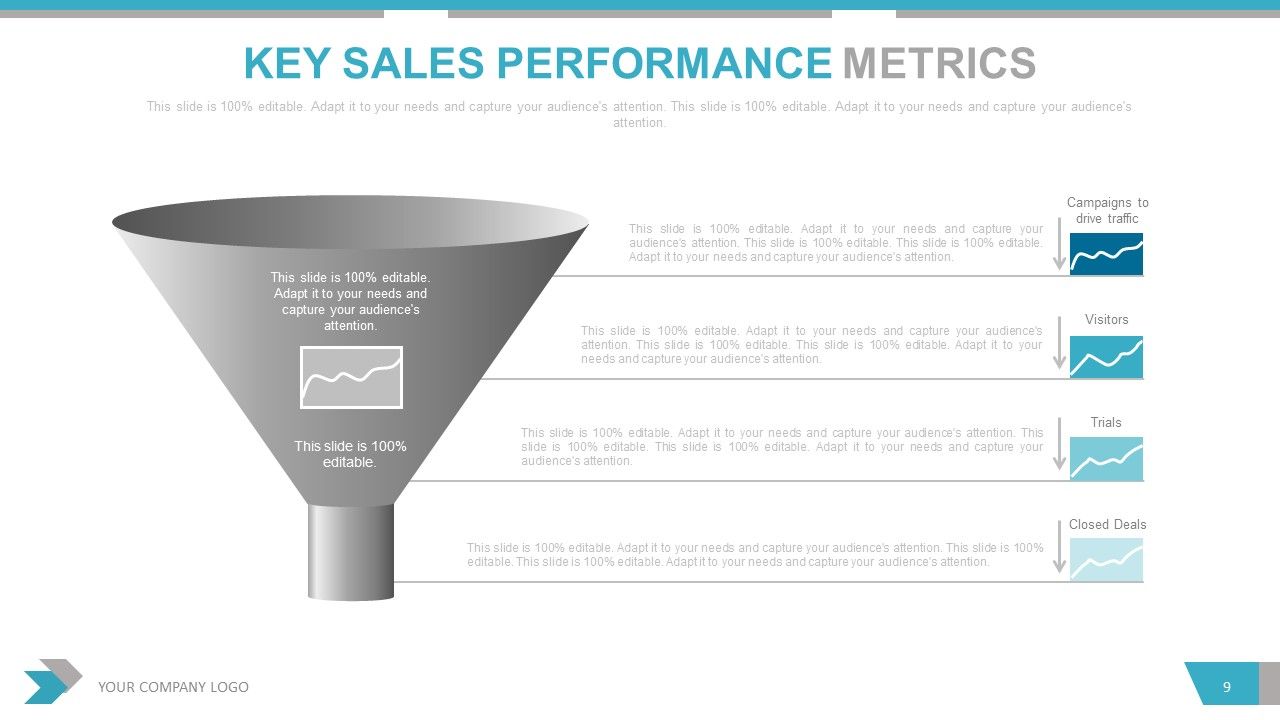
Use this funnel-structure PPT Layout to enlist metrics you want to use to measure success in your sales activities. Identify sets of parameters that leads are subjected to, before these qualify as potential customers or for audiences to fall under the category of prospective leads. Identify the qualification metrics along with their alignment in this process using this 100% editable and customizable PPT Diagram.
Template 4: Opportunity Score
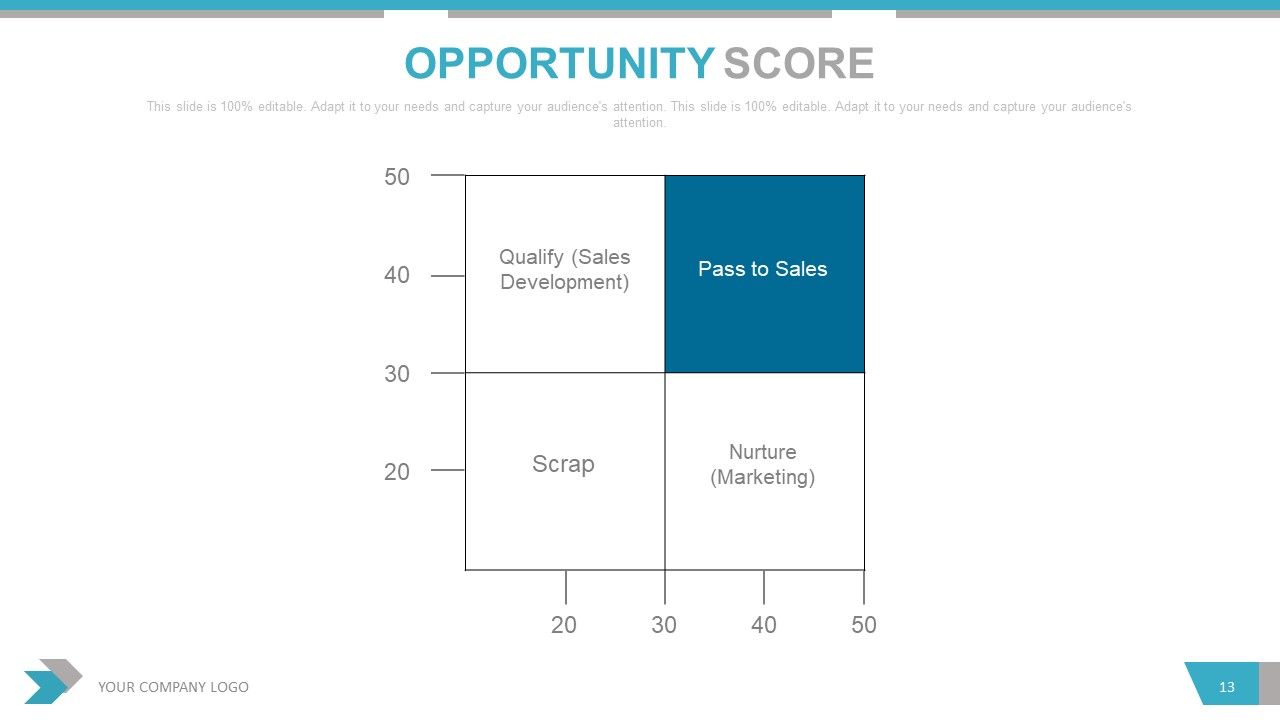
Use this matrix diagram to identify lead opportunities and parameters that qualify them as one. Determine the two variables to further distinguish prospects into quantifiable leads, scraps, those to be nurtured, and the ones to be passed onto sales for more steps.
Template 5: Win-Loss Review
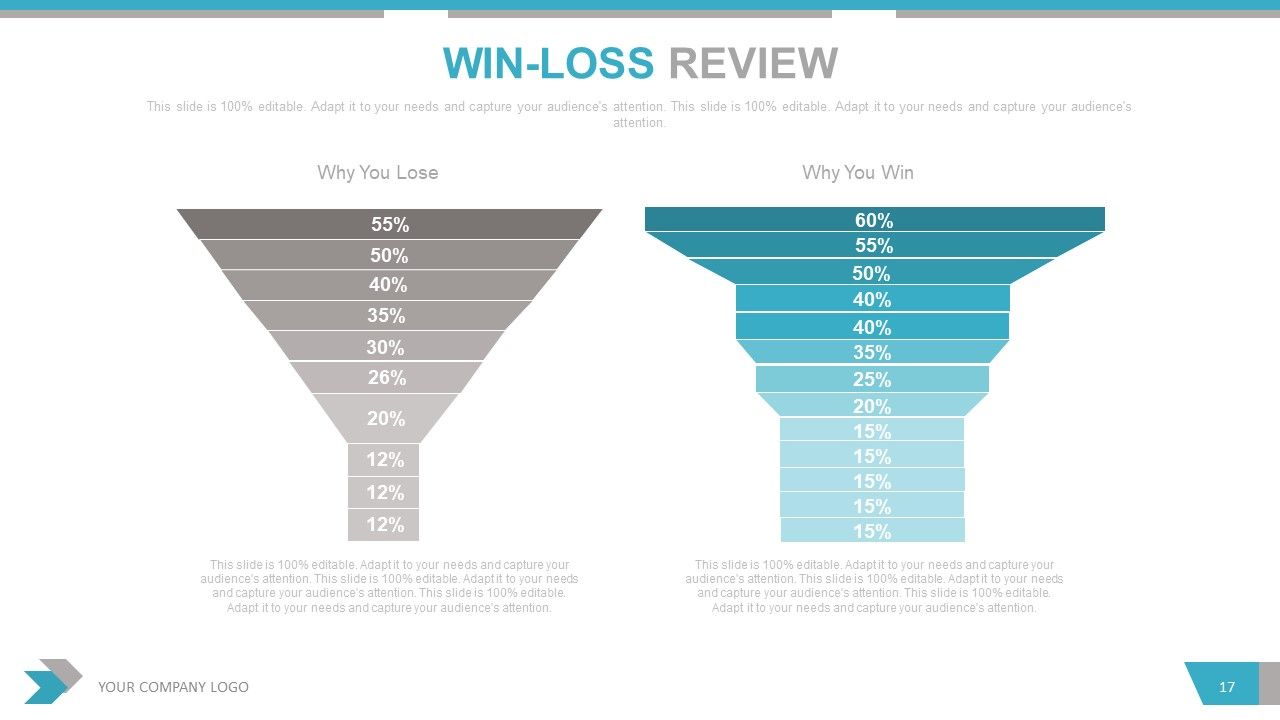
In your quarterly sales review, this win-loss analysis template will be essential to identify factors that resulted in success in your sales operations. Identify their contribution to success or failure using this funnel diagram and depict the same with a percentage value as shown. Use color coding to distinguish successful techniques from the ones that made you lose.
Template 6: Key Sales Initiatives
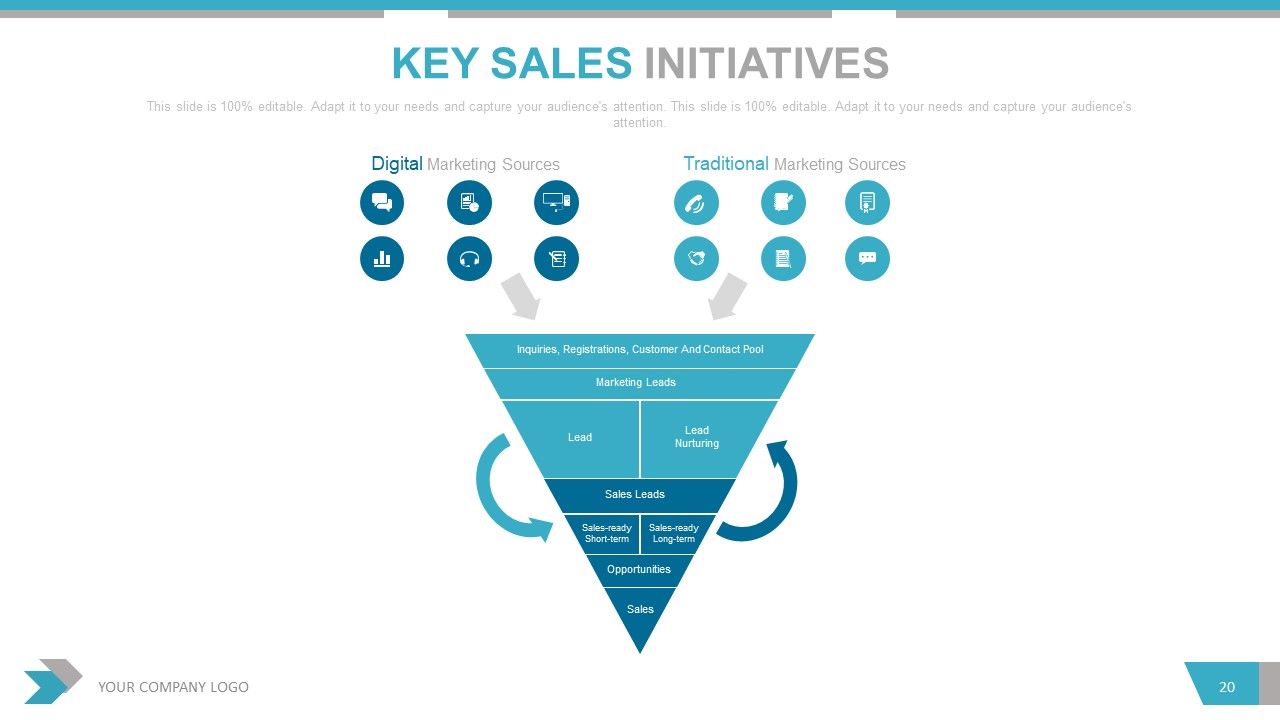
List the key initiatives taken during the quarter with this PPT Template. Mention the digital and traditional sources employed and their importance in the sales funnel. Demonstrate the interlink between each step of the sales funnel. Deploy icons and graphics of this PPT Layout to add a visual appeal to your demonstration.
Template 7: Sales Rep KPI Tracker

Once you have shared your strategies and techniques, provide a snapshot of your performance, especially that of your sales reps. Mention their success rates in cold calling, acquiring leads, converting leads, and creating loyal customer base. Mention the success rates in terms of numbers as shown.
Template 8: Partner Sales

Highlight specific sales partners that your business has explored in the last quarter using this PPT Layout. Mention those channels, mediums, and agencies with the cloud-design as shown. Further, you can discuss the nature of those partnerships like incentive programs, promotions, deal registrations, etc to also justify the expenses and audience reach.
Template 9: Sales Process Map

Summarize the main idea of a sales funnel and the specific techniques that were employed in the last quarter with this PPT Slide. Focus on the percentage of lead conversion into purchasing customers by sharing its details and also visually representing it with the diagram, as depicted. State the effectiveness of your sales funnel with this visually-appealing PPT Layout.
Template 10: BCG Matrix
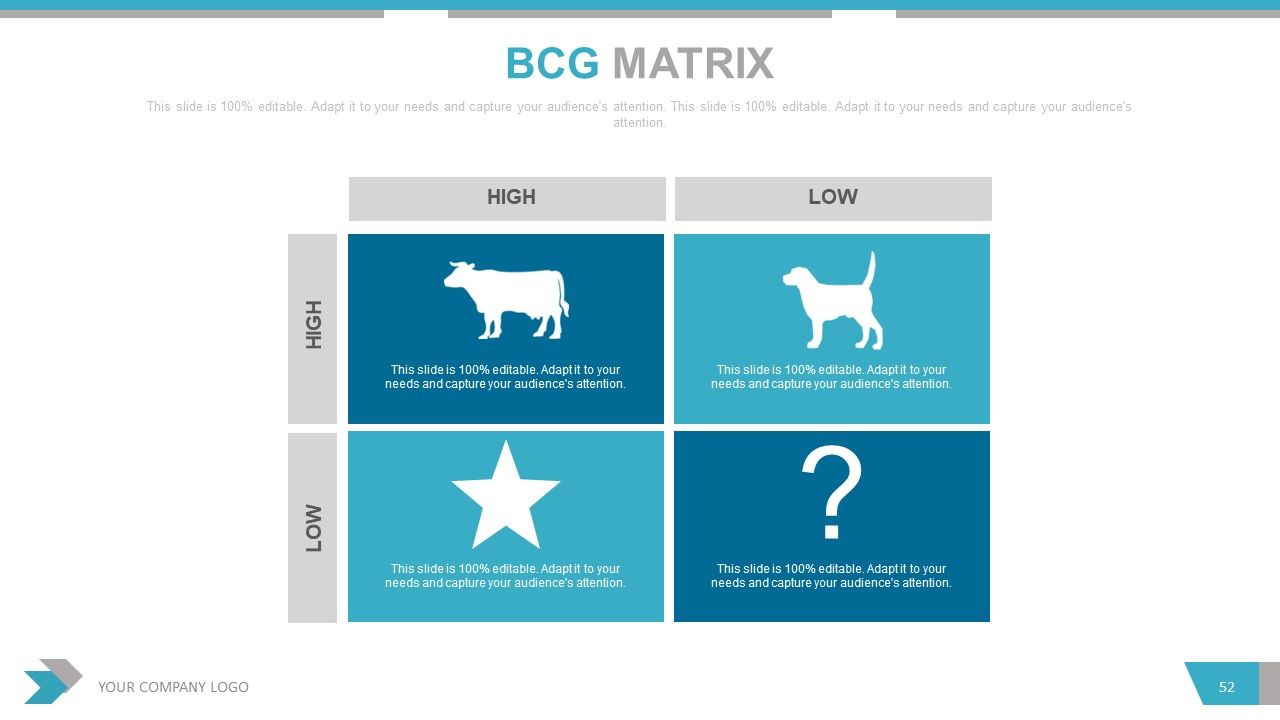
A BCG matrix in your sales review will help you evaluate customers, leads, and target audience to differentiate them into the four regions important for any business. Are these factors dead-ends (dog), resource-exhausting(star), profitable(cash cow), or unprecedented reservoir (question mark)? Determine their nature and the percentage under each of these sections using this PPT Diagram.
INSIGHTS MATTER!
And that’s how you prepare and submit an insightful sales review by including more than just numbers and statistics. It will help your audience not only evaluate success trends, but also understand the background processes and methods of assessment. Your evaluation report will be more clear and easy to follow.
PS: Looking for a more graphical PPT Presentation to share aspects of your sales review? Here’s our best bet.
Quarterly sales review complete powerpoint deck with slides with all 67 slides:
Our Quarterly Sales Review Complete Powerpoint Deck With Slides ensure you don't ever lose heart. They give you the courage to continue fighting.
-
Informative design.
-
Helpful product design for delivering presentation.
