All Business Slides Financials Powerpoint Diagram Slide
-
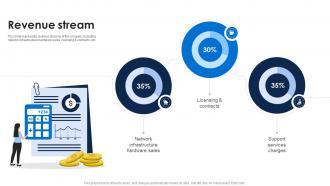 Revenue Stream Cisco Investor Funding Elevator Pitch Deck
This slide represents revenue streams of the company including network infrastructure hardware sales, licensing and contracts, etc. Present the topic in a bit more detail with this Revenue Stream Cisco Investor Funding Elevator Pitch Deck Use it as a tool for discussion and navigation on Network Infrastructure, Sales, Licensing This template is free to edit as deemed fit for your organization. Therefore download it now.
-
 Investor profile portfolio powerpoint presentation slides
Slides are editable in PowerPoint. This presentation has 60 slides. Downloads are risk-free. This PPT is useful for the investment bankers and consultants. Templates are compatible with Google Slides. Customers have Prime support. PPT works well in standard and widescreen.This is a one stage process. The stages in this process are investor profile portfolio, financial analysis, financial services, business plan development, cost reduction strategies, strategic planning, strategic management.
-
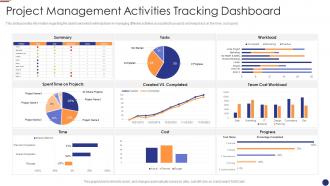 Project dashboard agile project management for software development it
This slide provides information regarding the dashboard which will help team in managing different activities associated to projects and keep track on the time, cost spent.Deliver an outstanding presentation on the topic using this Project Dashboard Agile Project Management For Software Development IT . Dispense information and present a thorough explanation of Project Management Activities Tracking Dashboard using the slides given. This template can be altered and personalized to fit your needs. It is also available for immediate download. So grab it now.
-
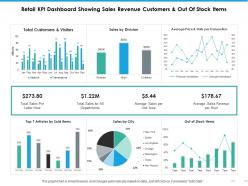 96954373 style essentials 2 financials 6 piece powerpoint presentation diagram infographic slide
Presenting this set of slides with name - Retail Kpi Dashboard Showing Sales Revenue Customers And Out Of Stock Items. This is a six stage process. The stages in this process are Percentage, Product, Management, Marketing, Business.
-
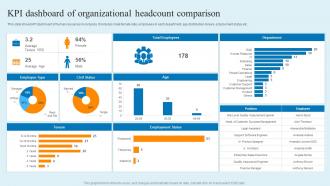 KPI Dashboard Of Organizational Headcount Comparison
This slide shows KPI dashboard of human resources in company. It includes male female ratio, employees in each department, age distribution, tenure, employment status etc. Introducing our KPI Dashboard Of Organizational Headcount Comparison set of slides. The topics discussed in these slides are KPI Dashboard, Organizational Headcount Comparison. This is an immediately available PowerPoint presentation that can be conveniently customized. Download it and convince your audience.
-
 Budget management powerpoint presentation slides
Presenting this set of slides with name - Budget Management Powerpoint Presentation Slides. This PPT deck displays eighty slides with in-depth research. Our topic oriented Budget Management Powerpoint Presentation Slides presentation deck is a helpful tool to plan, prepare, document and analyze the topic with a clear approach. We provide a ready to use deck with all sorts of relevant topics subtopics templates, charts and graphs, overviews, analysis templates. It showcases of all kind of editable templates, edit the color, text, font style at your ease. Download PowerPoint templates in both widescreen and standard screen. The presentation is fully supported by Google Slides. It can be easily converted into JPG or PDF format.
-
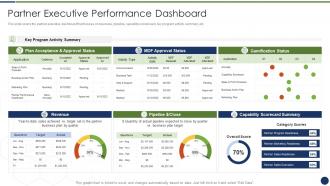 Partner executive performance dashboard improve management complex business
This slide covers the partner executive dashboard that focuses on revenues, pipeline, capability scoreboard, key program activity summary, etc. Present the topic in a bit more detail with this Partner Executive Performance Dashboard Improve Management Complex Business. Use it as a tool for discussion and navigation on Revenue, Pipeline Dollar, Capability Scorecard Summary, Target. This template is free to edit as deemed fit for your organization. Therefore download it now.
-
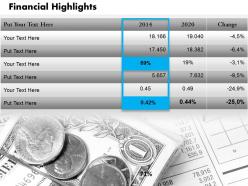 51470283 style essentials 2 financials 1 piece powerpoint presentation diagram infographic slide
Tremendous resolution PPT templates for better visual experience and for the use of financial experts and specialists from diverse fields, Fully editable features such as text, layout designs etc of the Presentation designs, Alluring Presentation graphics for the potential audiences to download easily, Space adequacy with all Presentation diagrams to add subsequent caption or subheading, Flexible option to convert in to various file layouts as PDF or JPG, Adaptable with all Google slides and other operating software’s.
-
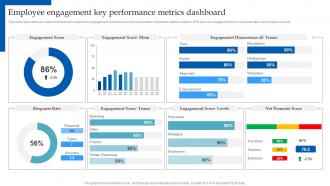 HR Analytics Implementation Employee Engagement Key Performance Metrics Dashboard
This slide represents key metrics dashboard to analyze the engagement of employees in the organization. It includes details related to KPIs such as engagement score, response rate, net promoter score etc. Present the topic in a bit more detail with this HR Analytics Implementation Employee Engagement Key Performance Metrics Dashboard. Use it as a tool for discussion and navigation on Engagement Score, Response Rate, Marketing. This template is free to edit as deemed fit for your organization. Therefore download it now.
-
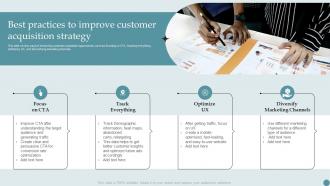 Best Practices To Improve Customer Acquisition Strategy Consumer Acquisition Techniques With CAC
This slide covers ways of enhancing customer acquisition approaches, such as focusing on CTA, tracking everything, optimizing UX, and diversifying marketing channels. Introducing Best Practices To Improve Customer Acquisition Strategy Consumer Acquisition Techniques With CAC to increase your presentation threshold. Encompassed with four stages, this template is a great option to educate and entice your audience. Dispence information on Focus CTA, Track Everything, Optimize UX, Diversify Marketing Channels, using this template. Grab it now to reap its full benefits.
-
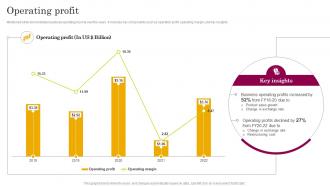 Operating Profit Astrazeneca Company Profile CP SS
Mentioned slide demonstrates business operating income over the years. It includes key components such as operation profit, operating margin, and key insights. Deliver an outstanding presentation on the topic using this Operating Profit Astrazeneca Company Profile CP SS Dispense information and present a thorough explanation of Restructuring Cost, Change In Exchange Rate using the slides given. This template can be altered and personalized to fit your needs. It is also available for immediate download. So grab it now.
-
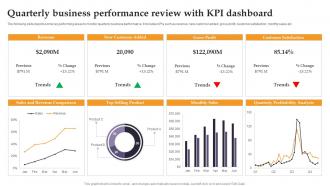 Quarterly Business Performance Review With KPI Dashboard
The following slide depicts some key performing areas to monitor quarterly business performance. It includes KPIs such as revenue, new customer added, gross profit, customer satisfaction, monthly sales etc. Presenting our well structured Quarterly Business Performance Review With KPI Dashboard. The topics discussed in this slide are Sales And Revenue Comparison, Top Selling Product, Customer Satisfaction. This is an instantly available PowerPoint presentation that can be edited conveniently. Download it right away and captivate your audience.
-
 Plan vs forecast powerpoint presentation slides
Presenting Plan Vs Forecast PowerPoint Presentation Slides. This presentation covers 25 professionally crafted PowerPoint templates, all of them being hundred percent editable in PowerPoint. Content fonts, colors and slide background of the presentation slides are adjustable. Employ data driven charts and graphs to showcase statistics highlights. You can download the presentation slides in both wide view (16:9) and standard screen (4:3) aspect dimension. The PowerPoint slides are fully flexible with Google Slides and other online software’s. Presentation can be saved in JPG or PDF format. The presentation slides can be personalized by incorporating a brand name or logo. Premium product support is provided.
-
 Value based pricing strategy powerpoint presentation slides
Presenting this set of slides with name - Value Based Pricing Strategy Powerpoint Presentation Slides. Our topic-specific Value-Based Pricing Strategy Powerpoint Presentation Slides deck contains twenty-four slides to formulate the topic with a sound understanding. A range of editable and ready to use slides with all sorts of relevant charts and graphs, overviews, topics subtopics templates, and analysis templates makes it all the more worth. This deck displays creative and professional looking slides of all sorts. Can be converted into various formats like PDF, JPG, and PNG. It is available in both standard and widescreen.
-
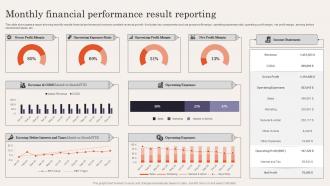 Monthly Financial Performance Result Reporting
This slide showcases a report showing monthly results financial performance to ensure constant revenue growth. It includes key components such as gross profit margin, operating expenses ratio, operating profit margin, net profit margin, earning before interest and taxes, etc. Introducing our Monthly Financial Performance Result Reporting set of slides. The topics discussed in these slides are Gross Profit Margin, Operating Expenses, Income Statement. This is an immediately available PowerPoint presentation that can be conveniently customized. Download it and convince your audience.
-
 Amazon com inc company profile overview financials and statistics from 2014-2018
This report is an extensively researched profile on company Amazon Com Inc Company Profile Overview Financials And Statistics From 2014 to 2018 in industry Consumer Goods And FMCG and Retail and Trade and E-Commerce and has been prepared by SlideTeam industry experts after extensively researching through hundreds of data sources. This is part of our Company Profiles products selection, and you will need a Paid account to download the actual report with accurate data and sources for each statistic and fact. Downloaded report will be in Powerpoint and will contain the actual editable slides with the actual data and sources for each data where applicable. Download it immediately and use it for your business.
-
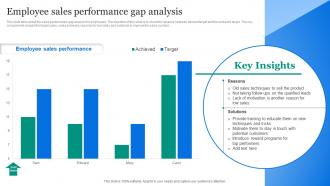 Employee Sales Performance Gap Analysis
This slide talks about the sales performance gap analysis for employees. The objective of this slide is to show the variance between desired target and the achieved target. The key components include the target sales, sales achieved, reasons for low sales and solutions to improve the sales number. Presenting our well structured Employee Sales Performance Gap Analysis. The topics discussed in this slide are Employee Sales, Performance Gap Analysis. This is an instantly available PowerPoint presentation that can be edited conveniently. Download it right away and captivate your audience.
-
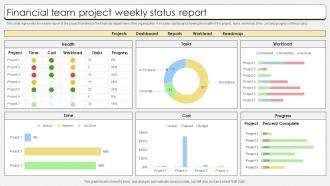 Financial Team Project Weekly Status Report
This slide represents the weekly report of the project handled by the financial department of the organization. It includes dashboard showing the health of the project, tasks, workload, time, cost and progress of the project. Presenting our well structured Financial Team Project Weekly Status Report. The topics discussed in this slide are Financial Team, Project Weekly, Status Report. This is an instantly available PowerPoint presentation that can be edited conveniently. Download it right away and captivate your audience.
-
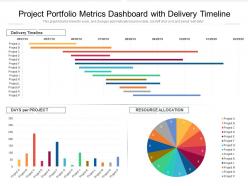 Project portfolio metrics dashboard with delivery timeline
Presenting this set of slides with name Project Portfolio Metrics Dashboard With Delivery Timeline. The topics discussed in these slides are Delivery Timeline, Resource Allocation, Days Per Project. This is a completely editable PowerPoint presentation and is available for immediate download. Download now and impress your audience.
-
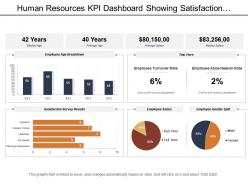 1346526 style essentials 2 financials 4 piece powerpoint presentation diagram infographic slide
Presenting human resources KPI dashboard showing satisfaction survey result age breakdown data driven PowerPoint slide. Fit to be used with the Google slides. Replace the visuals, text and the content in the slide design. Change the size, style and orientation of the slides. Use your company’s name or brand name to make it your own presentation template. Beneficial for managers, professors, marketers, etc. Flexible option for conversion in PDF or JPG formats. Available in Widescreen format also. Useful for making business plan and strategies.
-
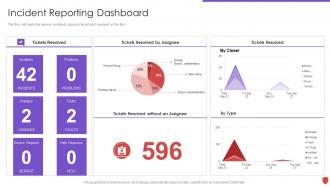 Cyber security risk management incident reporting dashboard
The firm will track the various incidents issues faced and resolved in the firm. Present the topic in a bit more detail with this Cyber Security Risk Management Incident Reporting Dashboard. Use it as a tool for discussion and navigation on Tickets Resolved, Tickets Resolved By Assignee, Tickets Resolved, Tickets Resolved Assignee. This template is free to edit as deemed fit for your organization. Therefore download it now.
-
 79732641 style essentials 2 financials 4 piece powerpoint presentation diagram infographic slide
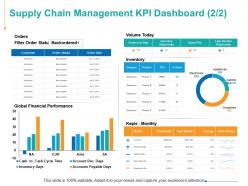
Presenting this set of slides with name - Supply Chain Management KPI Dashboard Finance Ppt Powerpoint Presentation Files. This is a four stage process. The stages in this process are Customer, Inventory, Marketing, Strategy, Planning.
-
 Information Technology Organization Executive Summary
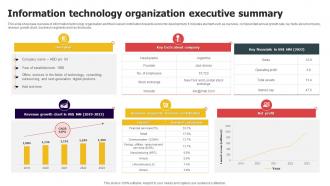
This slide showcase overview of information technology organization and their overall contribution towards economic development. It includes element such as overview, compounded annual growth rate, key facts about company, revenue growth chart, business segments and key financials. Presenting our well structured Information Technology Organization Executive Summary. The topics discussed in this slide are Overview, Net Profit Company, Key Facts. This is an instantly available PowerPoint presentation that can be edited conveniently. Download it right away and captivate your audience.
-
 94541290 style linear single 6 piece powerpoint presentation diagram infographic slide
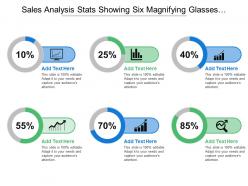
Presenting this set of slides with name - Sales Analysis Stats Showing Six Magnifying Glasses And Percentages. This is a six stage process. The stages in this process are Stats, Statistics, Data.
-
 Project Task Tracker List With Progress And Completion
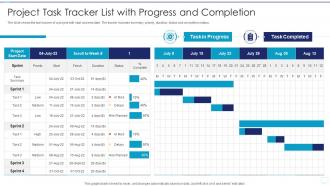
The slide shows the task tracker of a project with start and end date. The tracker includes summary, priority, duration, status and completion status. Introducing our Project Task Tracker List With Progress And Completion set of slides. The topics discussed in these slides are Progress, Completion, Project Task. This is an immediately available PowerPoint presentation that can be conveniently customized. Download it and convince your audience.
-
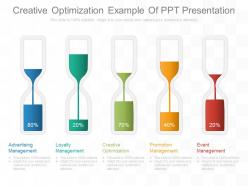 27630691 style essentials 2 financials 5 piece powerpoint presentation diagram infographic slide
Compatibility with Google slides. Compatibility with various other formats and software options. High resolution visuals. Hassle free projection on wide screen, without getting any blurred image. Ease of modification. Execute the desired changes in the text, color, orientation and fonts. Assistance for executing changes in form of pictorial guidelines. Widely accessed by team of brand managers, advertisers, marketing teams and entrepreneurs to boost up their market presence and revenue.The stages in this process are advertising management, loyalty management, creative optimization, promotion management, event management.
-
 40065607 style layered vertical 9 piece powerpoint presentation diagram infographic slide
Hundred percent editable PowerPoint slide as text, color, shade, shape and size can be edited. Presentation template can be used independently or in collaboration with any other graphic source. High resolution PPT design ensures the zooming of image does not deter its quality. Presentation graphic is compatible with both standard and wide screen. Design is adaptable to numerous software available both online and offline. Easy to download and save for immediate or later use.
-
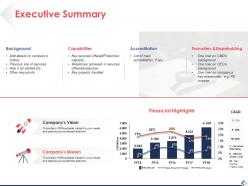 49697889 style essentials 2 financials 4 piece powerpoint presentation diagram infographic slide
Presenting this set of slides with name - Executive Summary Background Ppt Pictures Slide Download. This is a four stage process. The stages in this process are Background, Capabilities, Accreditation, Promoters, Shareholding.
-
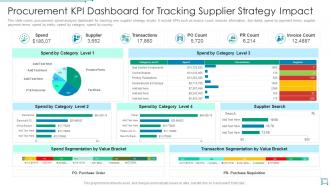 Procurement kpi dashboard for tracking supplier strategy impact
This slide covers procurement spend analysis dashboard for tracking new supplier strategy results. It include KPIs such as invoice count, invoices information, due dates, spend by payment terms, supplier payment terms, spend by entity, spend by category, spend by country. Introducing our Procurement KPI Dashboard For Tracking Supplier Strategy Impact set of slides. The topics discussed in these slides are Transactions, Supplier, Purchase Order. This is an immediately available PowerPoint presentation that can be conveniently customized. Download it and convince your audience.
-
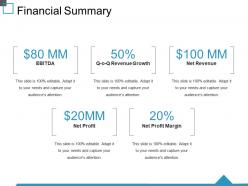 98452619 style essentials 2 financials 5 piece powerpoint presentation diagram infographic slide
Presenting this set of slides with name - Financial Summary Ppt Deck. This is a five stage process. The stages in this process are Ebitda, Net Profit, Net Profit Margin, Net Revenue, Revenue Growth.
-
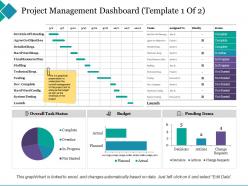 66854364 style essentials 2 financials 3 piece powerpoint presentation diagram infographic slide
Presenting this set of slides with name - Project Management Dashboard Agree On Objectives. This is a three stage process. The stages in this process are Final Resource Plan, Agree On Objectives, System Testing.
-
 Business plan for fundraising powerpoint presentation slides
Presenting business plan for fundraising PowerPoint presentation slides. Download is quick and can be easily shared. This presentation includes 70 professional PPT slides. Suitable for corporate leaders, marketing professionals and business associates. All templates are fully customizable in PowerPoint. Change the font size, font color, graphic colors, and slide background without any hassle. The slides have text placeholders to enter your presentation content. Presentation is downloaded in both widescreen (16:9) and standard screen (4:3) aspect ratio. Ease of inserting logo, icon and image as per the requirement. Presentation templates are compatible with Google slides.
-
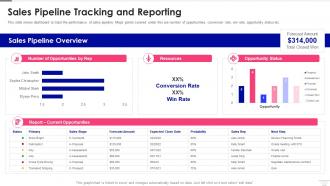 Sales Pipeline Management Sales Pipeline Tracking And Reporting
This slide shows dashboard to track the performance of sales pipeline. Major points covered under this are number of opportunities, conversion rate, win rate, opportunity status etc. Deliver an outstanding presentation on the topic using this Sales Pipeline Management Sales Pipeline Tracking And Reporting. Dispense information and present a thorough explanation of Sales Pipeline Tracking And Reporting using the slides given. This template can be altered and personalized to fit your needs. It is also available for immediate download. So grab it now.
-
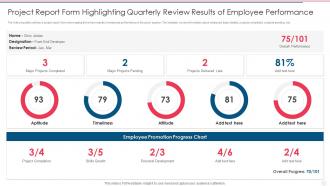 Project Report Form Highlighting Quarterly Review Results Of Employee Performance
The following slide outlines a project report form showcasing the review results of employee performance in the given quarter. The template covers information about employee basic details, projects completed, projects pending, etc. Introducing our Project Report Form Highlighting Quarterly Review Results Of Employee Performance set of slides. The topics discussed in these slides are Employee, Performance, Highlighting,Quarterly. This is an immediately available PowerPoint presentation that can be conveniently customized. Download it and convince your audience.
-
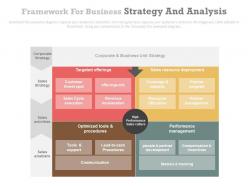 94918099 style essentials 2 financials 4 piece powerpoint presentation diagram infographic slide
High resolution and pixel friendly image icons. Easy to customize. Offered instructions to modify. Download and save instantly in variety of formats. Use it with Google slides or Microsoft office software. Replace the traditional logo with your company’s name. Open on a big screen without any pixilation of images or graphics. Often used by the marketing people, managing departments and other business professionals.
-
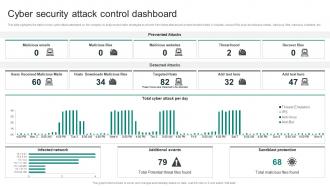 Cyber Security Attack Control Dashboard
This slide highlights the data to track cyber attack attempted on the company to analyze and make strategies to prevent from these attacks and protect sensitive data. It includes various KPIs such as malicious emails, malicious files, malicious websites, etc. Introducing our Cyber Security Attack Control Dashboard set of slides. The topics discussed in these slides are Malicious Emails, Malicious Files, Malicious Websites This is an immediately available PowerPoint presentation that can be conveniently customized. Download it and convince your audience.
-
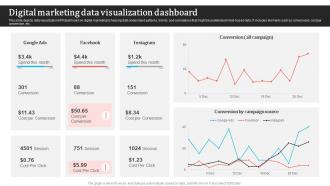 Digital Marketing Data Visualization Dashboard
This slide depicts data visualization KPI dashboard on digital marketing to help big data understand patterns, trends, and correlations that might be undetected in text-based data. It includes elements such as conversions, cost per conversion, etc. Introducing our Digital Marketing Data Visualization Dashboard set of slides. The topics discussed in these slides are Digital Marketing, Data Visualization Dashboard.This is an immediately available PowerPoint presentation that can be conveniently customized. Download it and convince your audience.
-
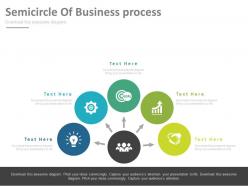 25691906 style essentials 2 financials 5 piece powerpoint presentation diagram infographic slide
Extraordinary and Exclusive PPT presentation backgrounds. Provides high quality and error free performance. Having realistic and futuristic approach. Extremely popular and trending patterns. Completely personalised by allowing the incorporation of business logos and tags. Compatible with Google framework. Portrays professionalism with its sober structure.
-
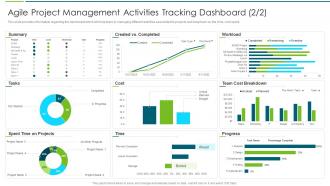 Agile Transformation Approach Playbook Agile Project Management Activities Tracking
This slide provides information regarding the dashboard which will help team in managing different activities associated to projects and keep track on the time, cost spent. Deliver an outstanding presentation on the topic using this Agile Transformation Approach Playbook Agile Project Management Activities Tracking. Dispense information and present a thorough explanation of Management, Tracking, Dashboard using the slides given. This template can be altered and personalized to fit your needs. It is also available for immediate download. So grab it now.
-
 Risk Management Dashboard For Information Risk Assessment And Management Plan For Information Security
This slide showcases dashboard that can help organization to track the major information security risks and resolve them in timely manner. Its key components are risk rating breakdown, heat map, action plan and top 5 vulnerabilities Deliver an outstanding presentation on the topic using this Risk Management Dashboard For Information Risk Assessment And Management Plan For Information Security. Dispense information and present a thorough explanation of Management, Dashboard, Information using the slides given. This template can be altered and personalized to fit your needs. It is also available for immediate download. So grab it now.
-
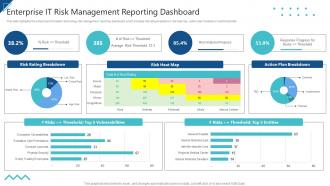 Enterprise Risk Management Enterprise IT Risk Management Reporting Dashboard
This slide highlights the enterprise information technology risk management reporting dashboard which includes risk rating breakdown risk heat map, action plan breakdown and thresholds. Present the topic in a bit more detail with this Enterprise Risk Management Enterprise IT Risk Management Reporting Dashboard. Use it as a tool for discussion and navigation on Risk Rating Breakdown, Risk Heat Map, Action Plan Breakdown. This template is free to edit as deemed fit for your organization. Therefore download it now.
-
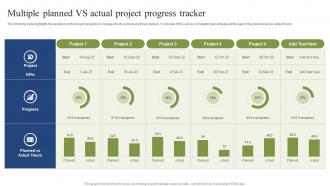 Multiple Planned VS Actual Project Progress Tracker
The following slide highlights the variations in the project progress to manage the its and ensure timely delivery. It includes KPIs such as completion percentage and the gap in the planned versus actual hours. Presenting our well structured Multiple Planned VS Actual Project Progress Tracker. The topics discussed in this slide are Project, KPIs Progress, Planned Vs Actual Hours. This is an instantly available PowerPoint presentation that can be edited conveniently. Download it right away and captivate your audience.
-
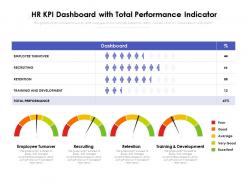 Hr kpi dashboard with total performance indicator
Presenting HR KPI Dashboard With Total Performance Indicator PPT template. The slide is completely modifiable with so many features available. The slide can be viewed on different screen sizes. The presentation can be saved in various formats like PDF, JPG, and PNG. Add relevant text, graphics, and icons to your presentation.
-
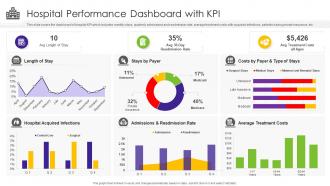 Hospital Performance Dashboard With KPI
This slide covers the dashboard of hospital KPI which includes monthly stays, quarterly admissions and readmission rate, average treatment costs with acquired infections, patients having private insurance, etc. Presenting our well structured Hospital Performance Dashboard With KPI. The topics discussed in this slide are Avg Length Of Stay, Avg Treatment Costs All Ages, Stays By Payer, Average Treatment Costs, Admissions And Readmission Rate, Hospital Acquired Infections, Length Of Stay. This is an instantly available PowerPoint presentation that can be edited conveniently. Download it right away and captivate your audience.
-
 93177794 style essentials 2 financials 7 piece powerpoint presentation diagram infographic slide
This PowerPoint presentation can be used to display your business and finance related presentations. The elements used in this PPT slide can easily be edited by means of the change in color or editing the text or size. You can change the icons to your liking. PPT slides are compatible with Google slides and can be edited in any PowerPoint software.
-
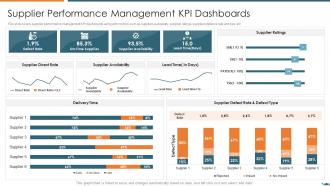 Supplier performance management kpi vendor relationship management strategies
This slide covers supplier performance management KPI dashboards along with metrics such as suppliers availability, supplier ratings, suppliers defence rate and type etc. Deliver an outstanding presentation on the topic using this Supplier Performance Management KPI Vendor Relationship Management Strategies. Dispense information and present a thorough explanation of Supplier Direct Rate, Supplier Availability, Lead Time using the slides given. This template can be altered and personalized to fit your needs. It is also available for immediate download. So grab it now
-
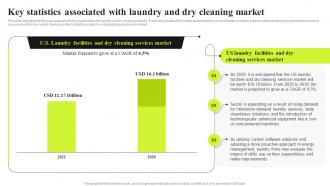 Commercial Laundry Business Plan Key Statistics Associated With Laundry And Dry Cleaning Market BP SS
This slide highlights the thorough assessment of a market within the laundry and dry-cleaning industry. It will help get valuable insights and project the success that the company expects while introducing its brand and services to consumers within the market. It will also reflect statistics related to on-demand laundry service market. Deliver an outstanding presentation on the topic using this Commercial Laundry Business Plan Key Statistics Associated With Laundry And Dry Cleaning Market BP SS. Dispense information and present a thorough explanation of Laundry And Dry Cleaning Industry, Brand And Services To Consumers, Demand Laundry Service Market, Key Statistics Associated using the slides given. This template can be altered and personalized to fit your needs. It is also available for immediate download. So grab it now.
-
 Sample financial analysis report manufacturing powerpoint presentation slides
Shapes can be restructured, and relevant text can be added in presentation visual. Presentation slide can be put to use for handling financial details such as sales, management and financial analysis. Unique layouts which can be adjusted with respect to font, graphics and other related layouts. Effective color combination ensures professional look to PPT layout. Conversion into PDF or JPG formats is not at all difficult. PPT slides offer font, graphic and text size which can be read by all in a room or hall. Art graphic size and orientation can be managed.
-
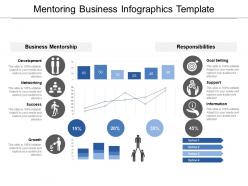 56424059 style essentials 2 financials 4 piece powerpoint presentation diagram infographic slide
Presenting this set of slides with name - Mentoring Business Infographics Template. This is a four stage process. The stages in this process are Mentoring, Advise, Trainee.
-
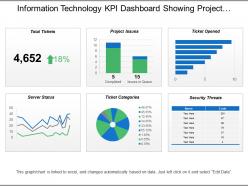 1316560 style essentials 2 financials 6 piece powerpoint presentation diagram infographic slide
Presenting this set of slides with name - Information Technology Kpi Dashboard Showing Project Issues Server Status. This is a six stage process. The stages in this process are Information Technology, It, Iot.
-
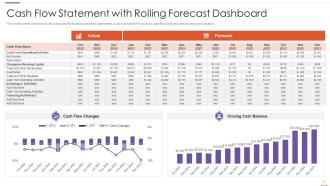 Cash Flow Statement With Rolling Forecast Dashboard
This slide covers dashboard with actual and forecasted cash flow statements. It also include KPIs such as cash flow changes and closing cash balance. Introducing our Cash Flow Statement With Rolling Forecast Dashboard set of slides. The topics discussed in these slides are Cash Flow Changes, Closing Cash Balance. This is an immediately available PowerPoint presentation that can be conveniently customized. Download it and convince your audience.
-
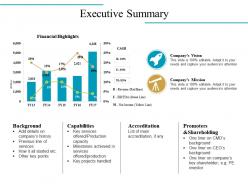 48295751 style essentials 2 financials 2 piece powerpoint presentation diagram infographic slide
Presenting this set of slides with name - Executive Summary Powerpoint Slides Design. This is a two stage process. The stages in this process are Background, Capabilities, Accreditation, Promoters And Shareholding, Financial Highlights.
-
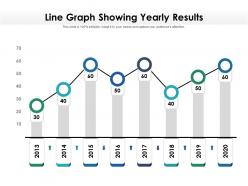 Line graph showing yearly results
Presenting this set of slides with name Line Graph Showing Yearly Results. The topics discussed in these slides is Line Graph Showing Yearly Results. This is a completely editable PowerPoint presentation and is available for immediate download. Download now and impress your audience.
-
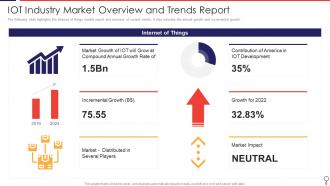 Iot Industry Market Overview And Trends Report
The following slide highlights the internet of things market report and overview of current trends. It also includes the annual growth and incremental growth. Presenting our well-structured Iot Industry Market Overview And Trends Report. The topics discussed in this slide are Incremental, Growth, Development, Overview. This is an instantly available PowerPoint presentation that can be edited conveniently. Download it right away and captivate your audience.
-
 18697346 style concepts 1 growth 2 piece powerpoint presentation diagram infographic slide
Presenting, data bar graph for business application PowerPoint template slide. Modifiable PPT Slide, edit the bar colors shown and personalize the text with your data. Convertible into various format options like JPEG, JPG or PDF. Display option available such as standard and widescreen view, available in 4:3 standard and full screen version 16:9. Liberty to customize it with company name and logo. Helpful for business professionals, students, teachers, business analysts and strategists. Compatible with google slides as well.
-
 Capital expenditure powerpoint presentation slides
Presenting Capital Expenditure PowerPoint Presentation Slides. This presentation contains 41 visually appealing PPT slides. These PowerPoint templates are 100 % editable. Users can edit the fonts, colors, and slide background as per their need. Download the presentation templates in both widescreen and standard screen. The presentation is compatible with Google Slides. It can be easily converted into JPG or PDF format.
-
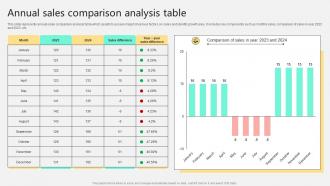 Annual Sales Comparison Analysis Table
This slide represents annual sales comparison analysis table which assists to assess impact of various factors on sales and identify growth area. It includes key components such as monthly sales, comparison of sales in year 2022 and 2023, etc. Introducing our Annual Sales Comparison Analysis Table set of slides. The topics discussed in these slides are Comparison Of Sales, Sales Difference. This is an immediately available PowerPoint presentation that can be conveniently customized. Download it and convince your audience.
-
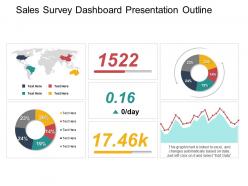 77288941 style essentials 2 financials 3 piece powerpoint presentation diagram infographic slide
Presenting sales survey dashboard snapshot presentation outline. The slideshow is fully flexible. You can incorporate them into any PowerPoint without worrying about compatibilities. It is fully compatible with Google Slides and Microsoft PowerPoint. Except this, you will get full versatility. PPT can be downloaded into JPEG and PDF formats. You can modify and personalize the design the way you want. All the design elements are 100% editable.
-
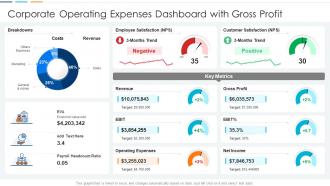 Corporate Operating Expenses Dashboard With Gross Profit
This graph or chart is linked to excel, and changes automatically based on data. Just left click on it and select edit data. Introducing our Corporate Operating Expenses Dashboard With Gross Profit set of slides. The topics discussed in these slides are Breakdowns, Employee Satisfaction Nps, Customer Satisfaction Nps, Revenue, Gross Profit. This is an immediately available PowerPoint presentation that can be conveniently customized. Download it and convince your audience.
-
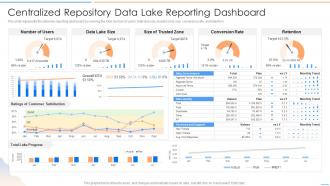 Data Lake Future Of Analytics Centralized Repository Data Lake Reporting Dashboard Ppt Tips
This slide represents the data lake reporting dashboard by covering the total number of users, total lake size, trusted zone size, conversion rate, and retention. Present the topic in a bit more detail with this Data Lake Future Of Analytics Centralized Repository Data Lake Reporting Dashboard Ppt Tips. Use it as a tool for discussion and navigation on Centralized Repository, Reporting Dashboard. This template is free to edit as deemed fit for your organization. Therefore download it now.


