Financial Reviews and Accounting PPT Slides
-
 33572242 style essentials 2 financials 5 piece powerpoint presentation diagram infographic slide
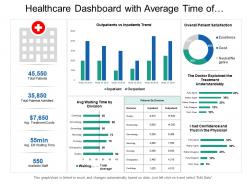
Presenting this set of slides with name - Healthcare Dashboard With Average Time Of Division And Patient Satisfaction. This is a five stage process. The stages in this process are Healthcare, Health Improvement, Medical Care.
-
 13858653 style essentials 2 financials 4 piece powerpoint presentation diagram infographic slide
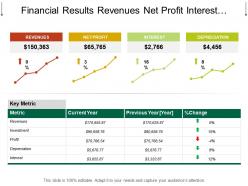
Presenting, Financial Results Revenues Net Profit Interest Depreciation PowerPoint template. This presentation slide is beneficial for managers, employees, accountant, CA, finance manager, and organizations looking to project their business process through a flow chart. This presentation template is hundred percent editable, which means you can change the text, color, and view of the given template according to your desire. You can choose icons among the thousands of options accessible. This presentation slide is compatible with Google Slides. Ease of download and convert into jpeg or pdf format.
-
 76993999 style essentials 2 financials 1 piece powerpoint presentation diagram infographic slide
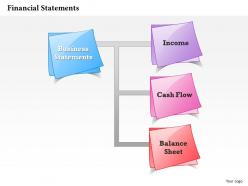
Slide runs smoothly on all related software. PPT slides can be deployed in a simple and direct manner. More customization options by affixing your company’s logo, trademark. No space constraints while adding elements. PPT graphics don’t pixelate when projected on widescreen. Changeable layout including font, text, color and design. Append title and sub-title at will. Compatible with Google slides for better shared information distribution.
-
 49294833 style concepts 1 growth 5 piece powerpoint presentation diagram template slide
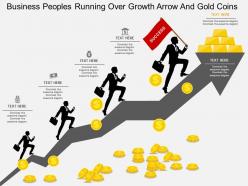
Presenting wa business peoples running over growth arrow and gold coins flat powerpoint design. This Power Point template diagram has been crafted with graphic of business peoples, growth arrow and gold coins. This PPT diagram contains the concept of business growth and team management. Use this PPT diagram for business and marketing related presentations.
-
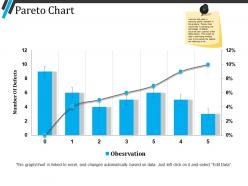 57399992 style essentials 2 financials 7 piece powerpoint presentation diagram infographic slide
Presenting pareto chart powerpoint templates. This is a pareto chart powerpoint templates. This is a seven stage process. The stages in this process are pareto chart, business, growth, finance, analysis.
-
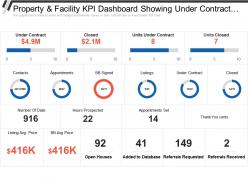 37590182 style essentials 2 financials 3 piece powerpoint presentation diagram infographic slide
Get a chance to explore, property and facility KPI dashboard showing under contract closed and monthly team pacing KPI dashboard PowerPoint Presentation Slide. This Presentation has been designed by professionals and is fully editable. You can reshape the font size, font type, colors, and even the background. This Template is cordial with Google Slide and can be saved in JPG or PDF format without any resistance created. Fast download at the click of the button.
-
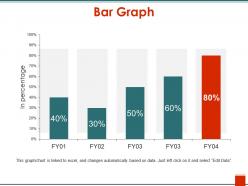 33112722 style concepts 1 growth 5 piece powerpoint presentation diagram infographic slide
Presenting the Bar Graph PowerPoint Ideas template. The template is fully editable in MS PowerPoint and other similar software. Modify the font type, size, diagram color, background color, etc. according to your needs. The slide is also compatible with Google Slides and can be saved in numerous images or document formats such as JPG or PDF. High-quality graphics ensure that pixelation does not arise.
-
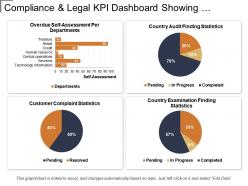 36940311 style essentials 2 financials 4 piece powerpoint presentation diagram infographic slide
Presenting this set of slides with name - Compliance And Legal Kpi Dashboard Showing Self-Assessment Per Department. This is a four stage process. The stages in this process are Compliance And Legal, Legal Governance, Risk Management.
-
 15605836 style essentials 2 financials 4 piece powerpoint presentation diagram infographic slide
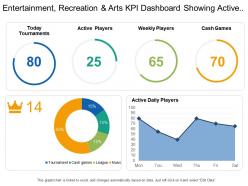
Presenting this set of slides with name - Entertainment Recreation And Arts Kpi Dashboard Showing Active Daily Players And Today Tournaments. This is a four stage process. The stages in this process are Entertainment, Recreation And Arts, Attractions, Culture, Entertainment.
-
 6154852 style essentials 2 financials 5 piece powerpoint presentation diagram infographic slide
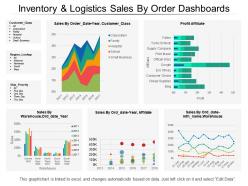
Presenting this set of slides with name - Inventory And Logistics Sales By Order Dashboards. This is a five stage process. The stages in this process are Inventory And Logistics, Inventory Management, Warehousing And Inventory Management.
-
 17348758 style division donut 5 piece powerpoint presentation diagram infographic slide
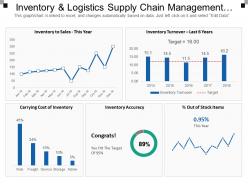
Presenting inventory and logistics supply chain management dashboards PowerPoint template. Access to edit the content, style, size and orientation of the PPT slides. Extremely spacious to cover all the aspects of the company profile. High resolution images do not pixelate when projected on wide screen. Personalize the PPT with your company name and logo. Modify the presentation elements as per the need of an hour. Compatible with numerous software and format options. Used by entrepreneurs, marketers, managerial department, stakeholders and students. Self-explanatory and intellectual slide charts.
-
 14346313 style essentials 2 financials 3 piece powerpoint presentation diagram infographic slide
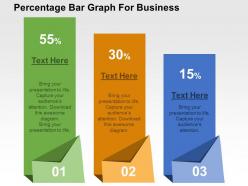
We are proud to present our percentage bar graph for business flat powerpoint design. This power point template diagram has been crafted with graphic of percentage and bar graph. This PPT diagram contains the concept of financial analysis. Use this PPT diagram for business and finance related presentations.
-
 80750097 style essentials 2 financials 4 piece powerpoint presentation diagram infographic slide
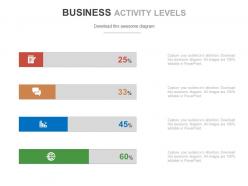
Presenting four tags for business activity levels powerpoint slides. This Power Point template slide has been crafted with graphic of four tags. This PPT slide contains the concept of business activity levels representation. Use this PPT slide for business and finance related presentations.
-
 11243198 style division donut 7 piece powerpoint presentation diagram infographic slide
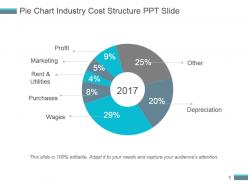
Presenting pie chart industry cost structure ppt slide. This is a pie chart industry cost structure ppt slide. This is a seven stage process. The stages in this process are profit, marketing, rent and utilities, purchases, wages, other, depreciation.
-
 16829057 style essentials 2 financials 3 piece powerpoint presentation diagram infographic slide
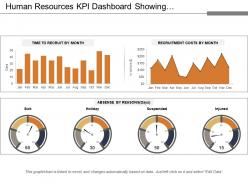
Presenting this set of slides with name - Human Resources Kpi Dashboard Showing Recruitment Costs And Absence By Reason. This is a three stage process. The stages in this process are Human Resource, Hrm, Human Capital.
-
 58305884 style essentials 2 financials 4 piece powerpoint presentation diagram infographic slide
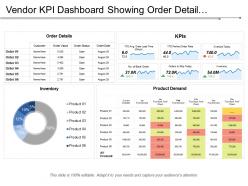
Presenting this set of slides with name - Vendor Kpi Dashboard Showing Order Detail Inventory And Orders To Ship Today. This is a four stage process. The stages in this process are Vendor, Supplier, Retailer.
-
 85704424 style essentials 2 financials 3 piece powerpoint presentation diagram infographic slide
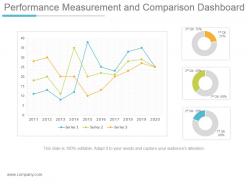
Presenting performance measurement and comparison dashboard snapshot ppt design. This is a performance measurement and comparison dashboard ppt design. This is a three stage process. The stages in this process are series, qtr.
-
 45135755 style essentials 2 dashboard 3 piece powerpoint presentation diagram infographic slide
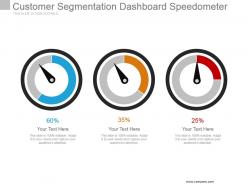
Presenting customer segmentation dashboard speedometer powerpoint slide. This is a customer segmentation dashboard speedometer powerpoint slide. This is a three stage process. The stages in this process are dashboard, measurement, business, strategy, success.
-
 43707776 style division pie 4 piece powerpoint presentation diagram template slide
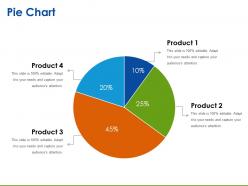
Presenting pie chart ppt sample download. This is a pie chart ppt sample download. This is a four stage process. The stages in this process are pie chart, finance, analysis, marketing, strategy, business.
-
 93401630 style essentials 2 financials 9 piece powerpoint presentation diagram infographic slide
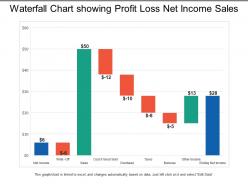
Presenting this set of slides with name - Waterfall Chart Showing Profit Loss Net Income Sales. This is a nine stage process. The stages in this process are Agile, Waterfall, Scrum, Sprint.
-
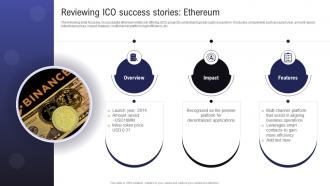 Comprehensive Guide To Raise Reviewing ICO Success Stories Ethereum BCT SS
The following slide focusses on successful ethereum initial coin offering ICO project to understand global crypto ecosystem. It includes components such as launch year, amount raised, initial token prices, impact, features, multichannel platform, high efficiency, etc. Increase audience engagement and knowledge by dispensing information using Comprehensive Guide To Raise Reviewing ICO Success Stories Ethereum BCT SS This template helps you present information on Three stages. You can also present information on Decentralized Applications, Business Operations Reviewing using this PPT design. This layout is completely editable so personaize it now to meet your audiences expectations.
-
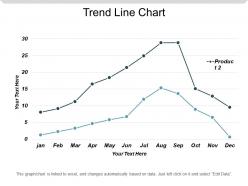 17999157 style essentials 2 financials 2 piece powerpoint presentation diagram infographic slide
Presenting trend line chart good ppt example. This is a trend line chart good ppt example. This is a two stage process. The stages in this process are trend line, line graph, scatter chart.
-
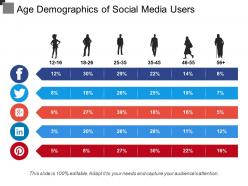 27440375 style essentials 2 financials 5 piece powerpoint presentation diagram infographic slide
Presenting this set of slides with name - Age Demographics Of Social Media Users. This is a five stage process. The stages in this process are Population, Demographics, People Growth.
-
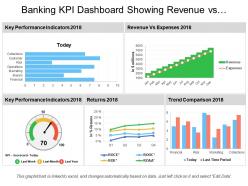 13400230 style essentials 2 financials 5 piece powerpoint presentation diagram infographic slide
Presenting this set of slides with name - Banking Kpi Dashboard Showing Revenue Vs Expenses And Returns. This is a five stage process. The stages in this process are Banking, Finance, Money.
-
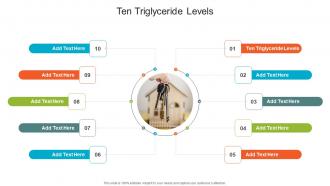 Ten Triglyceride Levels In Powerpoint And Google Slides Cpb
Presenting Ten Triglyceride Levels In Powerpoint And Google Slides Cpb slide which is completely adaptable. The graphics in this PowerPoint slide showcase one stages that will help you succinctly convey the information. In addition, you can alternate the color, font size, font type, and shapes of this PPT layout according to your content. This PPT presentation can be accessed with Google Slides and is available in both standard screen and widescreen aspect ratios. It is also a useful set to elucidate topics like Ten Triglyceride Levels. This well structured design can be downloaded in different formats like PDF, JPG, and PNG. So, without any delay, click on the download button now.
-
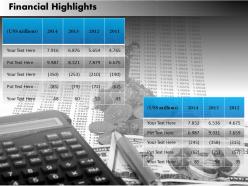 24344714 style essentials 2 financials 1 piece powerpoint presentation diagram infographic slide
Picture quality does not deter when opened on a big screen display. Trouble-free incorporation of customized content or graphics. Provided guidance to modify the graphical content. Save the presentation visual in JPG or PDF format. Compatible with the online as well as offline PowerPoint softwares. Vivacious background of the slide icons. Effectively useful for the Marketing professionals, interpreters and the strategy designers.
-
 94388340 style concepts 1 growth 4 piece powerpoint presentation diagram template slide
We are proud to present our growth chart with team management result analysis target achievement flat powerpoint design. Graphic of growth chart has been used to craft this power point template diagram. This PPT diagram contains the concept of result analysis and target achievement. Use this PPT diagram for global business and marketing related presentations.
-
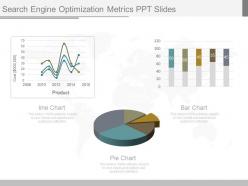 25051960 style division pie 3 piece powerpoint presentation diagram infographic slide
Presenting new search engine optimization metrics ppt slides. This is a search engine optimization metrics ppt slides. This is a three stage process. The stages in this process are cost, prodect, line chart, pie chart, bar chart.
-
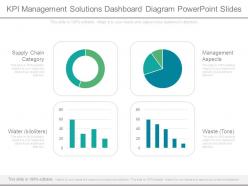 56886550 style essentials 2 financials 4 piece powerpoint presentation diagram infographic slide
Presenting kpi management solutions dashboard diagram powerpoint slides. This is a kpi management solutions dashboard diagram powerpoint slides. This is a four stage process. The stages in this process are supply chain category, water, management aspects, waste.
-
 74457551 style essentials 2 financials 7 piece powerpoint presentation diagram infographic slide
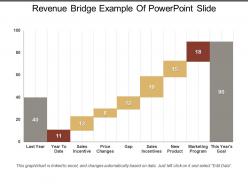
Presenting this set of slides with name - Revenue Bridge Example Of Powerpoint Slide. This is a seven stage process. The stages in this process are Revenue Bridge, Income Bridge, Earnings Bridge.
-
 Debt Recovery Process Step 4 Issue Court Proceeding For Recovering Debt
This slide shows five steps to file issue court proceedings for recovering amount from debtors. It include steps such as file legal complaint, serve legal documents and respond to claim, etc. Increase audience engagement and knowledge by dispensing information using Debt Recovery Process Step 4 Issue Court Proceeding For Recovering Debt. This template helps you present information on five stages. You can also present information on Serve Legal Documents, Court Hearing, Enforcement, Issue Court Proceeding using this PPT design. This layout is completely editable so personaize it now to meet your audiences expectations.
-
 31597602 style essentials 2 financials 1 piece powerpoint presentation diagram infographic slide
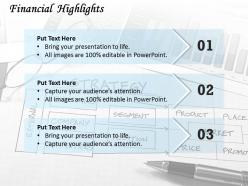
User-friendly PowerPoint backgrounds. Popular and highly beneficial PowerPoint slides. Makes the business objectives clear in the mind of the audience. Editable visuals, colors and text. Possess the ability to easily grab the attention of the audience without putting much efforts. Creates a strong connection between the audience and the presentation. Valuable for industry professionals, technologists, managers, executives, researchers, sales people, etc.
-
 66942532 style essentials 2 financials 8 piece powerpoint presentation diagram infographic slide
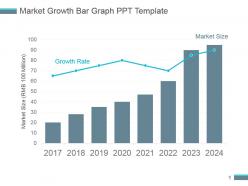
Presenting market growth bar graph ppt template. This is a market growth bar graph ppt template. This is a eight stage process. The stages in this process are market size, growth rate.
-
 28319574 style division donut 4 piece powerpoint presentation diagram infographic slide
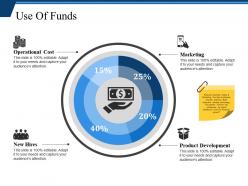
Presenting this set of slides with name - Use Of Funds Powerpoint Slide Templates Download. This is a four stage process. The stages in this process are Operational Cost, Marketing, New Hires, Product Development.
-
 61116850 style division donut 4 piece powerpoint presentation diagram infographic slide
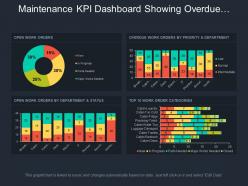
Presenting this set of slides with name - Maintenance Kpi Dashboard Showing Overdue Work Orders By Priority And Department. This is a four stage process. The stages in this process are Maintenance, Preservation, Conservation.
-
 75231696 style essentials 2 financials 3 piece powerpoint presentation diagram infographic slide
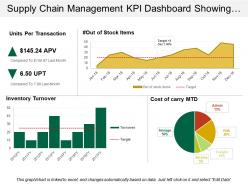
Presenting predesigned Supply Chain Management KPI Dashboard Showing Warehouse Operating Costs PPT slide. Download of the template design is simple. You can modify the layout font type, font size, colors and the background as per needs. Template slide is fully flexible with Google Slides and other online software’s. You can alter the design using the instructional slides provided with the template. You can remove the watermark with your brand name, trademark, signature or logo. You can save the template into PNG or JPEG formats. Supreme quality layouts are used to create this template which is editable in PowerPoint. Sample content can be replaced with your presentation content.
-
 42034575 style essentials 2 financials 3 piece powerpoint presentation diagram infographic slide
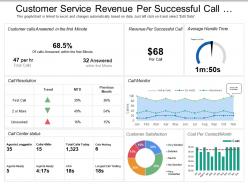
Presenting this set of slides with name - Customer Service Revenue Per Successful Call Dashboard. This is a three stage process. The stages in this process are Customer Base, Recurring Customers, Customer Services.
-
 5294923 style essentials 2 financials 4 piece powerpoint presentation diagram infographic slide
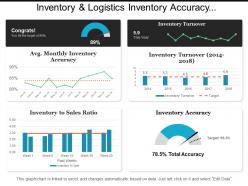
Presenting this set of slides with name - Inventory And Logistics Inventory Accuracy Dashboards. This is a four stage process. The stages in this process are Inventory And Logistics, Inventory Management, Warehousing And Inventory Management.
-
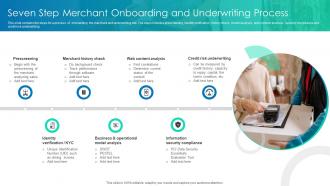 Seven Step Merchant Onboarding And Underwriting Process
This slide contains the steps for a process of onboarding the merchant and underwriting risk. The steps includes prescreening, identity verification, history check, model analysis, web content analysis, security compliance and credit risk underwriting. Introducing our premium set of slides with Seven Step Merchant Onboarding And Underwriting Process. Ellicudate the seven stages and present information using this PPT slide. This is a completely adaptable PowerPoint template design that can be used to interpret topics like Prescreening, Merchant History Check, Web Content Analysis. So download instantly and tailor it with your information.
-
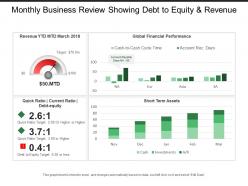 14204709 style essentials 2 financials 2 piece powerpoint presentation diagram infographic slide
Presenting this set of slides with name - Monthly Business Review Showing Debt To Equity And Revenue. This is a two stage process. The stages in this process are Monthly Business Review, Monthly Business Report, Monthly Company Review.
-
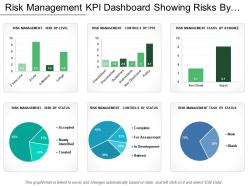 99290375 style essentials 2 financials 6 piece powerpoint presentation diagram infographic slide
Presenting this set of slides with name - Risk Management Kpi Dashboard Showing Risks By Level Assignee And Status. This is a six stage process. The stages in this process are Risk Management, Risk Assessment, Project Risk.
-
 27059106 style division pie 3 piece powerpoint presentation diagram infographic slide
Presenting transportation KPI dashboard snapshot showing fleet delivery status loading time and weight PPT slide. Simple data input with linked Excel chart, just right click to input values. This PowerPoint theme is fully supported by Google slides. Picture quality of these slides does not change even when project on large screen. Fast downloading speed and formats can be easily changed to JPEG and PDF applications. This template is suitable for marketing, sales persons, business managers and entrepreneurs.
-
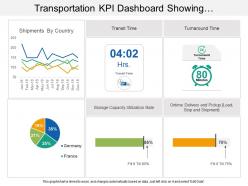 4939293 style division pie 3 piece powerpoint presentation diagram infographic slide
Presenting transportation KPI Dashboard showing shipments by country and transit time PPT slide. This deck offers you plenty of space to put in titles and subtitles. This template is Excel linked just right click to input your information. High resolution based layout, does not change the image even after resizing. This presentation icon is fully compatible with Google slides. Quick downloading speed and simple editing options in color text and fonts.PPT icons can easily be changed into JPEG and PDF applications
-
 79618981 style essentials 2 financials 2 piece powerpoint presentation diagram infographic slide
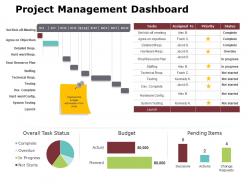
Presenting this set of slides with name - Project Management Dashboard Ppt Powerpoint Presentation Gallery Display. This is a two stage process. The stages in this process are Business, Management, Strategy, Analysis, Marketing.
-
 Business Financial Growth Icon
Introducing our premium set of slides with Business Financial Growth Icon. Ellicudate the two stages and present information using this PPT slide. This is a completely adaptable PowerPoint template design that can be used to interpret topics like Business Financial, Growth Icon. So download instantly and tailor it with your information.
-
 3136062 style layered horizontal 4 piece powerpoint presentation diagram infographic slide
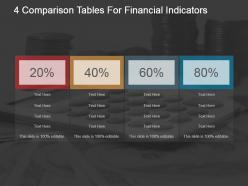
Presenting 4 Comparison Tables For Financial Indicators PowerPoint Graphics slide. The slide is fully customizable in PowerPoint. The colors of background and table can be changed as per your requirement. The presentation content can replace the dummy text. The font style, size and colors can be altered. Company name and logo can be inserted with ease. The template is suitable for use in Google Slides too. It is available in 4:3 and 16:9 aspect ratios. High resolution ensures good quality. It can be downloaded easily.
-
 Impact Of Potential Customer Analysis On Business Growth
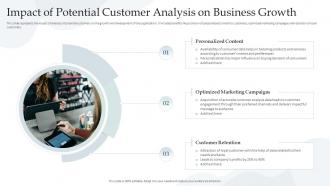
This slide represents the impact of analysis of potential customers on the growth and development of the organization. It includes benefits like provision of personalized content to customers, optimized marketing campaigns and retention of loyal customers. Presenting our set of slides with Impact Of Potential Customer Analysis On Business Growth. This exhibits information on three stages of the process. This is an easy to edit and innovatively designed PowerPoint template. So download immediately and highlight information on Personalized Content, Optimized Marketing Campaigns, Customer Retention.
-
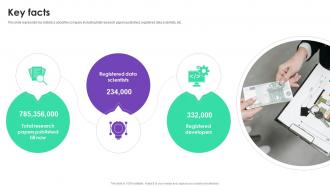 Key Facts Bytez Investor Funding Elevator Pitch Deck
This slide represents key statistics about the company including total research papers published, registered data scientists, etc. Increase audience engagement and knowledge by dispensing information using Key Facts Bytez Investor Funding Elevator Pitch Deck This template helps you present information on Three stages. You can also present information on Total Research, Registered Data Scientists, Registered Developers using this PPT design. This layout is completely editable so personaize it now to meet your audiences expectations.
-
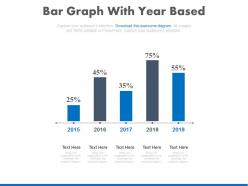 97902406 style essentials 2 financials 5 piece powerpoint presentation diagram infographic slide
Presenting bar graph with year based timeline percentage chart powerpoint slides. This Power Point template diagram slide has been crafted with bar graph, percentage chart and timeline icons. This PPT diagram slide contains the concept of financial data analysis. Use this PPT slide for finance and business related presentations.
-
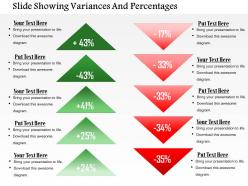 58872920 style layered vertical 5 piece powerpoint presentation diagram infographic slide
Impressive use of colors to create an eye catchy visual. High resolution pictures. No flaw in picture output when projected on wide screen. Compatibility with numerous format options. Harmonious with large set of software. Thoroughly editable slide design layout. Ease of incorporating changes. Personalize the content with company specific name, logo and trademark. Used by financiers, sales professionals, students and teachers.
-
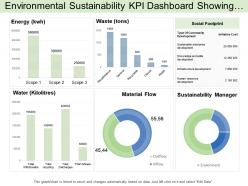 20381011 style division donut 6 piece powerpoint presentation diagram infographic slide
Presenting this set of slides with name - Environmental Sustainability Kpi Dashboard Showing Social Footprint And Supply Chain Category. This is a six stage process. The stages in this process are Environment Sustainability, Environment Continual, Environment Feasibility.
-
 72352169 style essentials 2 financials 6 piece powerpoint presentation diagram infographic slide
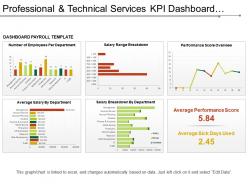
Presenting this set of slides with name - Professional And Technical Services Kpi Dashboard Showing Payroll Services. This is a six stage process. The stages in this process are Professional And Technical Services, Services Management, Technical Management.
-
 Cost revenue icon with hand
Presenting Cost Revenue Icon With Hand PowerPoint design. Now download it here and start editing it right away. You can edit it with your teammates using Google Slides. This PPT presentation is easy to convert to PNG, JPEG, and PDF formats without having its graphics depleted in the process. Upon downloading here, you can avail its standard screen and widescreen sizes. So hurry up and start downloading from below.
-
 75061949 style essentials 2 financials 4 piece powerpoint presentation diagram infographic slide
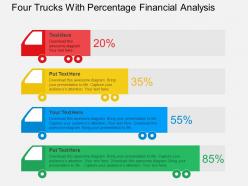
Slide runs effortlessly on all software. Download slides in moments. Add company logo, name or trademark with no trouble. No pixilation when slide is viewed on widescreen. Compatible with google slides. Display titles and subtitles with no space constraints. High resolution PPT slides. Convert to JPG and PDF formats lucidly. Useful for businesses, small and large, startups and project managers.
-
 97591112 style essentials 2 financials 1 piece powerpoint presentation diagram infographic slide
Presenting tree graphic for nature and environment safety powerpoint slides. This Power Point template diagram has been crafted with graphic of tree diagram. This PPT diagram contains the concept of nature and environment safety management. Use this PPT diagram for business and nature related presentations.
-
 3517059 style essentials 2 financials 2 piece powerpoint presentation diagram infographic slide
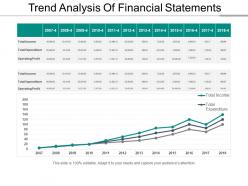
Presenting a PowerPoint slide named Trend Analysis of Financial Statements PowerPoint Layout. This template with high-quality graphics is completely editable and professionally designed. With an option to change the size, style, and color of the font, this slide is ready to use. You can customize the text and color of the diagram as well as the background as per your discretion. The PPT slide is compatible with Google Slides, which makes it easily accessible. You can customize and save the file as JPG or PDF formats. Once the graph is linked to excel, it automatically changes based on the data.
-
 79849249 style essentials 2 financials 5 piece powerpoint presentation diagram infographic slide
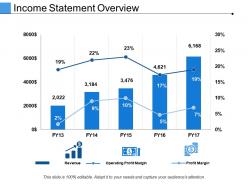
Presenting this set of slides with name - Income Statement Overview Presentation Portfolio. This is a five stage process. The stages in this process are Finance, Marketing, Bar, Planning, Growth.
-
 93503514 style essentials 2 financials 4 piece powerpoint presentation diagram infographic slide
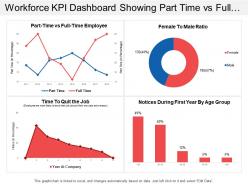
Presenting this set of slides with name - Workforce Kpi Dashboard Showing Part Time Vs Full Time Employee. This is a four stage process. The stages in this process are Staff, Personnel, Workforce.
-
 83307992 style essentials 2 financials 4 piece powerpoint presentation diagram infographic slide
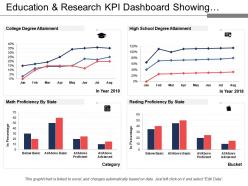
Presenting education and research KPI dashboard showing degree attainment and proficiency PPT slide. The educational degree attainment KPI report presentation slide designed by the professional team of SlideTeam. The education population analysis PPT template is fully editable in PowerPoint. The research status KPI report presentation template is compatible with Google Slide so a user can share this degree attainment metric dashboard slide with others. A user can make changes in the font size, font type, color as well as dimensions of the proficiency KPI dashboard PPT slide as per the requirement. You may edit the value in the education proficiency report slide as the slide gets linked with the Excel sheet.
-
 Techniques For Reducing Cost And Increasing Efficiency Icon
Introducing our premium set of slides with Techniques For Reducing Cost And Increasing Efficiency Icon. Ellicudate the three stages and present information using this PPT slide. This is a completely adaptable PowerPoint template design that can be used to interpret topics like Techniques For Reducing Cost And Increasing Efficiency Icon. So download instantly and tailor it with your information


