Easy-to-Edit 5-step All Essential Financial Presentation Diagram
-
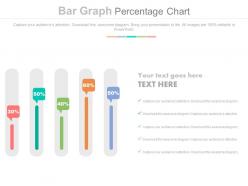 20536315 style essentials 2 financials 5 piece powerpoint presentation diagram infographic slide
Aesthetically designed and professionally equipped slides. High resolution. Impressive picture quality which do not pixelate when projected on wide screen. Compatible with multiple set of software available both online and offline. Compatible with team of format like JPEG, JPG and PDF. Modify the contents at your ease. 100 percent editable slide design. Execute the changes with the provided on slide assistance. Personalize the contents with your company name and logo.
-
 54631728 style essentials 2 financials 5 piece powerpoint presentation diagram infographic slide
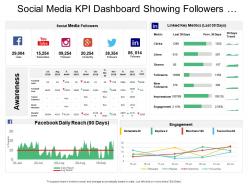
SlideTeam presents the Social media KPI dashboard showing followers Facebook daily reach This slideshow is modifiable according to your needs as you can make all the required changes to it whenever you feel like. You can edit the font size and font style. These slides are fully compatible with Google Slides. You can view the presentation on both 16:9 widescreen side as well as the 4:3 standard screen size. You can save them in either JPG or PDF format.
-
 5010124 style essentials 2 financials 5 piece powerpoint presentation diagram infographic slide
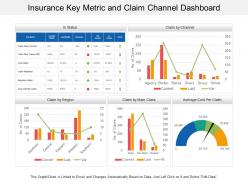
• Easy to customize. • Easy to replace any words, picture or number provided in the template with your own content and use it for presentation. • Freedom to incorporate your own company’s name and logo in the presentation for personalization. • The PPT visuals used are of high resolution. • No issue of image pixilation if projected on wide screen. • Compatibility with numerous format and software options. • Widely used by marketers, businessmen, insurance managers and educators.
-
 23859997 style essentials 2 financials 5 piece powerpoint presentation diagram template slide
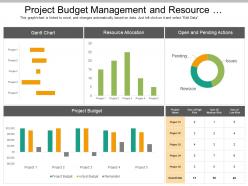
Presenting this set of slides with name - Project Budget Management And Resource Allocation Dashboard. Amazing picture quality as pixels don’t break even on large display. Preference gives personal touch to the Presentation slide with business symbol, name and image. Simple to adjust PowerPoint design as changes accepted with color, text and shape. Matching PPT templates are downloadable with different nodes and stages. Presentation graphic can be displayed in standard and widescreen view. Easy to download and change into other format such as JPEG and PDF
-
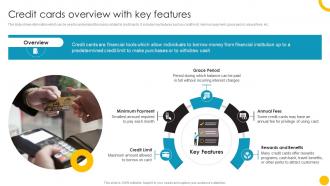 Credit Cards Overview Guide To Use And Manage Credit Cards Effectively Fin SS
This slide shows information which can be used to understand the basics related to credit cards. It includes key features such as credit limit, minimum payment, grace period, annual fees, etc. Increase audience engagement and knowledge by dispensing information using Credit Cards Overview Guide To Use And Manage Credit Cards Effectively Fin SS. This template helps you present information on five stages. You can also present information on Overview, Grace Period, Rewards And Benefits using this PPT design. This layout is completely editable so personaize it now to meet your audiences expectations.
-
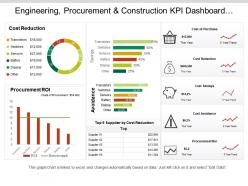 19159398 style essentials 2 financials 5 piece powerpoint presentation diagram template slide
You can use this PPT slideshow very easily as it is fully customizable. You can effortlessly insert or remove any diagrammatic representation from the given template. The font size, font color and font style can be easily edited. This graph PPT is linked to excel and changes automatically based on the data you enter. You can save the deck in either PDF or JPG format. To make any changes in the PPT slideshow, simply follow the instructions given in the sample slides. The size, color and orientation of all shapes are 100% customizable, so don’t waste any further time and download this presentation.
-
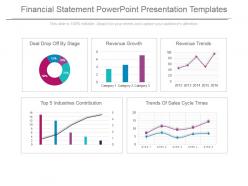 98827662 style essentials 2 financials 5 piece powerpoint presentation diagram infographic slide
Stunning financial statement PowerPoint design. Fit to be used with Google slides. Replace the images, text and the content in the slide design. Change the size, style and orientation of the slides. Use your company’s name or brand name to make it your own presentation template. Beneficial for managers, professors, marketers, etc. Possess great quality for better understanding and error-free performance. Flexible option for conversion in PDF or JPG formats. Available in Widescreen format also. Useful for making business plan and strategies.
-
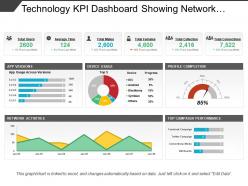 35806715 style essentials 2 financials 5 piece powerpoint presentation diagram infographic slide
Introducing Technology KPI dashboard showing network activities PPT design. Quick download and simple to convert into JPEG and PDF document. High quality presentation slide comes with editing options as color, text and font can be edited at any stage. Preference to display PowerPoint template in standard and widescreen display view. Presentation graphic is accessible with different nodes and stages. Easy to present with large audience. Amend the design with corporate name and icon.
-
 16374708 style essentials 2 financials 5 piece powerpoint presentation diagram infographic slide
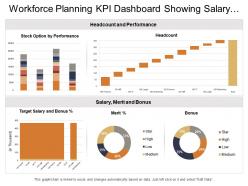
Presenting this set of slides with name - Workforce Planning Kpi Dashboard Showing Salary Merit Bonus Headcount And Performance. This is a five stage process. The stages in this process are Staff, Personnel, Workforce.
-
 52250883 style essentials 2 financials 5 piece powerpoint presentation diagram infographic slide
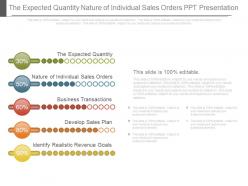
Simple and swift to download without unnecessary steps. Fully modifiable color and contrasts of presentation graphics. Change orientation, size and outlines of PPT images to your liking. Undiminished high resolution graphics post editing. Insert company name, logo, brand name, tagline etc. to personalize. Incorporate this slide anywhere in your own presentation.The stages in this process are finance, business, management.
-
 55701807 style essentials 2 financials 5 piece powerpoint presentation diagram infographic slide
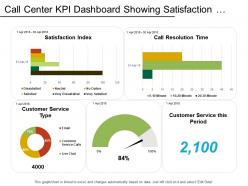
Presenting this set of slides with name - Call Center Kpi Dashboard Showing Satisfaction Index Customer Retention. This is a five stage process. The stages in this process are Call Center Agent, Customer Care, Client Support.
-
 52724883 style concepts 1 growth 5 piece powerpoint presentation diagram infographic slide
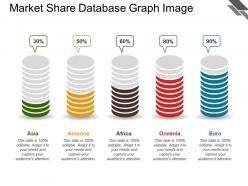
Presenting market share database graph image. This is a market share database graph image. This is a five stage process. The stages in this process are market share, usage share, market structure.
-
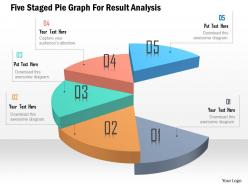 23707509 style division pie 5 piece powerpoint presentation diagram infographic slide
We are proud to present our five staged pie graph for resul analysis powerpoint template. Five staged pie graph has been used to craft this power point template diagram. This PPT diagram contains the concept of result analysis. Use this PPT diagram for business and marketing related presentations.
-
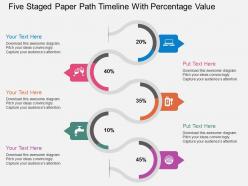 99482529 style circular zig-zag 5 piece powerpoint presentation diagram infographic slide
PowerPoint diagrams have been made by professional experts. All the PPT slides are fully accustomed to Google slides. Can be used by marketing and business professionals. Presented in form of a road map. Use of percentages. Facility of editing the text and color made it viable for the users. Can be used to define strategy implications. Attractive and colorful icons have been used.
-
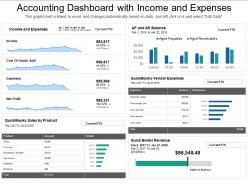 55369360 style essentials 2 financials 5 piece powerpoint presentation diagram infographic slide
Presenting accounting dashboard with income and expenses PPT slideshow. Loaded with incomparable benefits. Readymade PPT graphic helps in saving time and effort. Can be personalized by adding company trademark, logo, brand and symbols. Can be utilized for displaying both simple and complex information. Include or exclude slide content as per your individual need. Colors and text can be easily changed as the PPT slide is completely editable. Useful for every business leader and professional, project management team, business analysts, etc.
-
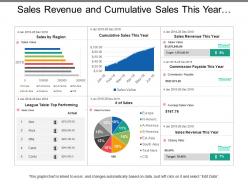 46575029 style essentials 2 financials 5 piece powerpoint presentation diagram infographic slide
Presenting this set of slides with name - Sales Revenue And Cumulative Sales This Year Dashboards. Completely amendable presentation design as some elements are editable. Ease to personalize the slide with your company name, logo and even tag line. PowerPoint slide can be downloaded easily and transform into JPG and PDF format. More designs can be accessed with different nodes and stages. PPT diagram can be projected in standard and widescreen view. Great use of colors and innovatively designed. PPT template is compatible with Google slides.
-
 51828701 style essentials 2 financials 5 piece powerpoint presentation diagram infographic slide
Introducing Quarterly Performance Financial Summary PowerPoint design. Completely directed PowerPoint layout very sensible for the administration experts and business masters. Broad extension for restoring the spurious information. Also allows to include the organization logo, trademark, and so on. Reconvert able PPT image, topic, structures, setting and so on as per need. Versant with all Google Slides and other system applications. Can be effectively anticipated over wide screen without compromising over its quality.
-
 80311763 style cluster mixed 5 piece powerpoint presentation diagram infographic slide
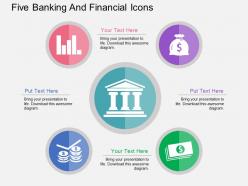
Presenting kk five banking and financial icons flat powerpoint design. This Power Point template diagram has been crafted with graphic of five banking and finance icons. This PPT diagram contains the concept of banking solutions and financial process flow indication .Use this PPT diagram for business and finance related presentations.
-
 98411976 style essentials 2 financials 5 piece powerpoint presentation diagram infographic slide
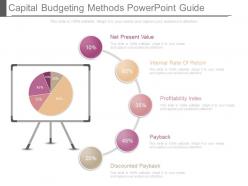
High resolution PPT diagrams. 100 percent editable format. Easy inclusion and exclusion of information as per individual choice. Adaptable and convertible into various formats. Simple to download. For more of personalization one may easily add the company name, logo or trademark. Productive set of PowerPoint icon images for entrepreneurs, investors, internal and external stakeholders, researchers, business analysts and education professionals. The stages in this process are net present value, internal rate of return, profitability index, payback, discounted payback.
-
 56486281 style essentials 2 financials 5 piece powerpoint presentation diagram infographic slide
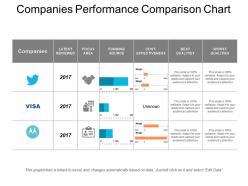
Presenting Companies Performance Comparison Chart Powerpoint Template. The slide is totally compatible with Google Slides. It can be customised as per your requirement. Also, related content can be added in the text holders provided. The size, style and color of the font can be changed according to your requirement. The slide is available in two sizes - standard screen size and wide screen size. It has a high resolution which ensures that the image does not blur upon enlarging. It can be downloaded easily.
-
 38982853 style essentials 2 financials 5 piece powerpoint presentation diagram template slide
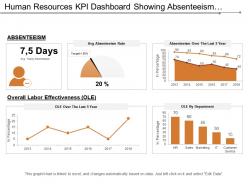
Presenting this set of slides with name - Human Resources Kpi Dashboard Showing Absenteeism Overall Labor Effectiveness. This is a five stage process. The stages in this process are Human Resource, Hrm, Human Capital.
-
 71445631 style layered vertical 5 piece powerpoint presentation diagram infographic slide
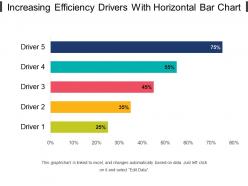
Presenting increasing efficiency drivers with horizontal bar chart. This is a increasing efficiency drivers with horizontal bar chart. This is a five stage process. The stages in this process are increasing efficiency, increasing effectiveness, improving efficiency.
-
 24310075 style essentials 2 financials 5 piece powerpoint presentation diagram template slide
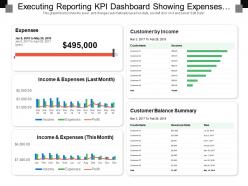
Presenting this set of slides with name - Executing Reporting Kpi Dashboard Showing Expenses Customer By Income. This is a five stage process. The stages in this process are Executive Reporting, Executive Analysis, Executive Performance.
-
 97661786 style essentials 2 financials 5 piece powerpoint presentation diagram infographic slide
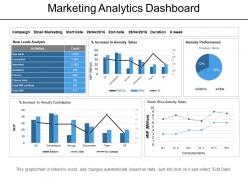
Presenting Marketing Analytics Assessment PowerPoint Templates. The designs are 100% editable in this PowerPoint template. The font size, font color, graphic colors, and slide background can be customized without any hassle. The users can add or remove the images according to their needs. This template includes one slide which is designed by keeping compatibility with Google Slides in mind. It is available in both standard and widescreen.
-
 53044010 style essentials 2 financials 5 piece powerpoint presentation diagram infographic slide
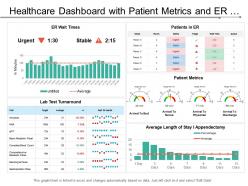
Presenting this set of slides with name - Healthcare Dashboard With Patient Metrics And Er Wait Times. This is a five stage process. The stages in this process are Healthcare, Health Improvement, Medical Care.
-
 24389755 style essentials 2 financials 5 piece powerpoint presentation diagram infographic slide
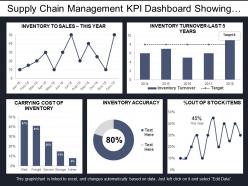
Presenting this set of slides with name - Supply Chain Management Kpi Dashboard Showing Inventory Accuracy And Turnover. This is a five stage process. The stages in this process are Demand Forecasting, Predicting Future Demand, Supply Chain Management.
-
 38522839 style essentials 2 financials 5 piece powerpoint presentation diagram infographic slide
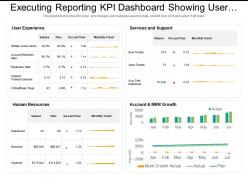
Presenting this set of slides with name - Executing Reporting Kpi Dashboard Showing User Experience And Human Resources. This is a five stage process. The stages in this process are Executive Reporting, Executive Analysis, Executive Performance.
-
 48156063 style essentials 2 financials 5 piece powerpoint presentation diagram infographic slide
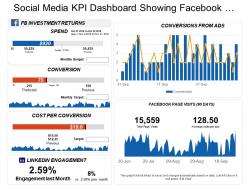
Presenting this set of slides with name - Social Media Kpi Dashboard Showing Facebook Investment Returns Conversion From Ads. This is a five stage process. The stages in this process are Social Media, Digital Marketing, Social Marketing.
-
 24534201 style essentials 2 financials 5 piece powerpoint presentation diagram infographic slide
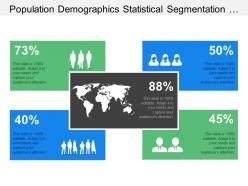
Presenting this set of slides with name - Population Demographics Statistical Segmentation And Analysis. This is a five stage process. The stages in this process are Population, Demographics, People Growth.
-
 10025110 style division pie 5 piece powerpoint presentation diagram infographic slide
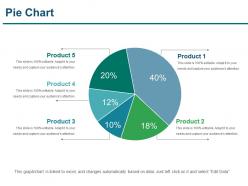
Presenting pie chart powerpoint slide inspiration. This is a pie chart powerpoint slide inspiration . This is a five stage process. The stages in this process are pie chart, finance, marketing, strategy, analysis, business.
-
 73960037 style concepts 1 growth 5 piece powerpoint presentation diagram infographic slide
Presenting define required resources powerpoint layout. This is a define required resources powerpoint layout. This is a five stage process. The stages in this process are project planning task, determine feasibility, determine required human resources, establish project scope, define required resources.
-
 8539858 style essentials 1 location 5 piece powerpoint presentation diagram infographic slide
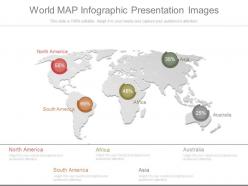
Presenting world map infographic presentation images. This is a world map infographic presentation images. This is a five stage process. The stages in this process are north america, south america, africa, asia, australia.
-
 78946947 style essentials 2 financials 5 piece powerpoint presentation diagram infographic slide
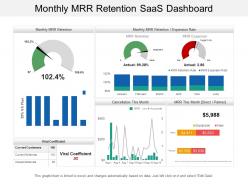
Offering monthly MRR retention Saas dashboard PPT template. Access to convert the presentation design into JPG and PDF. Offer 100% access to change the values, size and style of the slides once downloaded and saved in the desired format. High quality charts, images and visuals used in the designing process. Choice to get presentation slide in standard or in widescreen view. Easy to convert in JPEG and PDF document. Compatible with Google slides. Easy and hassle free downloading process.
-
 76718518 style essentials 2 financials 5 piece powerpoint presentation diagram infographic slide
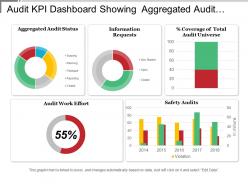
Presenting this set of slides with name - Audit Kpi Dashboard Showing Aggregated Audit Status And Audit Work Effort. This is a five stage process. The stages in this process are Audit, Examine, Survey.
-
 28002366 style essentials 2 financials 5 piece powerpoint presentation diagram infographic slide
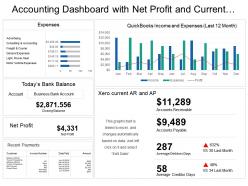
Presenting accounting dashboard with net profit and current accounts payable PPT slideshow. Makes the information clear in the mind of the audience. Editable visuals, colors and charts. Easy to edit and customize as per your needs. Beneficial for industry professionals, technologists, managers, executives, researchers, sales people, etc. Flexible presentation designs can be presented in standard and widescreen view. Privilege of insertion of logo and trademarks for more personalization. Easy to download and save. Highly beneficial PowerPoint Slide for highlighting financial data.
-
 70936361 style concepts 1 growth 5 piece powerpoint presentation diagram infographic slide
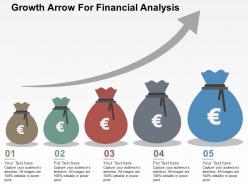
We are proud to present our growth arrow for financial analysis flat powerpoint design. Concept of growth and financial analysis has been displayed in this power point template diagram. This PPT diagram contains the graphic of growth arrow. Use this PPT diagram for business and finance related presentations.
-
 102799 style essentials 2 financials 5 piece powerpoint presentation diagram infographic slide
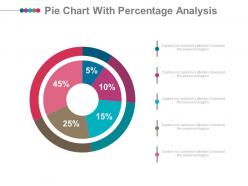
Presenting pie chart with percentage analysis powerpoint slides. This Power Point template slide has been crafted with graphic of pie chart and percentage icons. This PPT slide contains the concept of financial analysis. Use this PPT slide for business and finance related presentations.
-
 87395322 style essentials 2 financials 5 piece powerpoint presentation diagram infographic slide
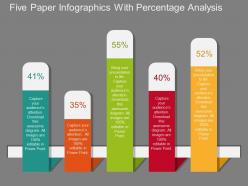
The amazing graphics are fully editable in terms of the colour, size, and placement. Choose the desired file format among JPEG, JPG and PDF to save the template. The easy showcase with Google slides is available along with the high-resolution display. Add the required content and other company specifications in a simplified manner. Remove watermark after downloading of the template.
-
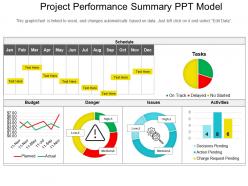 90883182 style essentials 2 financials 5 piece powerpoint presentation diagram infographic slide
Presenting a PPT template named Project performance Summary PPT Model. It is a professionally designed template with relevant visuals and subject driven content. Get easy access to the customizable slide which is linked with the Excel sheet. You can edit the colour, text and font size as per your need. You can add or delete the content if required. The slide is compatible with Google Slides and can be exported in both PDF as well as JPG formats. You can avail this PPT slide both in standard as well as widescreen size.
-
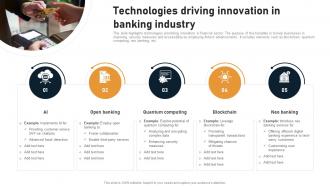 Technologies Driving Innovation In Banking Industry
This slide highlights technologies promoting innovation in financial sector. The purpose of this template is to help businesses in improving security measures and accessibility by employing fintech advancements. It includes elements such as blockchain, quantum computing, neo banking, etc. Presenting our set of slides with Technologies Driving Innovation In Banking Industry This exhibits information on five stages of the process. This is an easy to edit and innovatively designed PowerPoint template. So download immediately and highlight information on Open Banking, Quantum Computing, Blockchain, Neo Banking
-
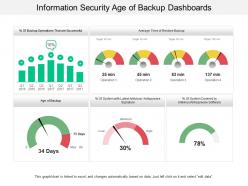 42411238 style essentials 2 financials 5 piece powerpoint presentation diagram infographic slide
Presenting this set of slides with name - Information Security Age Of Backup Dashboards. This is a five stage process. The stages in this process are Information Security Strategy, Information Security Plan, Information Protection Strategy.
-
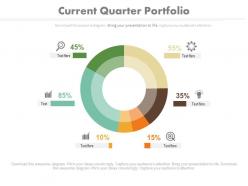 92949503 style division donut 5 piece powerpoint presentation diagram infographic slide
Other than providing you with an excellent experience this PPT slide can be used by professionals for discussing financial and business matters using a flow chart. You can easily ungroup the elements shown in the diagram and according to your liking. Download this slide and insert your company's logo for a professional look and experience it in full screen version.
-
 66241018 style essentials 2 financials 5 piece powerpoint presentation diagram infographic slide
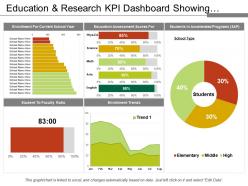
Presenting education and research KPI dashboard snapshot showing enrolment and SAP PPT slide. The enrolment and SAP analytic KPI dashboard PowerPoint template designed by the professional team of SlideTeam. The SAP package KPI report slide is fully editable in PowerPoint. The research SAP dashboard presentation slide is compatible with Google Slide so a user can share this SAP analytic dashboard slide with others. A user can make changes in the font size, font type, color as well as dimensions of the SAP analytics cloud business content dashboard PowerPoint template as per the requirement.
-
 7302635 style essentials 2 financials 5 piece powerpoint presentation diagram infographic slide
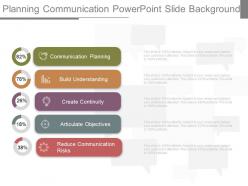
Presenting planning communication powerpoint slide background. This is a planning communication powerpoint slide background. This is a five stage process. The stages in this process are communication planning, build understanding, create continuity, articulate objectives, reduce communication risks.
-
 97914008 style concepts 1 growth 5 piece powerpoint presentation diagram infographic slide
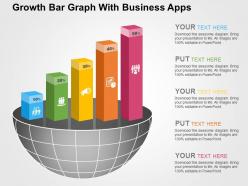
We are proud to present our growth bar graph with business apps flat powerpoint design. Graphic of bar graph and business apps has been used to craft this power point template diagram. This PPT diagram contains the concept of growth analysis. Use this PPT diagram for business and marketing related presentations.
-
 45331306 style essentials 2 financials 5 piece powerpoint presentation diagram infographic slide
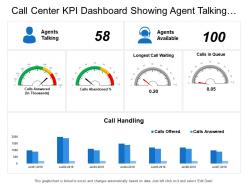
Presenting this set of slides with name - Call Center Kpi Dashboard Showing Agent Talking Longest Call Waiting Call Handling. This is a five stage process. The stages in this process are Call Center Agent, Customer Care, Client Support.
-
 17848153 style concepts 1 growth 5 piece powerpoint presentation diagram infographic slide
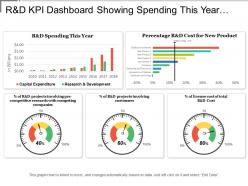
Presenting this set of slides with name - R And D Kpi Dashboard Showing Spending This Year And Cost For New Product. This is a five stage process. The stages in this process are R And D, Research And Development, Research And Technological Development.
-
 3732719 style essentials 2 financials 5 piece powerpoint presentation diagram infographic slide
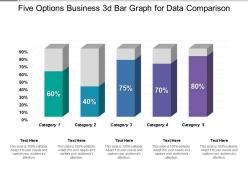
Presenting this set of slides with name - Five Options Business 3d Bar Graph For Data Comparison. This is a five stage process. The stages in this process are Paint Brush, Art, Coloring.
-
 94757693 style essentials 2 financials 5 piece powerpoint presentation diagram infographic slide
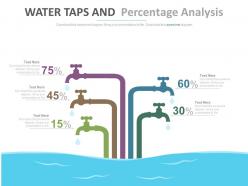
Presenting five staged water taps and percentage analysis powerpoint slides. This Power Point template diagram has been crafted with graphic of five staged water taps and percentage diagram. This PPT diagram contains the concept of business data analysis. Use this PPT diagram for business and finance related presentations.
-
 75674013 style essentials 2 financials 5 piece powerpoint presentation diagram infographic slide
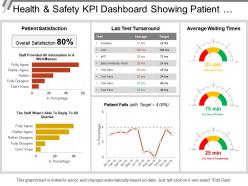
Presenting this set of slides with name - Health And Safety Kpi Dashboard Showing Patient Satisfaction And Lab Test Turnaround. This is a five stage process. The stages in this process are Health And Safety, Health And Security, Health And Protection.
-
 45276543 style essentials 2 financials 5 piece powerpoint presentation diagram infographic slide
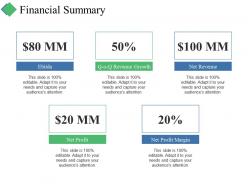
Presenting this set of slides with name - Financial Summary Ppt Summary File Formats. This is a five stage process. The stages in this process are Finance, Marketing, Business, Planning, Strategy.
-
 55817681 style essentials 2 financials 5 piece powerpoint presentation diagram infographic slide
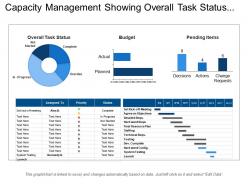
Presenting this set of slides with name - Capacity Management Showing Overall Task Status Budget Pending Items. This is a five stage process. The stages in this process are Problem Statement And Solution, Challenges And Solutions, Issues And Solutions.
-
 77576042 style essentials 2 financials 5 piece powerpoint presentation diagram infographic slide
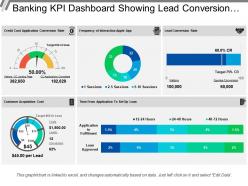
Presenting this set of slides with name - Banking Kpi Dashboard Showing Lead Conversion And Acquisition Cost. This is a five stage process. The stages in this process are Banking, Finance, Money.
-
 88830346 style essentials 2 financials 5 piece powerpoint presentation diagram infographic slide
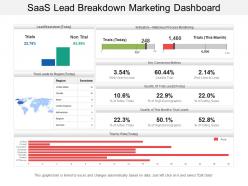
Presenting this set of slides with name - Saas Lead Breakdown Marketing Dashboard. Stunning Saas lead breakdown marketing dashboard PPT template. Download is rapid and can be displayed in widescreen view mode also. 100% editable PPT designs as completely modifiable such as icons, text, colors, etc. Effortlessly convertible into JPEG and PDF file formats. Top quality and creative PowerPoint slide design. Adjustable presentation graphic as compatible with Google slides. Perfect for sales executives, marketers, business professionals, analysts, strategists, students, teachers, etc. Information on making the changes has been provided for your provision.
-
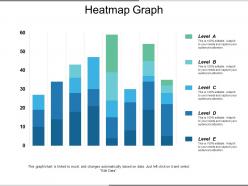 19413284 style essentials 2 financials 5 piece powerpoint presentation diagram infographic slide
Presenting the Heatmap Graph PowerPoint theme which is designed professionally for your convenience. Open and save your presentation in various formats like PDF, JPG, and PNG. You can freely access your presentation in both 4:3 and 16:9 aspect ratio. Alter the font, color, font size, and font types of the slides as per your needs. This template is compatible with Google Slides which makes it easily accessible at once.
-
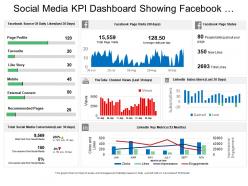 73902800 style essentials 2 financials 5 piece powerpoint presentation diagram infographic slide
Presenting this set of slides with name - Social Media Kpi Dashboard Showing Facebook Page Stats Youtube Channel Views. This is a five stage process. The stages in this process are Social Media, Digital Marketing, Social Marketing.
-
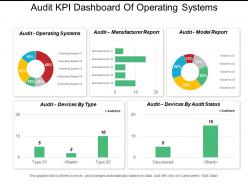 18075649 style essentials 2 financials 5 piece powerpoint presentation diagram template slide
Presenting this set of slides with name - Audit Kpi Dashboard Of Operating Systems Manufacturer Report And Model Report. This is a five stage process. The stages in this process are Audit, Examine, Survey.
-
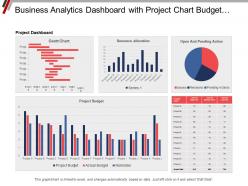 73274958 style essentials 2 financials 5 piece powerpoint presentation diagram infographic slide
This is a five stage process. The stages in this process are Business Analytics, BA, Organizations Data.
-
 76178503 style concepts 1 growth 5 piece powerpoint presentation diagram infographic slide
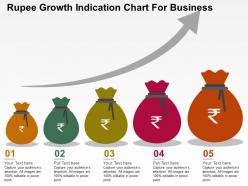
Easy to input company logo, brand name or name. Presentation templates quality remain similar even when you resize the image. This PPT template fully compatible with Google slides. Formats can easily be changed into other software’s applications like PDF and JPEG. Amend PowerPoint design slides font, text, color and design as per your necessities. Ideal for entrepreneurs and large business organization.
-
 65442761 style essentials 2 financials 5 piece powerpoint presentation diagram infographic slide
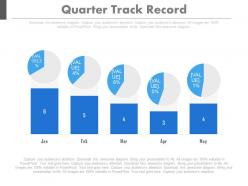
Presenting use quarter percentage track record powerpoint slides. This Power Point template slide has been crafted with graphic of percentage icons. This PPT slide contains the concept of data record analysis. Use this PPT slide for business and sales related presentations.


