Easy-to-Edit 5-step All Essential Financial Presentation Diagram
-
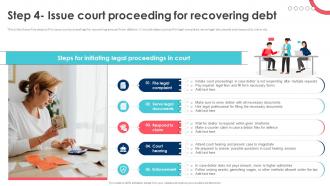 Debt Recovery Process Step 4 Issue Court Proceeding For Recovering Debt
This slide shows five steps to file issue court proceedings for recovering amount from debtors. It include steps such as file legal complaint, serve legal documents and respond to claim, etc. Increase audience engagement and knowledge by dispensing information using Debt Recovery Process Step 4 Issue Court Proceeding For Recovering Debt. This template helps you present information on five stages. You can also present information on Serve Legal Documents, Court Hearing, Enforcement, Issue Court Proceeding using this PPT design. This layout is completely editable so personaize it now to meet your audiences expectations.
-
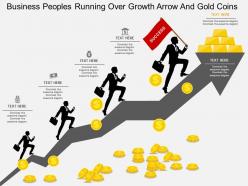 49294833 style concepts 1 growth 5 piece powerpoint presentation diagram template slide
Presenting wa business peoples running over growth arrow and gold coins flat powerpoint design. This Power Point template diagram has been crafted with graphic of business peoples, growth arrow and gold coins. This PPT diagram contains the concept of business growth and team management. Use this PPT diagram for business and marketing related presentations.
-
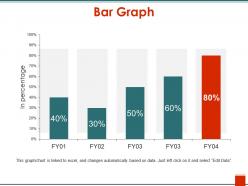 33112722 style concepts 1 growth 5 piece powerpoint presentation diagram infographic slide
Presenting the Bar Graph PowerPoint Ideas template. The template is fully editable in MS PowerPoint and other similar software. Modify the font type, size, diagram color, background color, etc. according to your needs. The slide is also compatible with Google Slides and can be saved in numerous images or document formats such as JPG or PDF. High-quality graphics ensure that pixelation does not arise.
-
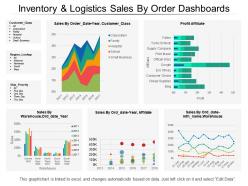 6154852 style essentials 2 financials 5 piece powerpoint presentation diagram infographic slide
Presenting this set of slides with name - Inventory And Logistics Sales By Order Dashboards. This is a five stage process. The stages in this process are Inventory And Logistics, Inventory Management, Warehousing And Inventory Management.
-
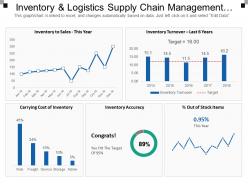 17348758 style division donut 5 piece powerpoint presentation diagram infographic slide
Presenting inventory and logistics supply chain management dashboards PowerPoint template. Access to edit the content, style, size and orientation of the PPT slides. Extremely spacious to cover all the aspects of the company profile. High resolution images do not pixelate when projected on wide screen. Personalize the PPT with your company name and logo. Modify the presentation elements as per the need of an hour. Compatible with numerous software and format options. Used by entrepreneurs, marketers, managerial department, stakeholders and students. Self-explanatory and intellectual slide charts.
-
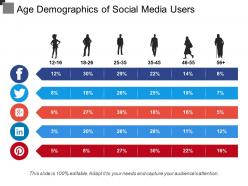 27440375 style essentials 2 financials 5 piece powerpoint presentation diagram infographic slide
Presenting this set of slides with name - Age Demographics Of Social Media Users. This is a five stage process. The stages in this process are Population, Demographics, People Growth.
-
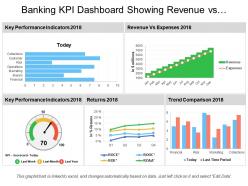 13400230 style essentials 2 financials 5 piece powerpoint presentation diagram infographic slide
Presenting this set of slides with name - Banking Kpi Dashboard Showing Revenue Vs Expenses And Returns. This is a five stage process. The stages in this process are Banking, Finance, Money.
-
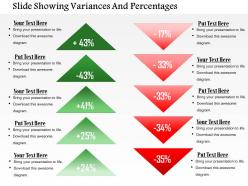 58872920 style layered vertical 5 piece powerpoint presentation diagram infographic slide
Impressive use of colors to create an eye catchy visual. High resolution pictures. No flaw in picture output when projected on wide screen. Compatibility with numerous format options. Harmonious with large set of software. Thoroughly editable slide design layout. Ease of incorporating changes. Personalize the content with company specific name, logo and trademark. Used by financiers, sales professionals, students and teachers.
-
 97902406 style essentials 2 financials 5 piece powerpoint presentation diagram infographic slide
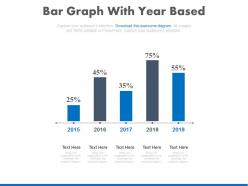
Presenting bar graph with year based timeline percentage chart powerpoint slides. This Power Point template diagram slide has been crafted with bar graph, percentage chart and timeline icons. This PPT diagram slide contains the concept of financial data analysis. Use this PPT slide for finance and business related presentations.
-
 Cosmetic Body Product Summary Report
This slide showcase skin refreshing body lotion to provide even skin tone and remove dryness. It include elements such as product description, key ingredients, who ca n use, how to use etc. Introducing our premium set of slides with Cosmetic Body Product Summary Report Ellicudate the five stages and present information using this PPT slide. This is a completely adaptable PowerPoint template design that can be used to interpret topics like Key Ingredients, Product Description, Variants So download instantly and tailor it with your information.
-
 79849249 style essentials 2 financials 5 piece powerpoint presentation diagram infographic slide
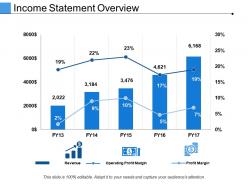
Presenting this set of slides with name - Income Statement Overview Presentation Portfolio. This is a five stage process. The stages in this process are Finance, Marketing, Bar, Planning, Growth.
-
 25948133 style division pie 5 piece powerpoint presentation diagram infographic slide
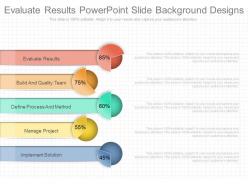
Presenting evaluate results powerpoint slide background designs. This is a evaluate results powerpoint slide background designs. This is a five stage process. The stages in this process are evaluate results, build and quality team, define process and method, manage project, implement solution.
-
 41932520 style essentials 2 financials 5 piece powerpoint presentation diagram infographic slide
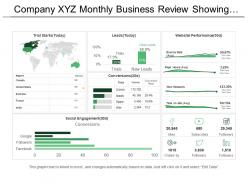
Presenting this set of slides with name - Company Xyz Monthly Business Review Showing Marketing Performance Dashboard. This is a five stage process. The stages in this process are Monthly Business Review, Monthly Business Report, Monthly Company Review.
-
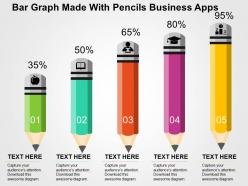 91474687 style concepts 1 growth 5 piece powerpoint presentation diagram infographic slide
This PowerPoint presentation can be used to represent a company's business and data related presentations in a simple and approachable way. The elements used in this PPT slide are 100% editable by means of color, shape, and orientation. These PPT slides are compatible with Google slides and can be edited in any PowerPoint software.
-
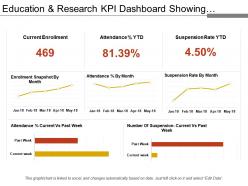 68269875 style essentials 2 financials 5 piece powerpoint presentation diagram infographic slide
Presenting education and research KPI dashboard showing attendance and suspension rate PPT slide. The suspension rate KPI dashboard PPT slide designed by the professional team of SlideTeam. The attendance rate report slide is 100% editable in PowerPoint. The attendance and detention KPI dashboard PowerPoint slide is compatible with Google Slide so a user can share this attendance rate dashboard slide with others. A user can make changes in the font size, font type, color as well as dimensions of the college acceptance rate dashboard PPT template as per the requirement. You may edit the value in the reporting tool KPI dashboard presentation template as the slide gets linked with the Excel sheet.
-
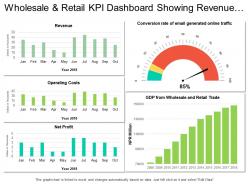 60511645 style essentials 2 financials 5 piece powerpoint presentation diagram infographic slide
Presenting the KPI dashboard presentation template. This PowerPoint slide is fully editable in PowerPoint and is professionally designed. The user can bring changes to edit the objects in the slide like font size and font color without going through any hassle. This presentation slide is 100% compatible with Google Slide and can be saved in JPG or PDF file format without any fuss. Fast download this at the click of the button.
-
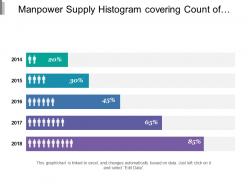 16852502 style essentials 2 financials 5 piece powerpoint presentation diagram infographic slide
Presenting this set of slides with name - Manpower Supply Histogram Covering Count Of Hiring Of Year Over Year In Percent. This is a five stage process. The stages in this process are Manpower Supply, Manpower Service, Manpower Recruitment.
-
 96573578 style essentials 2 financials 5 piece powerpoint presentation diagram infographic slide
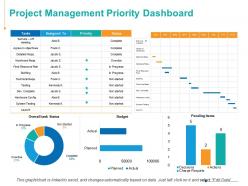
Presenting this set of slides with name - Project Management Priority Dashboard Marketing Ppt Powerpoint Presentation Inspiration Outline. This is a five stage process. The stages in this process are Staffing, Priority, Budget, Planned, Actual.
-
 73967974 style essentials 2 financials 5 piece powerpoint presentation diagram infographic slide
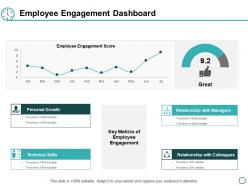
Presenting this set of slides with name - Employee Engagement Dashboard Ppt Powerpoint Presentation Layouts Ideas. This is a five stages process. The stages in this process are Personal Growth, Technical Skills, Relationship With Colleagues, Business, Management.
-
 76061434 style concepts 1 growth 5 piece powerpoint presentation diagram infographic slide
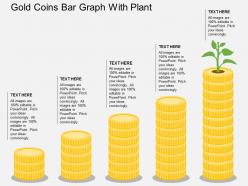
We are proud to present our gold coins bar graph with plant flat powerpoint design. Graphic of gold coins and bar graph with plant has been used to craft this power point template diagram. This PPT diagram contains the concept of result analysis. Use this PPT diagram for business and marketing target related presentations.
-
 6385809 style circular semi 5 piece powerpoint presentation diagram infographic slide
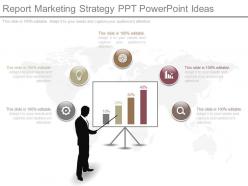
Time saving PowerPoint template on part of designing and formatting. Professionally proficient PPT presentation layout. Easily editable colors, text, fonts, shapes, icons and orientation. Impressive picture quality provides high resolution output. Zero issue of pixilation when projected on wide screen. Hassle free inclusion and exclusion of company name, logo and trademark. Compatible with multiple software and formats. Marketers, strategists, business planners, students and teachers make vivid use of this slide design in their presentations.
-
 99162906 style essentials 2 financials 5 piece powerpoint presentation diagram infographic slide
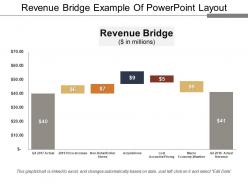
Presenting this set of slides with name - Revenue Bridge Example Of Powerpoint Layout. This is a five stage process. The stages in this process are Revenue Bridge, Income Bridge, Earnings Bridge.
-
 19018884 style essentials 2 financials 5 piece powerpoint presentation diagram infographic slide
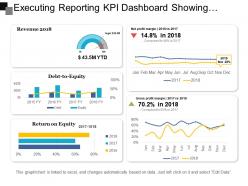
Presenting this set of slides with name - Executing Reporting Kpi Dashboard Showing Revenue Net Profit Margin Debt To Equity. This is a five stage process. The stages in this process are Executive Reporting, Executive Analysis, Executive Performance.
-
 11580578 style essentials 2 financials 5 piece powerpoint presentation diagram infographic slide
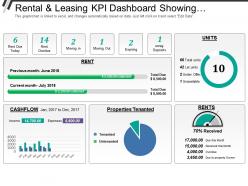
Presenting this set of slides with name - Rental And Leasing Kpi Dashboard Showing Rent Due Today Rent Overdue Properties Tenanted. This is a five stage process. The stages in this process are Rental And Leasing, Dealing And Leasing, Rental And Engage.
-
 35747243 style concepts 1 growth 5 piece powerpoint presentation diagram infographic slide
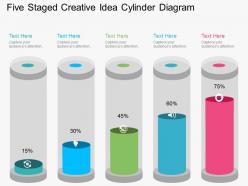
Presenting fg five staged creative idea cylinder diagram flat powerpoint design. Five staged cylinder diagram has been used to craft this power point template diagram. This PPT diagram contains the concept of creative business generation. Use this PPT diagram for business and marketing related presentations.
-
 5535599 style essentials 2 financials 5 piece powerpoint presentation diagram infographic slide
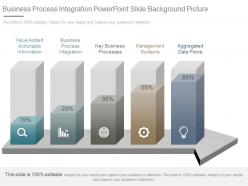
Presenting business process integration powerpoint slide background picture. This is a business process integration powerpoint slide background picture. This is a five stage process. The stages in this process are value added actionable information, business process integration, key business processes, management systems, aggregated data flows.
-
 65970131 style essentials 2 financials 5 piece powerpoint presentation diagram infographic slide
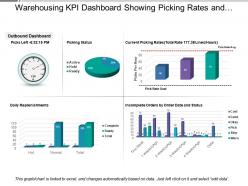
The professionally built, business oriented slide is completely editable; you can modify and customize the design according to your business needs. You may include business logo, trademarks to personalize the slideshow. The slideshow can be opened and updated with Google Slides and MS PowerPoint software. Quick and easy downloading available; PPT design can be downloaded as JPEG or PDF format.
-
 53451463 style essentials 2 financials 5 piece powerpoint presentation diagram infographic slide
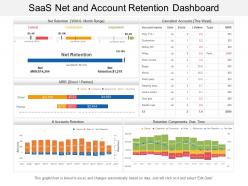
Presenting this set of slides with name - Saas Net And Account Retention Dashboard. Awesome blend colors, font and shape. PowerPoint template is completely flexible with Google slides and simply alterable into JPEG and PDF. Choice edits and personalizes the PPT design by including the business symbol. Similar designs come with different nodes and stages. Easy to portray in standard and widescreen view options and can be shared with large set of audience. Download is fast and saves valuable time. High resolution and awesome quality Presentation slide.
-
 76301312 style concepts 1 growth 5 piece powerpoint presentation diagram infographic slide
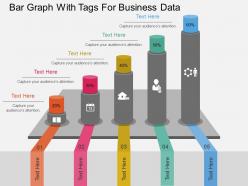
Presenting pptx bar graph with tags for business data flat powerpoint design. This Power Point template diagram has been crafted with graphic of bar graph and tags icons. This PPT diagram contains the concept of business data analysis and business planning. Use this PPT diagram for business and finance related presentations.
-
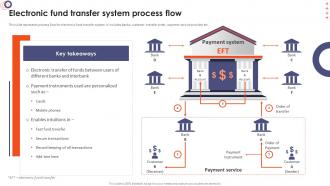 Online Banking Management Electronic Fund Transfer System Process Flow
This slide represents process flow for electronic fund transfer system. It includes banks, customer, transfer order, payment service provider etc. Introducing Online Banking Management Electronic Fund Transfer System Process Flow to increase your presentation threshold. Encompassed with five stages, this template is a great option to educate and entice your audience. Dispence information on Payment Instruments, Secure Transactions, Fast Fund Transfer, Electronic Fund Transfer, using this template. Grab it now to reap its full benefits.
-
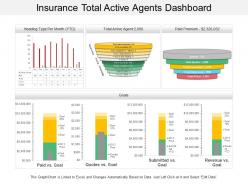 23706782 style essentials 2 financials 5 piece powerpoint presentation diagram infographic slide
• Multi colored beautifully designed visuals • Easy to download • Easy to customize and personalize • Ease of inclusion and exclusion of slide content as per company specific data • Thoroughly editable slides • High resolution visuals • Compatible with Google slides • Compatible with numerous forms format options available in market • Harmonious with multiple software options • Used by business analysts, insurance companies, insurance employees, and other such professionals.
-
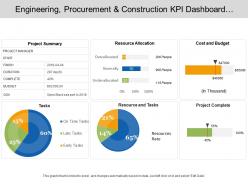 12605361 style essentials 2 financials 5 piece powerpoint presentation diagram infographic slide
Presenting this set of slides with name - Engineering Procurement And Construction Kpi Dashboard Showcasing Project Summary Cost And Budget. This is a five stage process. The stages in this process are Engineering, Procurement And Construction, Construction Management, Engineering, Purchasing And Construction .
-
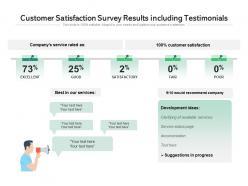 Customer satisfaction survey results including testimonials
Presenting this set of slides with name Customer Satisfaction Survey Results Including Testimonials. This is a five stage process. The stages in this process are Excellent, Good, Satisfactory, Fair, Poor. This is a completely editable PowerPoint presentation and is available for immediate download. Download now and impress your audience.
-
 17316818 style essentials 2 financials 5 piece powerpoint presentation diagram infographic slide
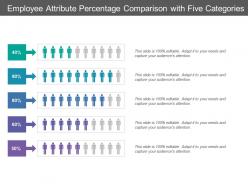
Presenting this set of slides with name - Employee Attribute Percentage Comparison With Five Categories. This is a five stage process. The stages in this process are Percentage Comparison, Percentage Compare, Percentage Balancing.
-
 30613672 style essentials 2 financials 5 piece powerpoint presentation diagram infographic slide
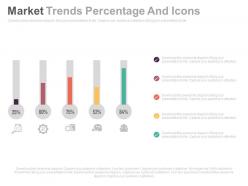
Presenting five staged market trends percentage and icons powerpoint slides. This Power Point template slide has been crafted with graphic of five staged percentage and icons. This PPT slide contains the concept of financial growth analysis. Use this PPT slide for business and finance related presentations.
-
 4404606 style essentials 2 financials 5 piece powerpoint presentation diagram infographic slide
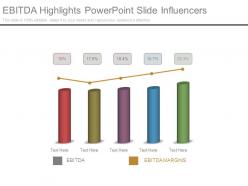
Presenting ebitda highlights powerpoint slide influencers. This is a ebitda highlights powerpoint slide influencers. This is a five stage process. The stages in this process are graph chart, strategy, management, business, success.
-
 56976718 style essentials 2 dashboard 5 piece powerpoint presentation diagram infographic slide
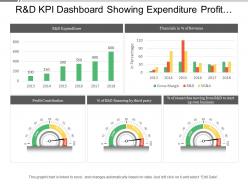
Presenting this set of slides with name - R And D Kpi Dashboard Showing Expenditure Profit Contribution And Financial In Percentage Of Revenue. This is a five stage process. The stages in this process are R And D, Research And Development, Research And Technological Development.
-
 31623030 style essentials 2 financials 5 piece powerpoint presentation diagram infographic slide
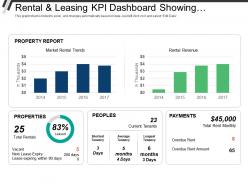
Presenting this set of slides with name - Rental And Leasing Kpi Dashboard Showing Properties People Payments Rental Revenue. This is a five stage process. The stages in this process are Rental And Leasing, Dealing And Leasing, Rental And Engage.
-
 19216359 style division pie 5 piece powerpoint presentation diagram infographic slide
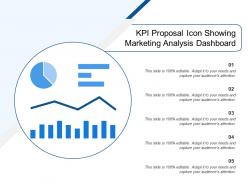
Presenting this set of slides with name - Kpi Proposal Icon Showing Marketing Analysis Dashboard. This is a five stage process. The stages in this process are Kpi Proposal, Kpi Plan, Kpi Scheme.
-
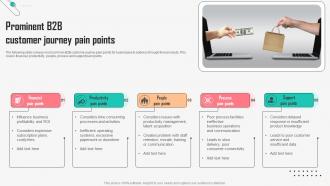 Prominent B2B Customer Journey Pain Points
The following slide conveys most common B2B customer journey pain points for businesses to address through their products. This covers financial, productivity, people, process and support pain points. Introducing our premium set of slides with Prominent B2B Customer Journey Pain Points. Ellicudate the Five stages and present information using this PPT slide. This is a completely adaptable PowerPoint template design that can be used to interpret topics like Financial Pain Points, Productivity Pain Points. So download instantly and tailor it with your information.
-
 14107897 style essentials 2 financials 5 piece powerpoint presentation diagram infographic slide
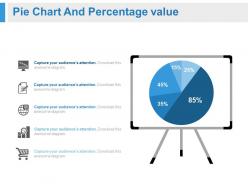
Presenting white board with pie chart and percentage powerpoint slides. This Power Point template slide has been crafted with graphic of white board and pie chart diagram. This PPT slide contains the concept of business result analysis. Use this PPT slide for business and finance related presentations.
-
 39358768 style essentials 2 financials 5 piece powerpoint presentation diagram infographic slide
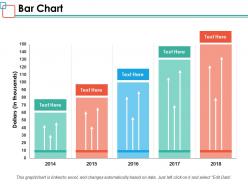
Presenting this set of slides with name - Bar Chart Ppt Powerpoint Presentation Inspiration Images. This is a five stage process. The stages in this process are Business, Management, Strategy, Analysis, Marketing.
-
 92407063 style essentials 2 financials 5 piece powerpoint presentation diagram infographic slide
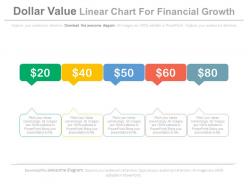
Presenting dollar value linear chart for financial growth powerpoint slides. This Power Point template slide has been crafted with graphic of dollar value linear chart icons. This PPT slide contains the concept of financial growth analysis. Use this PPT slide for business and finance related presentations.
-
 39026421 style circular semi 5 piece powerpoint presentation diagram template slide
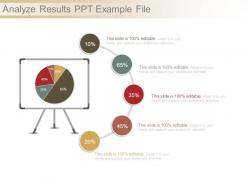
Presenting analyze results ppt example file. This is a analyze results ppt example file. This is five stage process. The stages in this process are business, pie chart, finance, strategy, success, analysis.
-
 35955327 style essentials 2 financials 5 piece powerpoint presentation diagram infographic slide
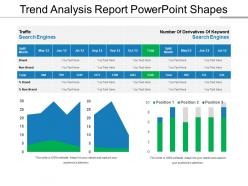
Presenting Trend Analysis Report PowerPoint Shapes. Customize the slide as per your wants. You are free to change anything in the slide. Modify the colors, background, font type, and font size. It can be transformed and saved in various formats like JPG, PNG, PDF, and JPEG. The slide goes well with the Google Slides and major Microsoft versions. It can be viewed on standard screen size and widescreen size as well.
-
 17551351 style essentials 2 financials 5 piece powerpoint presentation diagram infographic slide
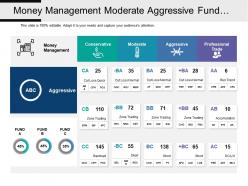
Presenting this set of slides with name - Money Management Moderate Aggressive Fund Market Analytics Table With Icons. This is a five stage process. The stages in this process are Marketing Analytics, Marketing Performance, Marketing Discovery.
-
 5 Stages Of GRC Maturity Model
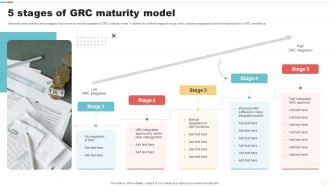
Mentioned slide outlines various stages of governance, risk and compliance GRC maturity model. It defines the different stages through which company progress to achieve the desired level of GRC excellence. Introducing our premium set of slides with 5 Stages Of GRC Maturity Model. Ellicudate the five stages and present information using this PPT slide. This is a completely adaptable PowerPoint template design that can be used to interpret topics like Low GRC Integration, High GRC Integration. So download instantly and tailor it with your information.
-
 4593973 style essentials 2 financials 5 piece powerpoint presentation diagram infographic slide
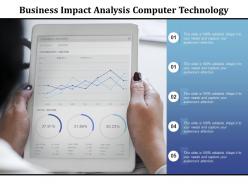
Presenting this set of slides with name - Business Impact Analysis Computer Technology. This is a five stage process. The stages in this process are Business Continuity Planning, Business Impact Analysis.
-
 Banking Solutions For Improving Customer Process To Complete Payments Via Mobile Banking Fin SS V
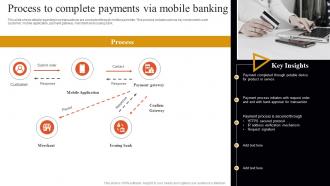
This slide shows details regarding how transactions are conducted through mobile payments. This process includes various key components such customer, mobile application, payment gateway, merchant and issuing bank. Introducing Banking Solutions For Improving Customer Process To Complete Payments Via Mobile Banking Fin SS V to increase your presentation threshold. Encompassed with five stages, this template is a great option to educate and entice your audience. Dispence information on Mobile Application, Payment Gateway, Confirm Gateway, Merchant , using this template. Grab it now to reap its full benefits.
-
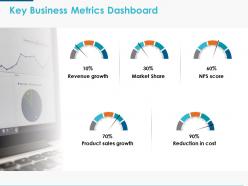 Key business metrics dashboard ppt powerpoint presentation icon clipart
Presenting this set of slides with name Key Business Metrics Dashboard Ppt Powerpoint Presentation Icon Clipart. This is a five process. The stages in this process are Finance, Analysis, Business, Investment, Marketing. This is a completely editable PowerPoint presentation and is available for immediate download. Download now and impress your audience.
-
 Tips five for personal finance
Presenting this set of slides with name Tips Five For Personal Finance. This is a five stage process. The stages in this process are Track Your Net Worth, Set Goals And Invest, Control Your Debt, Maintain Emergency Fund, Save For Retirement. This is a completely editable PowerPoint presentation and is available for immediate download. Download now and impress your audience.
-
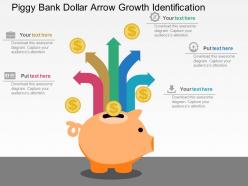 7083073 style concepts 1 growth 5 piece powerpoint presentation diagram infographic slide
We are proud to present our piggy bank dollar arrow growth identification flat powerpoint design. Concept of money saving and growth has been displayed in this power point template diagram. This PPT diagram contains the graphic of piggy bank and dollar with growth arrows. Use this PPT diagram for finance and money related presentations.
-
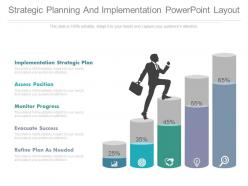 86086720 style concepts 1 growth 5 piece powerpoint presentation diagram infographic slide
Presenting strategic planning and implementation powerpoint layout. This is a strategic planning and implementation powerpoint layout. This is a five stage process. The stages in this process are implementation strategic plan, assess position, monitor progress, evacuate success, refine plan as needed.
-
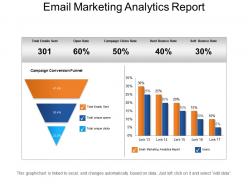 95026379 style essentials 2 financials 5 piece powerpoint presentation diagram template slide
Presenting Marketing Analytics Report PowerPoint Slide Show. Modify the colors, font size and font type as per your needs. You just need to replace the sample text with your text and your presentation will be ready in minutes. This slide is linked to an Excel sheet and can be transformed into JPG and PDF formats. You may add or remove the number of fields according to your requirements. Get this template now in standard screen and widescreen.
-
 Alibaba Business Model Solution Ppt File Infographic Template BMC SS
This slide provide the solutions offered by the company to address issues. It includes global buying and selling, offers electronic payments, shopping search engines, etc. Increase audience engagement and knowledge by dispensing information using Alibaba Business Model Solution Ppt File Infographic Template BMC SS. This template helps you present information on five stages. You can also present information on Includes Shopping Search Engines, Provides Cloud Computing Services, Global Buying And Selling using this PPT design. This layout is completely editable so personaize it now to meet your audiences expectations.
-
 7153428 style essentials 2 financials 5 piece powerpoint presentation diagram infographic slide
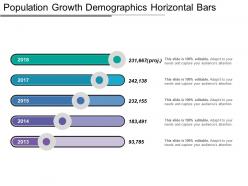
Presenting this set of slides with name - Population Growth Demographics Horizontal Bars. This is a five stage process. The stages in this process are Population, Demographics, People Growth.
-
 17145194 style essentials 2 financials 5 piece powerpoint presentation diagram infographic slide
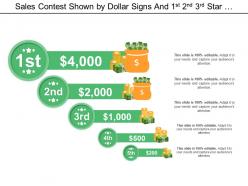
Presenting this set of slides with name - Sales Contest Shown By Dollar Signs And 1st 2nd 3rd Star Position. This is a five stage process. The stages in this process are Sales Contest, Sales Competition, Sales Opposition.
-
 85299505 style essentials 2 financials 5 piece powerpoint presentation diagram template slide
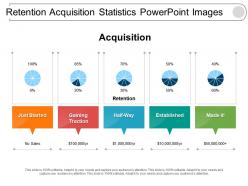
Introducing retention acquisition statistics PowerPoint design. This PowerPoint design is adaptable with all software’s operations and all Google Slides. This Presentation slide can also be simply exportable into PDF or JPG file schemes. This PPT image can be displayed in a larger screen ratio with an unaffected high resolution. All the aspects or features of this Presentation graphic like matter, pattern, context, intensity etc. can be manually manageable.
-
 62654694 style layered funnel 5 piece powerpoint presentation diagram infographic slide
Presenting, agile development showing product owner with iteration plan and planning meeting PPT template. This PPT slide can be used for agile development and sprint planning related presentations by experts, students or strategists. All the icons practiced here are 100% editable in PowerPoint software. You can change the color, size, and format of any icon to your liking. Insert your business logo in the PPT slide, which is also compatible with google slides.
-
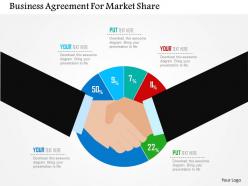 11383656 style concepts 1 opportunity 5 piece powerpoint presentation diagram infographic slide
We are proud to present our business agreement for market share flat powerpoint design. Concept of business agreement for market research and share has been displayed in this PPT diagram. This PPT diagram contains the graphic of handshake and pie graph. Use this PPT diagram for business and marketing related presentations.


