Easy-to-Edit 5-step All Essential Financial Presentation Diagram
-
 21168073 style essentials 2 financials 5 piece powerpoint presentation diagram infographic slide
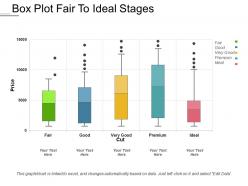
Presenting box plot fair to ideal stages. This is a box plot fair to ideal stages. This is a five stage process. The stages in this process are box plot, statistical data, whiskers plot, statistical distribution.
-
 78468844 style essentials 2 financials 5 piece powerpoint presentation diagram infographic slide
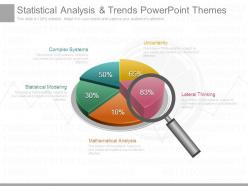
Presenting statistical analysis and trends powerpoint themes. This is a statistical analysis and trends powerpoint themes. This is a five stage process. The stages in this process are uncertainty, lateral thinking, mathematical analysis, statistical modeling, complex systems.
-
 75319492 style essentials 2 financials 5 piece powerpoint presentation diagram infographic slide
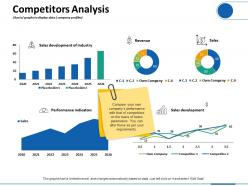
Presenting this set of slides with name - Competitors Analysis Charts Graphs To Display Data Company Profiles. This is a five stage process. The stages in this process are Revenue, Sales Development, Performance Indicators, Finance, Marketing.
-
 Solutions Network Load Balancers Provide Ppt Infographics Guide
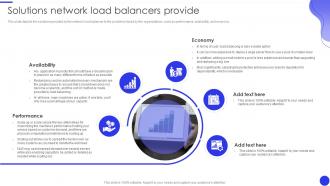
This slide depicts the solutions provided by the network load balancer to the problems faced by the organizations, such as performance, availability, and economy. Increase audience engagement and knowledge by dispensing information using Solutions Network Load Balancers Provide Ppt Infographics Guide. This template helps you present information on five stages. You can also present information on Economy, Availability, Performance using this PPT design. This layout is completely editable so personaize it now to meet your audiences expectations.
-
 71944463 style essentials 2 financials 5 piece powerpoint presentation diagram infographic slide
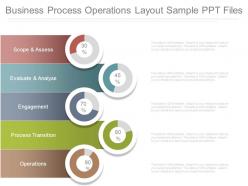
Presenting business process operations layout sample ppt files. This is a business process operations layout sample ppt files. This is a five stage process. The stages in this process are scope and assess, evaluate and analyze, engagement, process transition, operations.
-
 66569302 style essentials 2 financials 5 piece powerpoint presentation diagram infographic slide
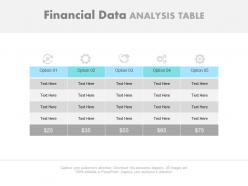
Presenting five staged financial data analysis table powerpoint slides. This is a five staged financial data analysis table powerpoint slides. This is a five stage process. The stages in this process are financials.
-
 72955168 style concepts 1 growth 5 piece powerpoint presentation diagram infographic slide
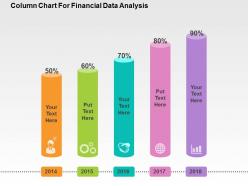
We are proud to present our coloumn chart for financial data analysis flat powerpoint design. Graphic of coloumn chart has been used to design this power point template diagram. This PPT diagram contains the concept of financial data analysis. Use this PPT diagram for finance and business related presentations and get good remarks.
-
 Increased Revenue Through Digital Supply Chain Logistics Automation Systems
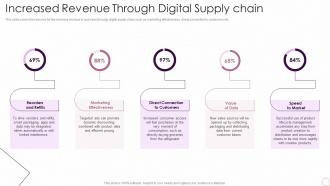
This slide covers the reasons for the increase revenue in business through digital supply chain such as marketing effectiveness, direct connection to customers etc. Introducing Increased Revenue Through Digital Supply Chain Logistics Automation Systems to increase your presentation threshold. Encompassed with five stages, this template is a great option to educate and entice your audience. Dispence information on Reorders And Refills, Marketing Effectiveness, Value Data, using this template. Grab it now to reap its full benefits.
-
 18150264 style division pie 5 piece powerpoint presentation diagram infographic slide
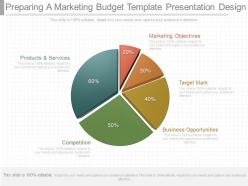
Presenting one preparing a marketing budget template presentation design. This is a preparing a marketing budget template presentation design. This is a five stage process. The stages in this process are marketing objectives, target mark, business opportunities, competition, products and services.
-
 35476180 style essentials 2 financials 5 piece powerpoint presentation diagram infographic slide
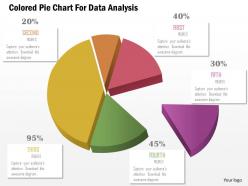
We are proud to present our 1114 colored pie chart for data analysis powerpoint template. Graphic of colored pie chart has been used to design this Power Point template slide. This PPt slide contains the concept of data analysis. Use this PPT slide for your business and finance data related analysis.
-
 5048350 style essentials 2 financials 5 piece powerpoint presentation diagram infographic slide
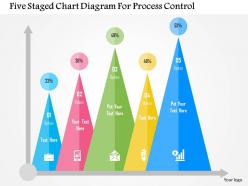
We are proud to present our five staged chart diagram for process control flat powerpoint design. Five staged chart has been used to craft this power point template diagram. This PPT diagram contains the concept of process control. Use this diagram PPT for business and finance related presentations.
-
 57270516 style essentials 2 financials 5 piece powerpoint presentation diagram infographic slide
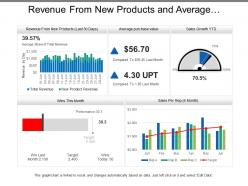
Presenting this set of slides with name - Revenue From New Products And Average Purchase Value Sales Dashboards. This is a five stage process. The stages in this process are Sales Dashboard, Sales Kpis, Sales Performance.
-
 68775635 style concepts 1 growth 5 piece powerpoint presentation diagram infographic slide
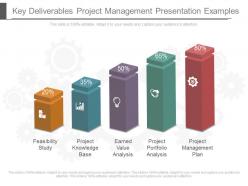
Presenting key deliverables project management presentation examples. This is a key deliverables project management presentation examples. This is a five stage process. The stages in this process are feasibility study, project knowledge base, earned value analysis, project portfolio analysis, project management plan.
-
 69118767 style essentials 2 financials 5 piece powerpoint presentation diagram infographic slide
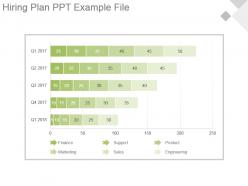
Presenting hiring plan ppt example file. Presenting hiring plan ppt example file. Presenting hiring plan ppt example file. This is a hiring plan ppt example file. This is five stage process. The stages in this process are finance, support, product, marketing, sales, engineering.
-
 48038489 style essentials 2 financials 5 piece powerpoint presentation diagram infographic slide
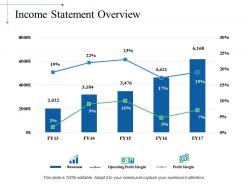
Presenting this set of slides with name - Income Statement Overview Ppt Slide Themes. This is a five stage process. The stages in this process are Business, Marketing, Finance, Planning, Analysis.
-
 51502578 style essentials 2 financials 5 piece powerpoint presentation diagram infographic slide
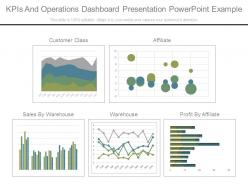
Presenting kpi tracking ppt diagram powerpoint graphics. This is a kpi tracking ppt diagram powerpoint graphics. This is a five stage process. The stages in this process are customer class, affiliate, sales by warehouse, warehouse, profit by affiliate.
-
 90914237 style essentials 2 financials 5 piece powerpoint presentation diagram template slide
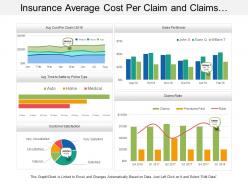
Presenting this set of slides with name - Insurance Average Cost Per Claim And Claims Ratio Dashboard. This is a five stage process. The stages in this process are Assurance, Surety, Insurance.
-
 61361646 style essentials 2 financials 5 piece powerpoint presentation diagram infographic slide
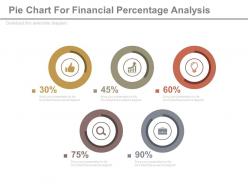
Presenting five pie charts for financial percentage analysis powerpoint slides. This Power Point template slide has been crafted with graphic of five pie charts. This PPT slide contains the concept of financial percentage analysis. Use this PPT slide for business and finance related presentations.
-
 Factors Affecting Organisational Finance Structure
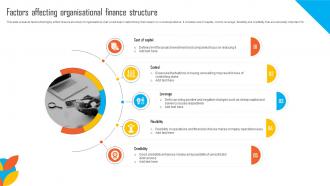
This slide presents factors that highly affect finance structure of organisations, that would help in determining their impact on overall operations. It includes cost of capital, control, leverage, flexibility and credibility that are extremely important for Introducing our premium set of slides with Factors Affecting Organisational Finance Structure. Ellicudate the five stages and present information using this PPT slide. This is a completely adaptable PowerPoint template design that can be used to interpret topics like Cost Of Capital, Control, Leverage, Flexibility, Credibility. So download instantly and tailor it with your information.
-
 90381149 style essentials 2 financials 5 piece powerpoint presentation diagram infographic slide
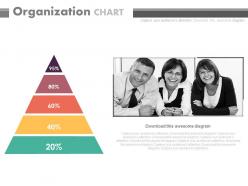
Presenting triangle with percentage organization chart powerpoint slides. This Power Point template slide has been crafted with graphic of triangle and percentage..This PPT slide contains the concept of financial data analysis. Use this PPT slide for business and finance related presentations.
-
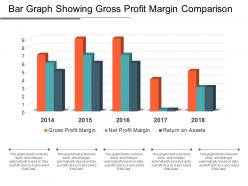 71673735 style essentials 2 financials 5 piece powerpoint presentation diagram infographic slide
Presenting bar graph showing gross profit margin comparison. This is a bar graph showing gross profit margin comparison. This is a five stage process. The stages in this process are gross profit, gross benefit, gross margin.
-
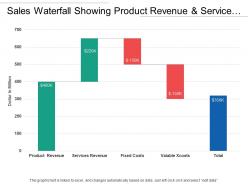 83723185 style essentials 2 financials 5 piece powerpoint presentation diagram infographic slide
Presenting this set of slides with name - Sales Waterfall Showing Product Revenue And Service Revenue. This is a five stage process. The stages in this process are Sales Waterfall, Waterfall Chart.
-
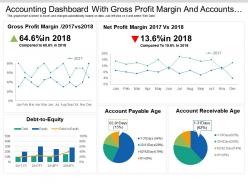 75805140 style essentials 2 financials 5 piece powerpoint presentation diagram infographic slide
Offering accounting dashboard with gross profit margin and account payable PPT slideshow. Makes the information clear in the mind of the audience. Editable visuals, colors and charts. Easy to edit and customize as per your needs. Beneficial for industry professionals, technologists, managers, executives, researchers, sales people, etc. Flexible presentation designs can be presented in standard and widescreen view. Has a futuristic and realistic approach. Easy to download and save. Highly beneficial PowerPoint Slide for highlighting financial data.
-
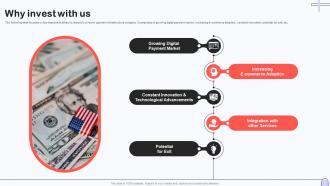 Why Invest With Us Investor Capital Pitch Deck For Secure Digital Payment Platform
The following slide focuses on key reasons to attract investors to invest in payment infrastructure company. It comprises of growing digital payment market, increasing e-commerce adoption, constant innovation, potential for exit, etc. Introducing Why Invest With Us Investor Capital Pitch Deck For Secure Digital Payment Platform to increase your presentation threshold. Encompassed with five stages, this template is a great option to educate and entice your audience. Dispence information on E Commerce Adoption, Services, Technological Advancements, using this template. Grab it now to reap its full benefits.
-
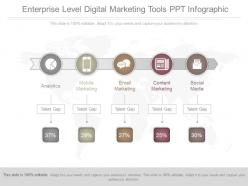 68967632 style essentials 2 financials 5 piece powerpoint presentation diagram infographic slide
Presenting see enterprise level digital marketing tools ppt infographic. This is a enterprise level digital marketing tools ppt infographic. This is five stage process. The stages in this proces are analytics, mobile marketing, email marketing, content marketing, social media.
-
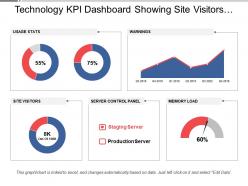 95233504 style essentials 2 financials 5 piece powerpoint presentation diagram infographic slide
Showcasing technology KPI dashboard presentation slide that comes with editing options. PowerPoint design can be downloaded with different nodes and stages. Completely modifiable design as fonts, text, colors can be edited. Customize the presentation by adding trade information i.e. name, logo, icon and tagline. Simple and fast download. Easy convert into PDF or JPG formats. Works well with Google slides. PPT template is easy to share among large set of audience.
-
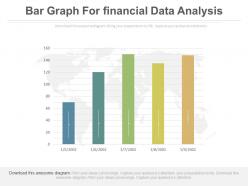 81803474 style essentials 2 financials 5 piece powerpoint presentation diagram infographic slide
Presenting five staged bar graph for financial data analysis powerpoint slides. This Power Point template slide has been crafted with graphic of five staged bar graph. This PPT slide contains the concept of financial data analysis. Use this PPT slide for business and finance related presentations.
-
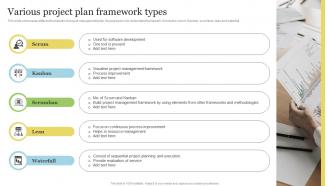 Various Project Plan Framework Types
This slide showcases different framework of project management plan. Its purposes is to understand framework. It includes scrum, Kanban, scrumban, lean and waterfall. Introducing our premium set of slides with Various Project Plan Framework Types. Ellicudate the five stages and present information using this PPT slide. This is a completely adaptable PowerPoint template design that can be used to interpret topics like Scrum, Kanban, Scrumban. So download instantly and tailor it with your information.
-
 83042872 style essentials 2 financials 5 piece powerpoint presentation diagram infographic slide
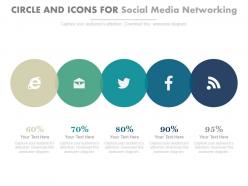
Presenting five circles and icons for social media networking powerpoint slides. This Power Point template diagram with graphic of five circles and icons. This PPT diagram contains the concept of social media networking. Use this PPT diagram for business and internet related presentations.
-
 43822914 style division pie 5 piece powerpoint presentation diagram infographic slide
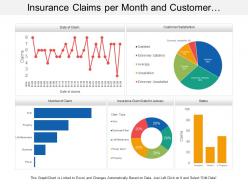
Presenting this set of slides with name - Insurance Claims Per Month And Customer Satisfaction Dashboard. This is a five stage process. The stages in this process are Assurance, Surety, Insurance.
-
 Effective Project Management Budgeting Methods
This slide shows various budgeting methods which helps organization determine its priorities for project selection .It provides details for methods such as analogous estimation, parametric estimation, top down method, three point estimate and earned value analysis. Introducing our premium set of slides with Effective Project Management Budgeting Methods. Ellicudate the five stages and present information using this PPT slide. This is a completely adaptable PowerPoint template design that can be used to interpret topics like Analogous Estimation, Parametric Estimation, Top Down Method. So download instantly and tailor it with your information.
-
 9699683 style concepts 1 growth 5 piece powerpoint presentation diagram infographic slide
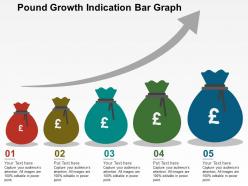
We are proud to present our pound growth indication bar graph flat powerpoint design. Concept of growth indication has been displayed in this power point template diagram. This PPT diagram contains the graphic of bar graph and pound. Use this PPT diagram for business and finance related presentations.
-
 50918705 style essentials 2 financials 5 piece powerpoint presentation diagram infographic slide
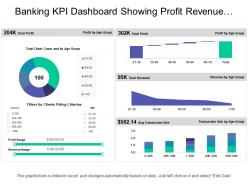
Presenting this set of slides with name - Banking Kpi Dashboard Showing Profit Revenue Transaction Size. This is a five stage process. The stages in this process are Banking, Finance, Money.
-
 Marketing Campaign Lifecycle Management Strategy
The following slide showcases management strategy for campaign lifecycle to track business performance. It includes strategies such as automation, recognize target audience, personalize experience, offer self-services, proactive customer service etc. Introducing our premium set of slides with Marketing Campaign Lifecycle Management Strategy. Ellicudate the five stages and present information using this PPT slide. This is a completely adaptable PowerPoint template design that can be used to interpret topics like Recognize Target Audience, Proactive Customer Service, Personalize Experience. So download instantly and tailor it with your information.
-
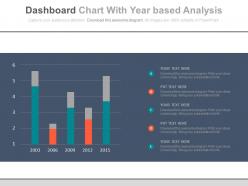 474095 style essentials 2 financials 5 piece powerpoint presentation diagram infographic slide
Presenting dashboard chart with year based analysis powerpoint slides. This Power Point template slide has been crafted with graphic of dashboard chart. This PPT slide contains the concept of year based analysis. Use this PPT slide for business and finance related presentations.
-
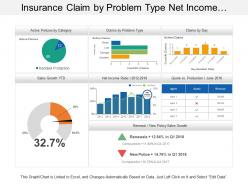 42309004 style essentials 2 financials 5 piece powerpoint presentation diagram infographic slide
Presenting this set of slides with name - Insurance Claim By Problem Type Net Income Ratio Dashboard. This is a five stage process. The stages in this process are Assurance, Surety, Insurance.
-
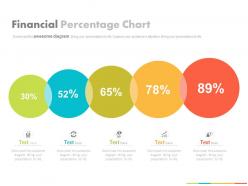 98855187 style essentials 2 financials 5 piece powerpoint presentation diagram infographic slide
Presenting five staged financial percentage chart powerpoint slides. This Power Point template slide has been crafted with graphic of five staged percentage chart. This PPT slide contains the concept of financial analysis. Use this PPT slide for business and finance related presentations.
-
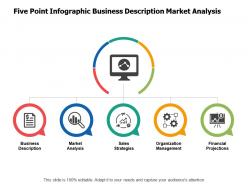 97728537 style essentials 2 financials 5 piece powerpoint presentation diagram infographic slide
Presenting this set of slides with name - Five Point Infographic Business Description Market Analysis. This is a five stages proces. The stages in this process are 7 Point Infographic, 7 Steps Infographic, 7 Stages Infographic.
-
 17408097 style essentials 2 financials 5 piece powerpoint presentation diagram infographic slide
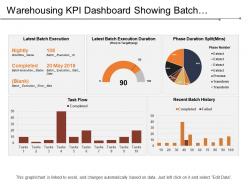
Showing, warehousing KPI dashboard PowerPoint Presentation Slide. This Presentation has been designed professionally and is fully editable. You can customize the font size, font type, colors, and even the background. This Template is disciplinary with Google Slide and can be saved in JPG or PDF format without any fuss created. Fast download at the click of the button.
-
 68058280 style essentials 2 financials 5 piece powerpoint presentation diagram infographic slide
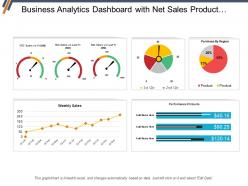
This is a five stage process. The stages in this process are Business Analytics, BA, Organizations Data.
-
 Principles Of Strategic Private Wealth Management
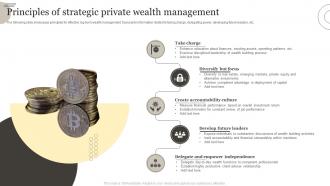
The following slide showcases principles for effective log term wealth management. It presents information related to taking charge, delegating power, developing future leaders, etc. Introducing our premium set of slides with name Principles Of Strategic Private Wealth Management. Ellicudate the five stages and present information using this PPT slide. This is a completely adaptable PowerPoint template design that can be used to interpret topics like Take Charge, Diversify But Focus, Develop Future Leaders. So download instantly and tailor it with your information.
-
 43503150 style essentials 2 financials 5 piece powerpoint presentation diagram infographic slide
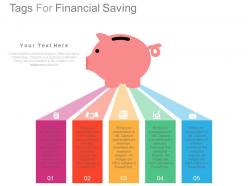
Presenting view five staged tags for financial saving flat powerpoint design. This Power Point template diagram has been crafted with graphic of five staged tags diagram. This PPT diagram contains the concept of financial saving representation. Use this PPT diagram for business and finance related presentations.
-
 85949376 style essentials 1 roadmap 5 piece powerpoint presentation diagram infographic slide
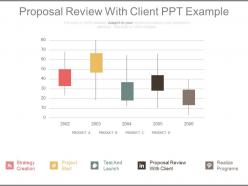
Presenting proposal review with client ppt example. This is a proposal review with client ppt example. This is a five stage process. The stages in this process are finance, business, management.
-
 Spa Business Plan Statistics Associated With US Spa Industry BP SS
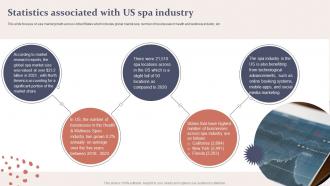
This slide focuses on spa market growth across United States which includes global market size, number of businesses in health and wellness industry, etc. Increase audience engagement and knowledge by dispensing information using Spa Business Plan Statistics Associated With US Spa Industry BP SS. This template helps you present information on five stages. You can also present information on According Market, Spa Industry, Online Booking Systems using this PPT design. This layout is completely editable so personaize it now to meet your audiences expectations.
-
 78071593 style essentials 2 financials 5 piece powerpoint presentation diagram infographic slide
Presenting this set of slides with name - Revenue Bridge Example Of Ppt Slide. This is a five stage process. The stages in this process are Revenue Bridge, Income Bridge, Earnings Bridge.
-
 54336500 style essentials 2 financials 5 piece powerpoint presentation diagram infographic slide
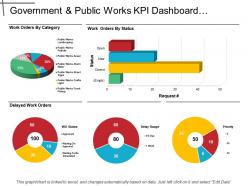
Presenting the KPI dashboard presentation layout. This dashboard template is completely customizable and is professionally designed. You can modify the objects in the template like font color and font size without going through any fuss. This presentation slide is fully compatible with Google Slide and can be saved in JPG or PDF file format without any hassle. Fast download this at the click of the button.
-
 95819463 style essentials 2 financials 5 piece powerpoint presentation diagram infographic slide
Presenting arrow upward and downward with percentage chart powerpoint slides. This Power Point template diagram has been crafted with graphic of arrow in upward and downward directions with percentage chart diagram. This PPT diagram contains the concept of financial process flow. Use this PPT diagram for business and finance related presentations.
-
 15077766 style essentials 2 financials 5 piece powerpoint presentation diagram infographic slide
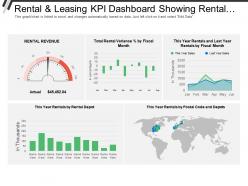
Presenting this set of slides with name - Rental And Leasing Kpi Dashboard Showing Rental Revenue And Rental Variance Percentage. This is a five stage process. The stages in this process are Rental And Leasing, Dealing And Leasing, Rental And Engage.
-
 65460165 style concepts 1 growth 5 piece powerpoint presentation diagram infographic slide
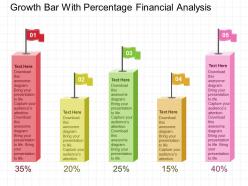
We are proud to present our growth bar with percentage financial analysis flat powerpoint design. This power point template diagram has been designed with graphic of growth bar and percentage symbols. This PPT diagram contains the concept of financial analysis. Use this PPT diagram for business and finance related presentations.
-
 58914253 style essentials 2 financials 5 piece powerpoint presentation diagram infographic slide
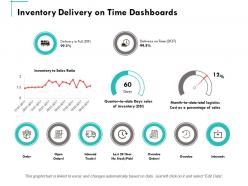
Presenting this set of slides with name - Inventory Delivery On Time Dashboards Ppt Powerpoint Presentation Summary Clipart. This is a five stages process. The stages in this process are Finance, Marketing, Management, Investment, Analysis.
-
 Steps To Reduce Ticket Resolution Time
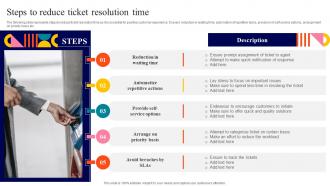
The following slide represents steps to reduce ticket resolution time as it is essential for positive customer experience. It covers reduction in waiting time, automation of repetitive tasks, provision of self service options, arrangement on priority basis etc. Presenting our set of slides with Steps To Reduce Ticket Resolution Time. This exhibits information on five stages of the process. This is an easy to edit and innovatively designed PowerPoint template. So download immediately and highlight information on Automatize Repetitive Actions, Arrange On Priority Basis, Provide Self Service Options.
-
 Top Sources Of Big Data Collection Big Data And Its Types Ppt Slises Master Slide
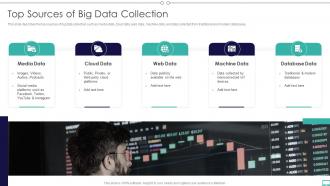
This slide describes the top sources of big data collection such as media data, cloud data, web data, machine data, and data collected from traditional and modern databases. Increase audience engagement and knowledge by dispensing information using Top Sources Of Big Data Collection Big Data And Its Types Ppt Slises Master Slide. This template helps you present information on five stages. You can also present information on Media Data, Cloud Data, Web Data, Machine Data using this PPT design. This layout is completely editable so personaize it now to meet your audiences expectations.
-
 99929695 style essentials 2 financials 5 piece powerpoint presentation diagram infographic slide
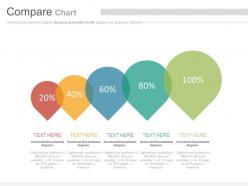
Presenting linear sequential compare chart with percentage powerpoint slides. This Power Point template diagram slide has been crafted with graphic of linear sequential chart and percentage diagram. This PPT diagram contains the concept of data comparison analysis representation. Use this PPT diagram for business and finance related presentations.
-
 97501391 style essentials 2 financials 5 piece powerpoint presentation diagram infographic slide
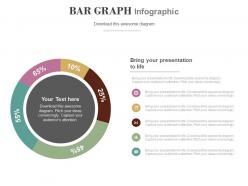
Presenting circle bar graph with percentage analysis powerpoint slides. This Power Point template slide has been crafted with graphic of circle bar graph and percentage icons. This PPT slide contains the concept of financial analysis. Use this PPT slide for business and marketing related presentations.
-
 46197723 style concepts 1 decline 5 piece powerpoint presentation diagram infographic slide
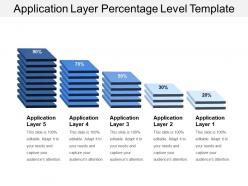
Presenting this set of slides with name - Application Layer Percentage Level Template. This is a five stage process. The stages in this process are Application Layer, Session Layer, Osi Model.
-
 Cost reduction program for business service outsourcing
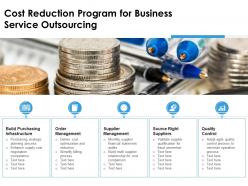
Presenting our set of slides with Cost Reduction Program For Business Service Outsourcing. This exhibits information on five stages of the process. This is an easy to edit and innovatively designed PowerPoint template. So download immediately and highlight information on Build Purchasing Infrastructure, Order Management, Supplier Management, Source Right Suppliers, Quality Control.
-
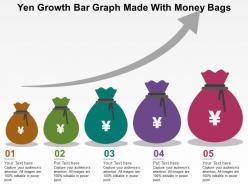 12356092 style concepts 1 growth 5 piece powerpoint presentation diagram infographic slide
We are proud to present our yen growth bar graph made with money bags flat powerpoint design. This power point template diagram has been crafted with graphic of yen and money bag. This PPT diagram contains the concept of money growth. Use this PPT diagram for finance and marketing related presentations.
-
 47162709 style essentials 2 financials 5 piece powerpoint presentation diagram infographic slide
Presenting revenue model ppt example file. This is a revenue model ppt example file. This is five stage process. The stages in this process are business, currency, finance, strategy, icons, success, investment.
-
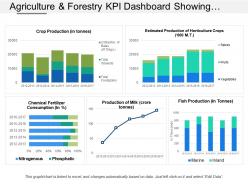 11221745 style essentials 2 financials 5 piece powerpoint presentation diagram infographic slide
Displaying agriculture and forestry KPI dashboard showing crop production and chemical fertilizers consumptions presentation slide. Modify the design with trademark and picture. PowerPoint diagram is well-matched with Google slides. Colors and text can be amended as the PPT graphic comes with easy to use editing options. Presentation design can be delivered in both standard and widescreen display view. Flexible with other software options such as PDF or JPG formats as can be converted effortlessly.
-
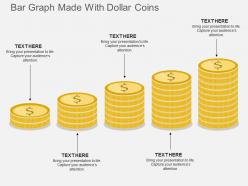 26423518 style concepts 1 growth 5 piece powerpoint presentation diagram template slide
Presenting ka bar graph made with dollar coins flat powerpoint design. This Power Point template diagram has been crafted with graphic of bar graph made with dollar coins diagram. This PPT diagram contains the concept of financial result analysis .Use this PPT diagram for business and finance related presentations.


