Customer Experience Dashboard Snapshot Created Through Survey Results
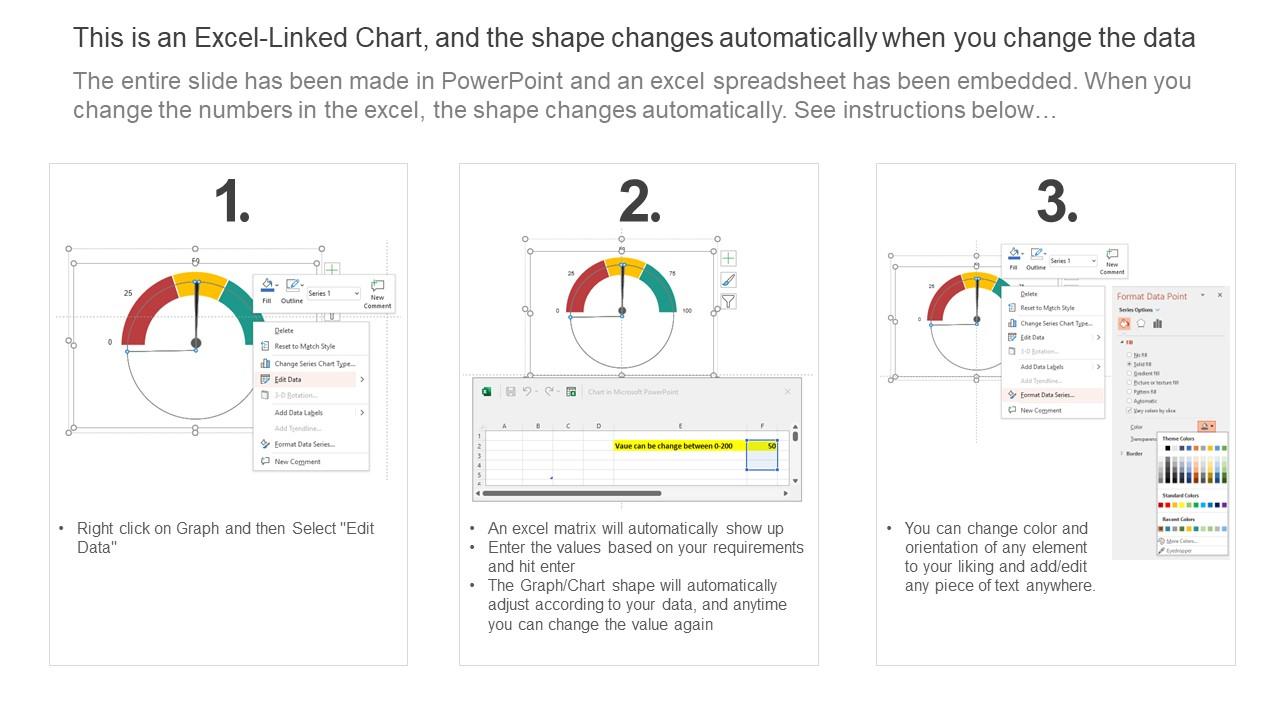
This graph or chart is linked to excel, and changes automatically based on data. Just left click on it and select Edit Data.
This graph or chart is linked to excel, and changes automatically based on data. Just left click on it and select Edit Data.
- Google Slides is a new FREE Presentation software from Google.
- All our content is 100% compatible with Google Slides.
- Just download our designs, and upload them to Google Slides and they will work automatically.
- Amaze your audience with SlideTeam and Google Slides.
-
Want Changes to This PPT Slide? Check out our Presentation Design Services
- WideScreen Aspect ratio is becoming a very popular format. When you download this product, the downloaded ZIP will contain this product in both standard and widescreen format.
-

- Some older products that we have may only be in standard format, but they can easily be converted to widescreen.
- To do this, please open the SlideTeam product in Powerpoint, and go to
- Design ( On the top bar) -> Page Setup -> and select "On-screen Show (16:9)” in the drop down for "Slides Sized for".
- The slide or theme will change to widescreen, and all graphics will adjust automatically. You can similarly convert our content to any other desired screen aspect ratio.
Compatible With Google Slides

Get This In WideScreen
You must be logged in to download this presentation.
PowerPoint presentation slides
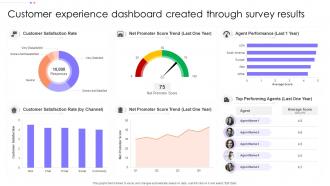
This graph or chart is linked to excel, and changes automatically based on data. Just left click on it and select Edit Data. Introducing our Customer Experience Dashboard Snapshot Created Through Survey Results set of slides. The topics discussed in these slides are Customer Satisfaction Rate, Agent Performance, Net Promoter, Score Trend. This is an immediately available PowerPoint presentation that can be conveniently customized. Download it and convince your audience.
People who downloaded this PowerPoint presentation also viewed the following :
Customer Experience Dashboard Snapshot Created Through Survey Results with all 7 slides:
Use our Customer Experience Dashboard Snapshot Created Through Survey Results to effectively help you save your valuable time. They are readymade to fit into any presentation structure.
-
Best way of representation of the topic.
-
I was able to find the right choice of PPT template for my thesis with SlideTeam. Thank you for existing.


