Dashboard For Tracking Supplier Performance And Procurement Cycle

Rating:
80%
Dashboard For Tracking Supplier Performance And Procurement Cycle Dashboard For Tracking Supplier Performance And Procurement Cycle
Slide 1 of 7
Favourites Favourites

Try Before you Buy Download Free Sample Product

Audience Impress Your
Audience
Editable 100%
Editable
Time Save Hours
of Time
The Biggest Sale is ending soon in
0
0
:
0
0
:
0
0
Rating:
80%
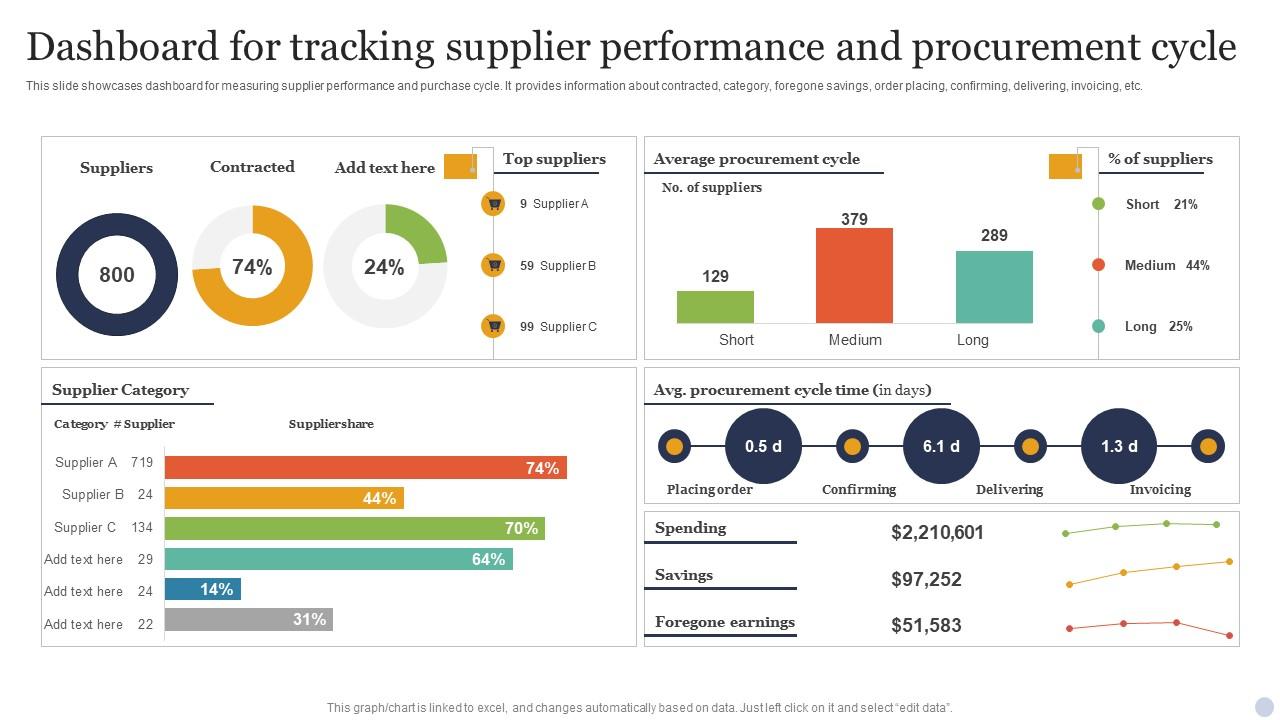
This slide showcases dashboard for measuring supplier performance and purchase cycle. It provides information about contracted, category, foregone savings, order placing, confirming, delivering, invoicing, etc. Presenting our well structured Dashboard For Tracking Supplier Performance And Procurement Cycle. The topics discussed in this slide are Supplier Category, Procurement Cycle Time, Average Procurement. This is an instantly available PowerPoint presentation that can be edited conveniently. Download it right away and captivate your audience.

FAQs for Dashboard For Tracking Supplier Performance

**INPUT**: What key performance indicators (KPIs) should be included in a supplier performance dashboard? **OUTPUT**: Supplier performance dashboards should include delivery timeliness, quality ratings, cost compliance, supplier responsiveness, and risk assessment scores. These KPIs enable procurement teams to streamline vendor relationships, identify performance gaps, and optimize supply chain efficiency, with manufacturing and retail organizations finding that comprehensive tracking ultimately delivers better supplier partnerships and reduced operational costs.

A supplier performance dashboard helps reduce supply chain risks by providing real-time visibility into supplier reliability, quality metrics, delivery performance, and compliance status. Through automated monitoring and predictive analytics, organizations can identify potential disruptions early, diversify supplier relationships proactively, and maintain contingency plans, ultimately delivering greater supply chain resilience and operational continuity.

Effective supplier performance visualizations include scorecards with KPI metrics, heat maps showing performance across categories, trend line charts for delivery times and quality scores, and comparative bar charts ranking suppliers. These visual formats enhance decision-making by highlighting underperforming vendors, tracking improvement patterns, and enabling quick comparisons, with many procurement teams finding that dashboard combinations streamline vendor management and accelerate strategic sourcing decisions.

Supplier performance data should be updated in real-time or daily for critical metrics like delivery status and quality issues, while comprehensive performance reviews can be updated weekly or monthly. This strategic combination enables procurement teams to respond quickly to immediate concerns, track long-term trends effectively, and maintain strong supplier relationships through consistent monitoring and timely interventions.

**INPUT**: What software tools are commonly used to create supplier performance dashboards? **OUTPUT**: Supplier performance dashboards are commonly built using Microsoft Power BI, Tableau, SAP Analytics Cloud, Oracle Business Intelligence, and specialized procurement platforms like Ariba or Coupa. These tools streamline vendor monitoring by integrating real-time data, automating performance tracking, and delivering comprehensive analytics, with many organizations finding that strategic dashboard implementation enhances supplier relationships while reducing procurement costs. [Word count: 58 words]

Supplier performance dashboards facilitate better decision-making by providing real-time visibility into key metrics like delivery times, quality scores, cost efficiency, and compliance rates in centralized, actionable formats. Through automated data visualization and trend analysis, procurement teams can quickly identify underperforming vendors, negotiate strategic partnerships, and optimize supply chain operations, ultimately delivering reduced costs and enhanced operational efficiency.

**INPUT**: What are some best practices for designing an effective supplier performance dashboard? **OUTPUT**: Best practices include defining clear KPIs aligned with business objectives, incorporating real-time data visualization, ensuring mobile accessibility, and implementing automated alerts for performance deviations. These dashboards streamline procurement decisions by providing comprehensive supplier scorecards, trend analysis, and predictive insights, with many organizations finding that strategic dashboard design ultimately delivers enhanced supplier relationships and reduced operational risks. [Word count: 58 words]

Measuring data accuracy in supplier performance dashboards involves implementing data validation rules, cross-referencing multiple source systems, conducting regular audits against original documentation, and establishing automated verification processes. Organizations typically achieve 95%+ accuracy by combining real-time data reconciliation with periodic manual verification, while advanced analytics help identify anomalies and inconsistencies, ultimately delivering reliable insights for strategic supplier decisions.

User feedback plays a crucial role in enhancing supplier performance dashboards by identifying missing metrics, improving interface usability, and ensuring data relevance for decision-making. Through regular feedback collection, organizations can streamline dashboard functionality, enhance reporting accuracy, and ultimately deliver better procurement outcomes, with many companies finding that user-driven improvements significantly boost adoption rates and strategic value.

Organizations ensure data integrity by implementing automated data collection systems, establishing standardized measurement criteria, conducting regular audits, and integrating real-time validation protocols across supplier touchpoints. These approaches streamline accuracy by minimizing manual errors, creating consistent benchmarks, and enabling immediate correction of discrepancies, with many procurement teams finding that automated systems ultimately deliver more reliable performance insights and stronger supplier relationships.

Strategies include establishing KPIs that directly reflect business goals, implementing balanced scorecards with quality, cost, and delivery metrics, creating weighted performance indices, and developing collaborative improvement programs. Through these approaches, organizations streamline procurement decisions, enhance supply chain transparency, and drive supplier accountability, with many companies finding that aligned metrics ultimately deliver improved operational efficiency and stronger competitive advantage.

Dashboards can be customized through role-based access controls, personalized KPI selections, adjustable visualization formats, and stakeholder-specific data filters tailored to individual responsibilities and decision-making needs. Procurement managers focus on cost metrics and delivery performance, while executives prioritize strategic supplier relationships and risk indicators, ultimately enabling each stakeholder to access relevant insights that enhance operational efficiency and drive informed decisions.

Common challenges include data integration from multiple supplier systems, establishing consistent performance metrics across diverse suppliers, ensuring data accuracy and real-time updates, and achieving user adoption across procurement teams. Organizations often struggle with standardizing supplier reporting formats, managing data silos, and balancing comprehensive tracking with system complexity, with many finding that phased implementation and stakeholder training ultimately deliver better outcomes and sustained usage.

Industry standards influence supplier performance dashboard design by establishing key performance indicators, data collection protocols, compliance requirements, and benchmarking frameworks that ensure consistency and regulatory adherence. These standards, particularly in sectors like automotive, healthcare, and manufacturing, enable organizations to streamline vendor evaluations, enhance supply chain transparency, and deliver competitive advantage through standardized metrics and reporting structures.

Integrating real-time data into supplier performance dashboards enables immediate issue identification, proactive risk management, enhanced supplier collaboration, improved decision-making speed, and dynamic performance tracking. Through live monitoring capabilities, organizations streamline procurement processes, reduce supply chain disruptions, and strengthen vendor relationships, with many manufacturing and retail companies finding that real-time insights deliver significant competitive advantages.

Ratings and Reviews

80% of 100
Review Form
Write a review
Most Relevant Reviews
  1. 80%

    by Denver Fox

    Much better than the original! Thanks for the quick turnaround.
  2. 80%

    by Don Hansen

    Great designs, really helpful.

2 Item(s)

per page: