- Sub Categories
-
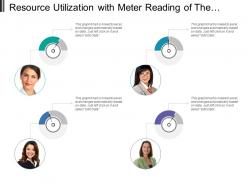 Resource utilization with meter reading of the each person
Presenting this set of slides with name - Resource Utilization With Meter Reading Of The Each Person. This is a four stage process. The stages in this process are Resource Management, Resource Utilization, Resource Allocation.
-
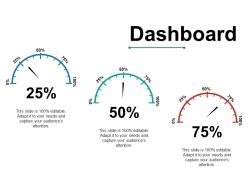 Dashboard snapshot ppt visual aids icon
Presenting this set of slides with name - Dashboard Snapshot Ppt Visual Aids Icon. This is a three stage process. The stages in this process are Business, Marketing, Dashboard, Percentage.
-
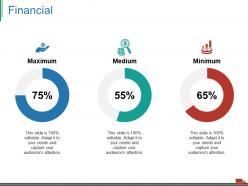 Financial ppt visual aids files
Presenting this set of slides with name - Financial Ppt Visual Aids Files. This is a three stage process. The stages in this process are Business, Marketing, Percentage, Maximum, Medium, Minimum, Financial.
-
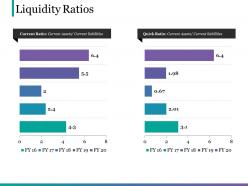 Liquidity ratios ppt slide
Presenting this set of slides with name - Liquidity Ratios Ppt Slide. This is a two stage process. The stages in this process are Business, Marketing, Finance, Graph.
-
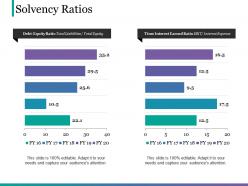 Solvency ratios ppt background
Presenting this set of slides with name - Solvency Ratios Ppt Background. This is a two stage process. The stages in this process are Business, Marketing, Graph, Strategy, Finance.
-
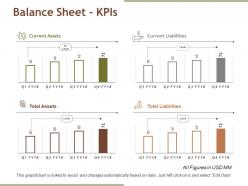 Balance sheet kpis powerpoint slide background image
Presenting this set of slides with name - Balance Sheet Kpis Powerpoint Slide Background Image. This is a four stage process. The stages in this process are Current Assets, Current Liabilities, Total Assets, Total Liabilities.
-
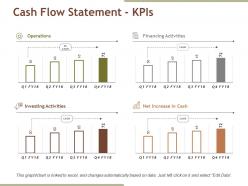 Cash flow statement kpis powerpoint slide deck samples
Presenting this set of slides with name - Cash Flow Statement Kpis Powerpoint Slide Deck Samples. This is a four stage process. The stages in this process are Operations, Financing Activities, Investing Activities, Net Increase In Cash.
-
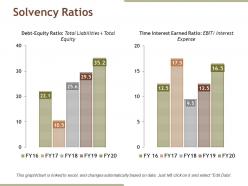 Solvency ratios powerpoint guide
Presenting this set of slides with name - Solvency Ratios Powerpoint Guide. This is a two stage process. The stages in this process are Bar, Business, Marketing, Strategy, Planning.
-
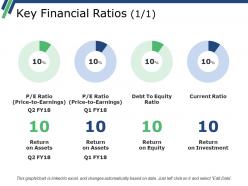 Key financial ratios template 1 powerpoint slide background designs
Presenting this set of slides with name - Key Financial Ratios Template 1 Powerpoint Slide Background Designs. This is a four stage process. The stages in this process are Business, Donut Chart, Finance, Marketing, Strategy, Analysis.
-
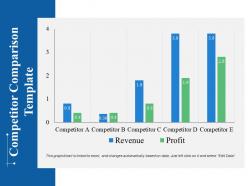 Competitor comparison powerpoint slide deck samples
Presenting this set of slides with name - Competitor Comparison Powerpoint Slide Deck Samples. This is a five stage process. The stages in this process are Business, Marketing, Finance, Planning, Analysis.
-
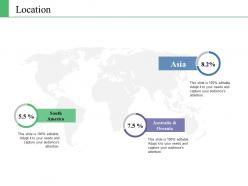 Location ppt file slides
Presenting this set of slides with name - Location Ppt File Slides. This is a three stage process. The stages in this process are Asia, South America, Australia And Oceania, Location, Geographical.
-
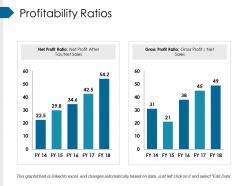 Profitability ratios powerpoint slide deck
Presenting this set of slides with name - Profitability Ratios Powerpoint Slide Deck. This is a two stage process. The stages in this process are Business, Marketing, Finance, Net Profit Ratio, Gross Profit Ratio.
-
 Balance sheet kpis ppt designs download
Presenting this set of slides with name - Balance Sheet Kpis Ppt Designs Download. This is a four stage process. The stages in this process are Current Assets, Current Liabilities, Operating Profit, Total Liabilities.
-
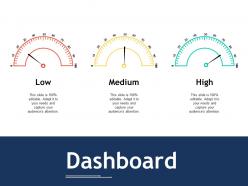 Dashboard snapshot ppt outline graphics
Presenting this set of slides with name - Dashboard Snapshot Ppt Outline Graphics. This is a three stage process. The stages in this process are Low, Medium, High.
-
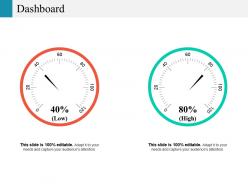 Dashboard snapshot ppt model example introduction
Presenting this set of slides with name - Dashboard Snapshot Ppt Model Example Introduction. This is a two stage process. The stages in this process are Low, Medium, High, Dashboard, Measurement.
-
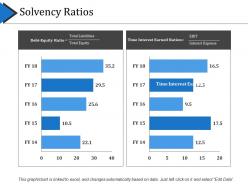 Solvency ratios powerpoint slides templates
Presenting this set of slides with name - Solvency Ratios Powerpoint Slides Templates. This is a two stage process. The stages in this process are Business, Marketing, Debt Equity Rat, Time Interest Earned Ration, Finance.
-
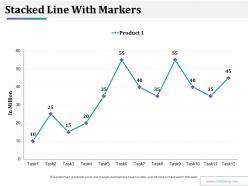 Stacked line with markers ppt styles tips
Presenting this set of slides with name - Stacked Line With Markers Ppt Styles Tips. This is a one stage process. The stages in this process are Product, In Million, Task.
-
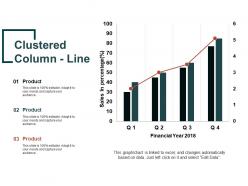 Clustered column line powerpoint slide influencers
Presenting this set of slides with name - Clustered Column Line Powerpoint Slide Influencers. This is a three stage process. The stages in this process are Clustered Column Line, Finance, Analysis, Business, Marketing.
-
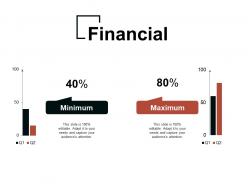 Financial powerpoint graphics
Presenting this set of slides with name - Financial Powerpoint Graphics. This is a two stage process. The stages in this process are Financial, Minimum, Maximum, Marketing, Strategy, Business.
-
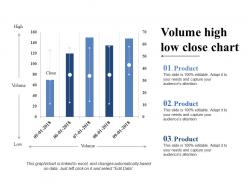 Volume high low close chart powerpoint guide
Presenting volume high low close chart PowerPoint guide PPT slide. The open high low close chart PowerPoint template designed professionally by the team of SlideTeam to present the variation in the price. The bar chart and text placeholder in the on- balance volume presentation slide is customizable in PowerPoint. A user can do changes in price movement as the volume chart excel template get linked with Excel sheet and it is also compatible with Google Slide. A user can edit the font size, font type, color and dimensions of the high low close graph PowerPoint slide.
-
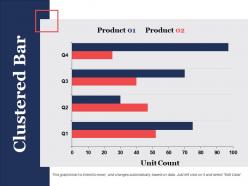 Clustered bar ppt visual aids professional
Presenting clustered bar PPT visual aids professional PPT slide. The visualize clustered presentations slide designed by the professionals of SlideTeam for discussing statistics and inventory. The clustered bar chart excel PPT slide get edited as a user can link this slide with the Excel Sheet. The stacked clustered visual aid PPT slide is customizable in PowerPoint. The clustered stacked bar chart PowerPoint slide is also compatible with Google Slide. A user can make changes such as font size, font type, color and dimensions in the horizontal cluster bar PPT slide to discuss quantitative data.
-
 Area chart ppt slides clipart images
Presenting this set of slides with name - Area Chart Ppt Slides Clipart Images. This is a two stage process. The stages in this process are Area Chart, Marketing, Strategy, Planning, Finance.
-
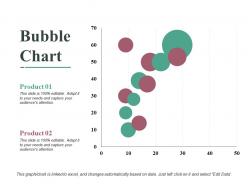 Bubble chart ppt slides demonstration
Presenting this set of slides with name - Bubble Chart Ppt Slides Demonstration. This is a two stage process. The stages in this process are Bubble Chart, Marketing, Strategy, Planning, Finance.
-
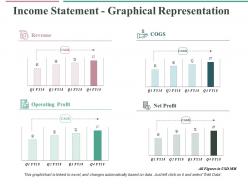 Income statement graphical representation ppt professional graphics design
Presenting this set of slides with name - Income Statement Graphical Representation Ppt Professional Graphics Design. This is a four stage process. The stages in this process are Bar Chart, Marketing, Strategy, Planning, Finance.
-
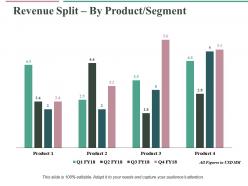 Revenue split by product segment ppt professional vector
Presenting this set of slides with name - Revenue Split By Product Segment Ppt Professional Vector. This is a four stage process. The stages in this process are Bar Chart, Marketing, Strategy, Planning, Finance.
-
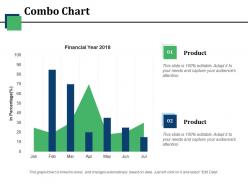 Combo chart ppt pictures
Presenting this set of slides with name - Combo Chart Ppt Pictures. This is a two stage process. The stages in this process are Financial Year, In Percentage, Business, Marketing, Strategy.
-
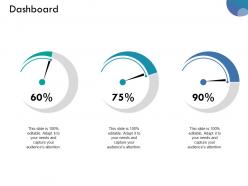 Dashboard snapshot powerpoint slide rules ppt icon
Sharing dashboard PowerPoint slide. Totally adaptable design as works with Google slides. PowerPoint design can be downloaded in standard and widescreen view. Simple to modify as color, text and font are modifiable. PPT diagram can be downloaded with different nodes and stages. Presentation graphic can be downloaded and save into JPG and PDF format. Ideal to use for business messages as pixels don’t break even when you share in widescreen.
-
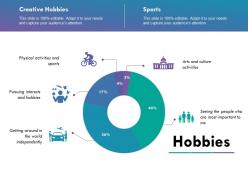 Hobbies ppt slide templates powerpoint shapes
Providing hobbies PPT slide design for your next presentation. PowerPoint graphic can be edited as color, font and text can be amended at any stage and also adapts smoothly into JPG and PDF format. Fully modifiable design with Google slides. Easy to amend and present with large audience as required. Presentation diagram can be shared in standard and widescreen view. High resolution makes sure no pixel break even if shared on large screen.
-
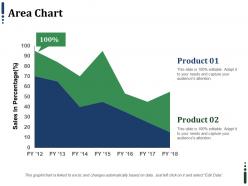 Area chart ppt infographics objects
Presenting the flat mountain design PowerPoint template. This creative PowerPoint template is designed under the strict supervision of professionals and is 100% customizable in PowerPoint. It is easy to edit the objects like font color and font size in this slide and save it in JPG or PDF file format. This template is fully compatible with Google Slide. Click on the download button to download this PPT template.
-
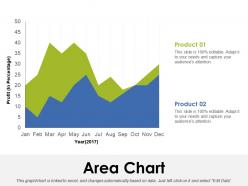 Area chart ppt infographics vector
Presenting the flat mountain design template for PowerPoint. This creative PowerPoint template is designed under the strict supervision of professionals and is 100% editable in PowerPoint. It is easy to edit the objects like font color and font size in this template and save it in JPG or PDF file format. This template is fully compatible with Google Slide. Click on the download tab to download this template.
-
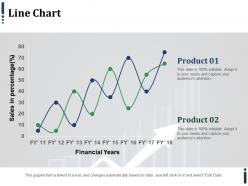 Line chart ppt infographics graphics download
Presenting this set of slides with name - Line Chart Ppt Infographics Graphics Download. This is a two stage process. The stages in this process are Line Chart, Marketing, Strategy, Planning, Finance.
-
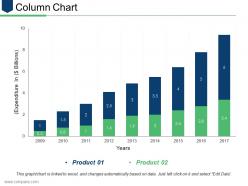 Column chart ppt infographic template graphics design
Grab an opportunity to see, column chart PowerPoint Presentation Slide. This Presentation has been designed under the keen sight of professionals and is fully editable. You can reshape the font size, font type, colors, and even the background. This Template is manageable with Google Slide and can be saved in JPG or PDF format without any nuisance created. Fast download at the click of the button provided below.
-
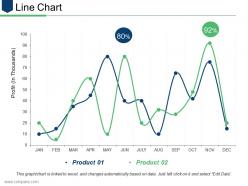 Line chart ppt layouts aids
Get a chance to go through, line chart PowerPoint Presentation Slide. This Presentation has been designed by professionals and is fully editable. You can remodel the font size, font type, colors, and even the background. This Template is attainable with Google Slide and can be saved in JPG or PDF format without any chaos created. Fast download at the click of the button shown below.
-
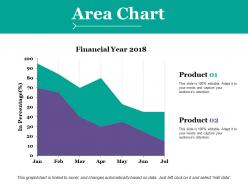 Area chart ppt outline layout
Presenting area chart PPT outline layout. Brilliant picture quality as pixels doesn’t break on both standard and widescreen view. Presentation slide is accepted with Google slides and can be merged as required. PowerPoint design comes with access to modify the content with enterprise details. Similar designs are accessible with different nodes and stages as required. Rapid download and can be delivered into other software formats such as JPG and PDF.
-
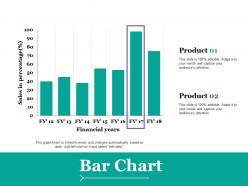 Bar chart ppt summary grid
Showcasing bar chart PPT summary grid. PowerPoint design is easy to deliver among audience. Presentation template can be downloaded with different nodes and stages. Modify the presentation with corporate details example name, logo, icon, image and title. Immediate download with quick saving options at any location of the system. Easy to change into PDF or JPG formats. PPT graphic merge well with Google Slides and can be shared accordingly.
-
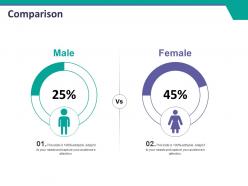 Comparison ppt summary background designs
Presenting this set of slides with name - Comparison Ppt Summary Background Designs. This is a two stage process. The stages in this process are Comparison, Male, Female, Strategy, Business.
-
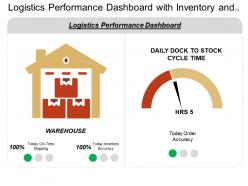 Logistics performance dashboard with inventory and shipping
Presenting Logistics Performance Dashboard With Inventory And Shipping PPT slide. The performance dashboard PowerPoint template designed by the professional team of SlideTeam to present yearly sales, productivity, and profit. The text and image in logistics dashboard slide are customizable in PowerPoint and can help you in sharing the sale target. The logistics performance dashboard slide is compatible with Google Slide which makes easy for a presenter to present his view points about business managing. An individual can do changes in the font size, font type, color and dimensions of the image to present the desired sales value. A user can easily edit the text as well as modify to fit his needs and can add text in the placeholder.
-
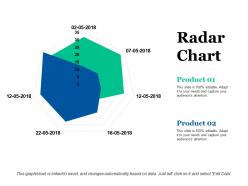 Radar chart ppt visual aids example file
Presenting radar chart PowerPoint template. This PowerPoint presentation template is completely editable and is professionally designed. You can bring changes to the objects in the slide like font color and font size easily. This presentation design is fully compatible with Google Slide and can be saved in JPG or PDF file format easily. Download this fast at the click of a button.
-
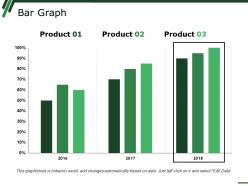 Bar graph ppt visual aids background images
Presenting this set of slides with name - Bar Graph Ppt Visual Aids Background Images. This is a three stage process. The stages in this process are Bar Graph, Finance, Marketing, Strategy, Business.
-
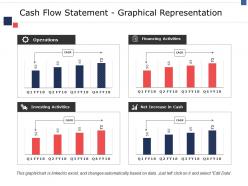 Cash flow statement graphical representation ppt model visual aids
Presenting this set of slides with name - Cash Flow Statement Graphical Representation Ppt Model Visual Aids. This is a four stage process. The stages in this process are Operations, Financing Activities, Investing Activities, Net Increase In Cash.
-
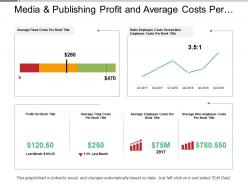 Media and publishing profit and average costs per title dashboard
Presenting this set of slides with name - Media And Publishing Profit And Average Costs Per Title Dashboard. This is a four stage process. The stages in this process are Media And Publishing, Media Communication.
-
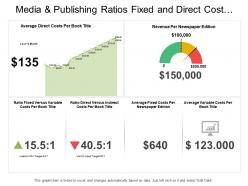 Media and publishing ratios fixed and direct cost dashboard
Presenting this set of slides with name - Media And Publishing Ratios Fixed And Direct Cost Dashboard. This is a two stage process. The stages in this process are Media And Publishing, Media Communication.
-
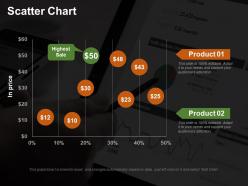 Scatter chart ppt summary background images
Presenting this set of slides with name - Scatter Chart Ppt Summary Background Images. This is a two stage process. The stages in this process are Scatter Chart, Finance, Marketing, Strategy, Analysis, Business.
-
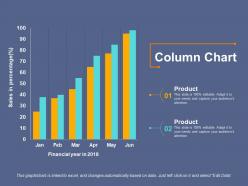 Column chart economic analysis ppt diagram templates
Presenting this set of slides with name - Column Chart Economic Analysis Ppt Diagram Templates. This is two stage process. The stages in this process are Business, Column Chart, Analysis, Investment, Marketing.
-
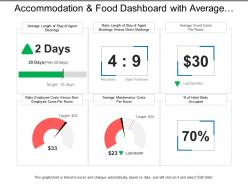 Accommodation and food dashboard with average fixed costs per room
Presenting this set of slides with name - Accommodation And Food Dashboard With Average Fixed Costs Per Room. This is a six stage process. The stages in this process are Accommodation And Food, Shelter And Food, Accommodation And Beverages.
-
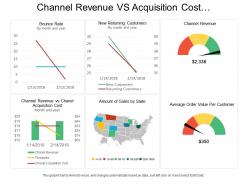 Channel revenue vs acquisition cost e commerce dashboard
Presenting this set of slides with name - Channel Revenue Vs Acquisition Cost E Commerce Dashboard. This is a six stage process. The stages in this process are Mercantilism, Commercialism, Ecommerce.
-
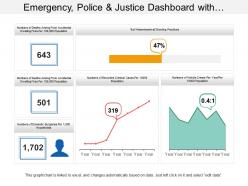 Emergency police and justice dashboard with absenteeism at shooting practice
Presenting this set of slides with name - Emergency Police And Justice Dashboard With Absenteeism At Shooting Practice. This is a four stage process. The stages in this process are Emergency, Police And Justice, Police And Emergency Services, Justice And Public Security.
-
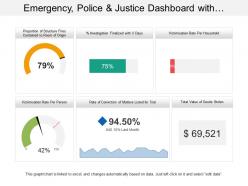 Emergency police and justice dashboard with value of goods stolen
Presenting this set of slides with name - Emergency Police And Justice Dashboard With Value Of Goods Stolen. This is a six stage process. The stages in this process are Emergency, Police And Justice, Police And Emergency Services, Justice And Public Security.
-
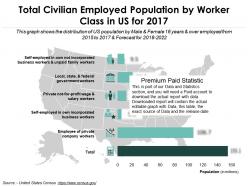 Total civilian employed population by worker class in us for 2017
Total Civilian Employed Population By Worker Class In Us For 2017. This is part of our Data and Statistics products selection, and you will need a Paid account to download the actual report with accurate data. Downloaded report will contain the actual editable graph with the actual data, an excel table with the actual data, the exact source of the data and the release date. This graph shows the distribution of US population by Male and Female 16 years and over employed from 2015 to 2017 and Forecast for 2018-2022. It covers topic Civilian Employed Population by Worker Class for region USA and is for date range 2017. Download it immediately and use it for your business.
-
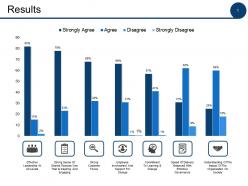 Results ppt powerpoint presentation file designs
This is a seven stages process. The stages in this process are Finance, Marketing, Management, Investment, Analysis.
-
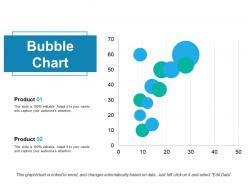 Bubble chart finance ppt powerpoint presentation diagram ppt
This is a two stages process. The stages in this process are Finance, Marketing, Management, Investment, Analysis.
-
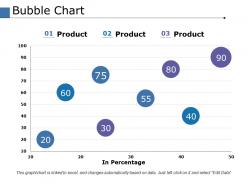 Bubble chart finance ppt powerpoint presentation file guide
This is a three stages process. The stages in this process are Finance, Marketing, Management, Investment, Analysis.
-
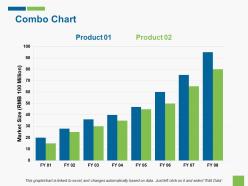 Combo chart financial growth ppt file graphics template
This is a two stage process. The stages in this process are Combo Chart, Finance, Marketing, Strategy, Analysis.
-
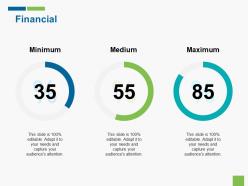 Financial analysis ppt gallery show
This is a three stage process. The stages in this process are Financial, Analysis, Marketing, Strategy, Business.
-
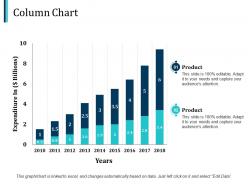 Column chart finance ppt pictures design templates
This is a two stage process. The stages in this process are Finance, Analysis, Business, Investment, Marketing.
-
 Stacked bar finance ppt infographics example introduction
This is a three stage process. The stages in this process are Finance, Analysis, Business, Investment, Marketing.
-
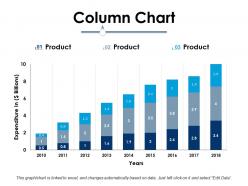 Column chart ppt infographic template backgrounds
This is a three stage process. The stage in this process are Business, Management, Marketing, Sales, Strategy.
-
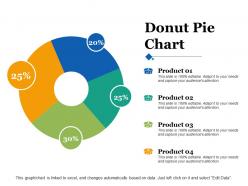 Donut pie chart ppt infographics file formats
This is a four stage process. The stage in this process are Business, Management, Marketing, Sales, Strategy.
-
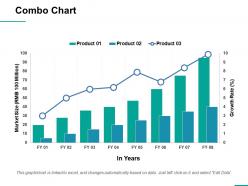 Combo chart ppt show infographic template
This is a three stage process. The stage in this process are Business, Management, Strategy, Sales, Marketing.
-
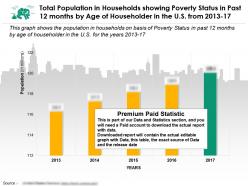 Total population in households showing poverty status in past 12 months by age of householder in us from 2013-17
otal Population in Households showing Poverty Status in Past 12 months by Age of Householder in the US from 2013 to 17. This is part of our Data and Statistics products selection, and you will need a Paid account to download the actual report with accurate data. Downloaded report will contain the actual editable graph with the actual data, an excel table with the actual data, the exact source of the data and the release date. This graph shows the population in households on basis of Poverty Status in past 12 months by age of householder in the U.S. for the years 2013 to 17. It covers topic Households Population with Poverty Status by Age Groups for region USA and is for date range 2013 to 2017. Download it immediately and use it for your business.


