- Sub Categories
-
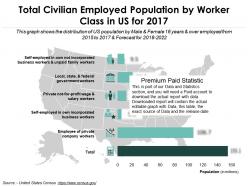 Total civilian employed population by worker class in us for 2017
Total Civilian Employed Population By Worker Class In Us For 2017. This is part of our Data and Statistics products selection, and you will need a Paid account to download the actual report with accurate data. Downloaded report will contain the actual editable graph with the actual data, an excel table with the actual data, the exact source of the data and the release date. This graph shows the distribution of US population by Male and Female 16 years and over employed from 2015 to 2017 and Forecast for 2018-2022. It covers topic Civilian Employed Population by Worker Class for region USA and is for date range 2017. Download it immediately and use it for your business.
-
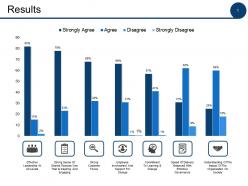 Results ppt powerpoint presentation file designs
This is a seven stages process. The stages in this process are Finance, Marketing, Management, Investment, Analysis.
-
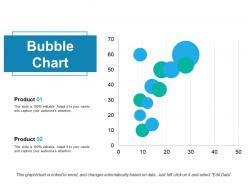 Bubble chart finance ppt powerpoint presentation diagram ppt
This is a two stages process. The stages in this process are Finance, Marketing, Management, Investment, Analysis.
-
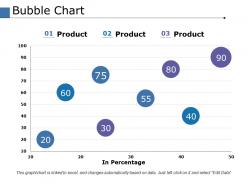 Bubble chart finance ppt powerpoint presentation file guide
This is a three stages process. The stages in this process are Finance, Marketing, Management, Investment, Analysis.
-
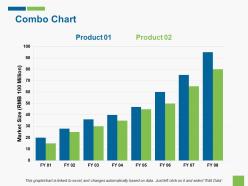 Combo chart financial growth ppt file graphics template
This is a two stage process. The stages in this process are Combo Chart, Finance, Marketing, Strategy, Analysis.
-
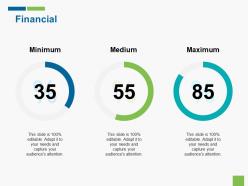 Financial analysis ppt gallery show
This is a three stage process. The stages in this process are Financial, Analysis, Marketing, Strategy, Business.
-
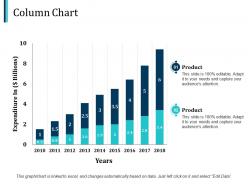 Column chart finance ppt pictures design templates
This is a two stage process. The stages in this process are Finance, Analysis, Business, Investment, Marketing.
-
 Stacked bar finance ppt infographics example introduction
This is a three stage process. The stages in this process are Finance, Analysis, Business, Investment, Marketing.
-
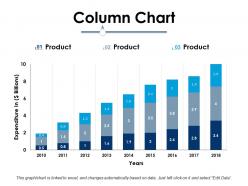 Column chart ppt infographic template backgrounds
This is a three stage process. The stage in this process are Business, Management, Marketing, Sales, Strategy.
-
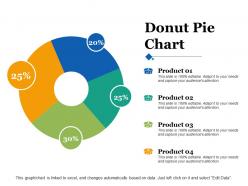 Donut pie chart ppt infographics file formats
This is a four stage process. The stage in this process are Business, Management, Marketing, Sales, Strategy.
-
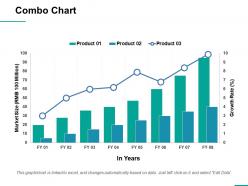 Combo chart ppt show infographic template
This is a three stage process. The stage in this process are Business, Management, Strategy, Sales, Marketing.
-
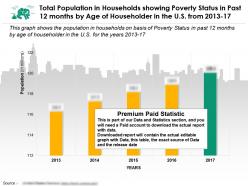 Total population in households showing poverty status in past 12 months by age of householder in us from 2013-17
otal Population in Households showing Poverty Status in Past 12 months by Age of Householder in the US from 2013 to 17. This is part of our Data and Statistics products selection, and you will need a Paid account to download the actual report with accurate data. Downloaded report will contain the actual editable graph with the actual data, an excel table with the actual data, the exact source of the data and the release date. This graph shows the population in households on basis of Poverty Status in past 12 months by age of householder in the U.S. for the years 2013 to 17. It covers topic Households Population with Poverty Status by Age Groups for region USA and is for date range 2013 to 2017. Download it immediately and use it for your business.
-
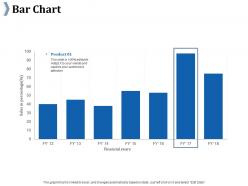 Bar chart ppt summary example introduction
This is a one stage process. The stages in this process are Percentage, Product, Business, Management, Marketing.
-
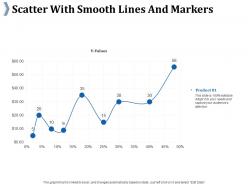 Scatter with smooth lines and markers ppt portfolio designs
This is a one stage process. The stages in this process are Percentage, Product, Business, Management, Marketing.
-
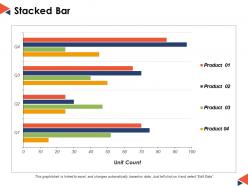 Stacked bar ppt powerpoint presentation file slides
This is a four stages process. The stages in this process are Finance, Marketing, Management, Investment, Analysis.
-
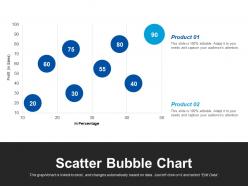 Scatter bubble chart finance ppt powerpoint presentation file infographic template
This is a two stage process. The stages in this process are Finance, Marketing, Management, Investment, Analysis.
-
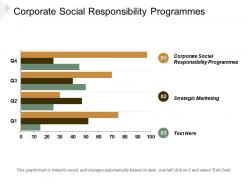 Corporate social responsibility programmes strategic marketing leadership development coach cpb
Presenting this set of slides with name - Corporate Social Responsibility Programmes Strategic Marketing Leadership Development Coach Cpb. This is an editable three stages graphic that deals with topics like Corporate Social Responsibility Programmes, Strategic Marketing, Leadership Development Coach to help convey your message better graphically. This product is a premium product available for immediate download, and is 100 percent editable in Powerpoint. Download this now and use it in your presentations to impress your audience.
-
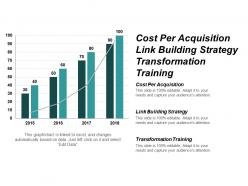 Cost per acquisition link building strategy transformation training cpb
Presenting this set of slides with name - Cost Per Acquisition Link Building Strategy Transformation Training Cpb. This is an editable three stages graphic that deals with topics like Cost Per Acquisition, Link Building Strategy, Transformation Training to help convey your message better graphically. This product is a premium product available for immediate download, and is 100 percent editable in Powerpoint. Download this now and use it in your presentations to impress your audience.
-
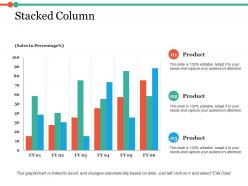 Stacked column financial process ppt slides deck
This is a three stage process. The stages in this process are Stacked Column, Marketing, Analysis, Business, Investment.
-
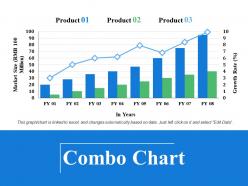 Combo chart finance ppt visual aids background images
This is a three stage process. The stages in this process are Combo Chart, Finance, Analysis, Business, Investment.
-
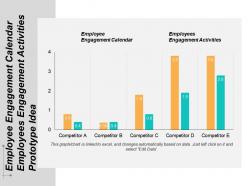 Employee engagement calendar employees engagement activities prototype idea cpb
This is an editable five stages graphic that deals with topics like Employee Engagement Calendar, Employees Engagement Activities, Prototype Idea to help convey your message better graphically. This product is a premium product available for immediate download, and is 100 percent editable in Powerpoint. Download this now and use it in your presentations to impress your audience.
-
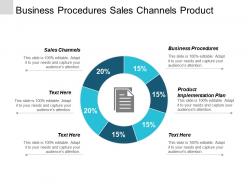 Business Procedures Sales Channels Product Implementation Plan Development Leadership Cpb
This is an editable six stages graphic that deals with topics like Business Procedures, Sales Channels, Product Implementation Plan, Development Leadership to help convey your message better graphically. This product is a premium product available for immediate download, and is 100 percent editable in Powerpoint. Download this now and use it in your presentations to impress your audience.
-
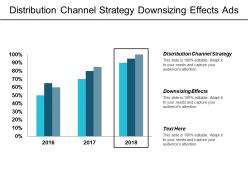 Distribution channel strategy downsizing effects ads analytics hr analytics cpb
This is an editable three stages graphic that deals with topics like Distribution Channel Strategy, Downsizing Effects, Ads Analytics, Hr Analytics to help convey your message better graphically. This product is a premium product available for immediate download, and is 100 percent editable in Powerpoint. Download this now and use it in your presentations to impress your audience.
-
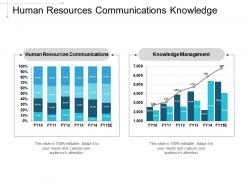 Human resources communications knowledge management organisational structure leadership management cpb
This is an editable two stages graphic that deals with topics like Human Resources Communications, Knowledge Management, Organisational Structure, Leadership Management to help convey your message better graphically. This product is a premium product available for immediate download, and is 100 percent editable in Powerpoint. Download this now and use it in your presentations to impress your audience.
-
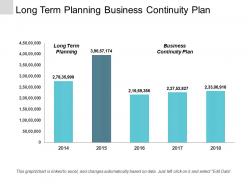 Long term planning business continuity plan cross channel retargeting cpb
This is an editable one stages graphic that deals with topics like Long Term Planning, Business Continuity Plan, Cross Channel Retargeting to help convey your message better graphically. This product is a premium product available for immediate download, and is 100 percent editable in Powerpoint. Download this now and use it in your presentations to impress your audience.
-
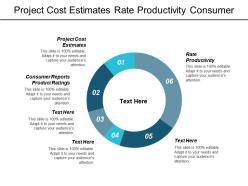 Project cost estimates rate productivity consumer reports product ratings cpb
This is an editable six stages graphic that deals with topics like Project Cost Estimates, Rate Productivity, Consumer Reports Product Ratings to help convey your message better graphically. This product is a premium product available for immediate download, and is 100 percent editable in Powerpoint. Download this now and use it in your presentations to impress your audience.
-
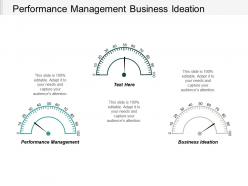 Performance management business ideation employee equity agile marketing cpb
This is an editable three stages graphic that deals with topics like Performance Management, Business Ideation, Employee Equity, Agile Marketing to help convey your message better graphically. This product is a premium product available for immediate download, and is 100 percent editable in Powerpoint. Download this now and use it in your presentations to impress your audience.
-
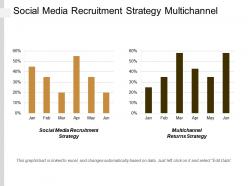 Social media recruitment strategy multichannel returns strategy idea innovation cpb
This is an editable two stages graphic that deals with topics like Social Media Recruitment Strategy, Multichannel Returns Strategy, Idea Innovation to help convey your message better graphically. This product is a premium product available for immediate download, and is 100 percent editable in Powerpoint. Download this now and use it in your presentations to impress your audience.
-
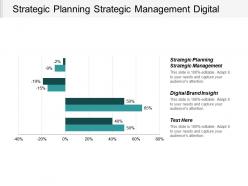 Strategic planning strategic management digital brand insight optimize branding cpb
This is an editable one stages graphic that deals with topics like Strategic Planning Strategic Management, Digital Brand Insight, Optimize Branding to help convey your message better graphically. This product is a premium product available for immediate download, and is 100 percent editable in Powerpoint. Download this now and use it in your presentations to impress your audience.
-
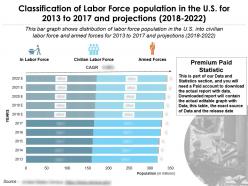 Classification of labor force population in the us for 2013-2022
Presenting this set of slides with name - Classification Of Labor Force Population In The Us For 2013-2022. Classification of Labor Force Population in the U.S. for 2013 to 2017 and Projections 2018 to 2022. This is part of our Data and Statistics products selection, and you will need a Paid account to download the actual report with accurate data. Downloaded report will contain the actual editable graph with the actual data, an excel table with the actual data, the exact source of the data and the release date. This bar graph shows distribution of labor force population in the U.S. into civilian labor force and armed forces for 2013 to 2017 and projections 2018 to 2022. It covers topic Labor Force Population for region USA and is for date range 2013 to 2022. Download it immediately and use it for your business.
-
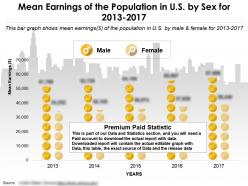 Mean earnings of the population in us by sex for 2013-2017
Presenting this set of slides with name - Mean Earnings Of The Population In Us By Sex For 2013-2017. Mean Earnings of the Population in U.S. by Sex for 2013 TO 2017. This is part of our Data and Statistics products selection, and you will need a Paid account to download the actual report with accurate data. Downloaded report will contain the actual editable graph with the actual data, an excel table with the actual data, the exact source of the data and the release date. This bar graph shows mean earnings dollar of the population in U.S. by male and female for 2013 TO 2017. It covers topic Mean Earnings by Sex for region USA and is for date range 2013 TO 2017. Download it immediately and use it for your business.
-
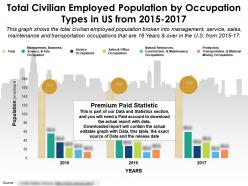 Total civilian employed population by occupation types in us from 2015-2017
Presenting this set of slides with name - Total Civilian Employed Population By Occupation Types In Us From 2015-2017. Total Civilian Employed Population by occupation types in US from 2015 to 2017. This is part of our Data and Statistics products selection, and you will need a Paid account to download the actual report with accurate data. Downloaded report will contain the actual editable graph with the actual data, an excel table with the actual data, the exact source of the data and the release date. This graph shows the total civilian employed population broken into management, service, sales, maintenance and transportation occupations that are 16 Years and over in the U.S. from 2015 to 2017. It covers topic Civilian Employed population by occupation for region USA and is for date range 2015 to 2017 . Download it immediately and use it for your business.
-
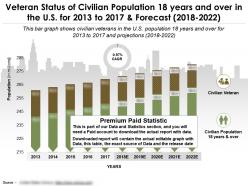 Veteran status of civilian population 18 years and over in the us for 2013-2022
Presenting this set of slides with name - Veteran Status Of Civilian Population 18 Years And Over In The Us For 2013-2022. Veteran Status of Civilian Population 18 years and over in the U.S. for 2013 to 2017 and Forecast 2018 to 2022. This is part of our Data and Statistics products selection, and you will need a Paid account to download the actual report with accurate data. Downloaded report will contain the actual editable graph with the actual data, an excel table with the actual data, the exact source of the data and the release date. This bar graph shows civilian veterans in the U.S. population 18 years and over for 2013 to 2017 and projections 2018 to 2022. It covers topic Civilian Population Veteran Status for region USA and is for date range 2013 to 2017. Download it immediately and use it for your business.
-
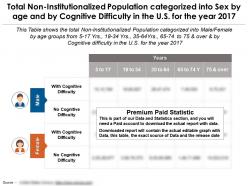 Non institutionalized population classified into sex by age and cognitive difficulty in the us for 2017
Presenting this set of slides with name - Non Institutionalized Population Classified Into Sex By Age And Cognitive Difficulty In The US For 2017. Total Non Institutionalized Population categorized into Sex by age and by Cognitive Difficulty in the U.S. for the year 2017. This is part of our Data and Statistics products selection, and you will need a Paid account to download the actual report with accurate data. Downloaded report will contain the actual editable graph with the actual data, an excel table with the actual data, the exact source of the data and the release date. This Table shows the total Non Institutionalized Population categorized into Male Female by age groups from 5-17 Yrs, 18-34 Yrs, 35-64Yrs, 65-74 to 75 and over and By Cognitive difficulty in the U.S. for the year 2017. It covers topic Cognitive Difficulty for Non Institutionalized Population by Sex for region USA and is for date range 2017. Download it immediately and use it for your business.
-
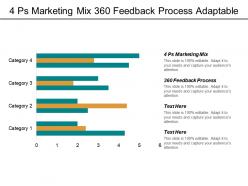 4 ps marketing mix 360 feedback process adaptable cpb
Presenting this set of slides with name - 4 Ps Marketing Mix 360 Feedback Process Adaptable Cpb. This is an editable four stages graphic that deals with topics like 4 Ps Marketing Mix, 360 Feedback Process, Adaptable to help convey your message better graphically. This product is a premium product available for immediate download, and is 100 percent editable in Powerpoint. Download this now and use it in your presentations to impress your audience.
-
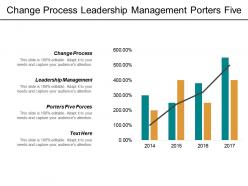 Change process leadership management porters five forces program management cpb
Presenting this set of slides with name - Change Process Leadership Management Porters Five Forces Program Management Cpb. This is an editable four stages graphic that deals with topics like Change Process, Leadership Management, Porters Five Forces, Program Management to help convey your message better graphically. This product is a premium product available for immediate download, and is 100 percent editable in Powerpoint. Download this now and use it in your presentations to impress your audience.
-
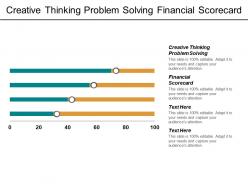 Creative thinking problem solving financial scorecard planning leadership cpb
Presenting this set of slides with name - Creative Thinking Problem Solving Financial Scorecard Planning Leadership Cpb. This is an editable two stages graphic that deals with topics like Creative Thinking Problem Solving, Financial Scorecard, Planning Leadership to help convey your message better graphically. This product is a premium product available for immediate download, and is 100 percent editable in Powerpoint. Download this now and use it in your presentations to impress your audience.
-
 Customer satisfaction david ulrich model employee transition plan cpb
Presenting this set of slides with name - Customer Satisfaction David Ulrich Model Employee Transition Plan Cpb. This is an editable two stages graphic that deals with topics like Customer Satisfaction, David Ulrich Model, Employee Transition Plan to help convey your message better graphically. This product is a premium product available for immediate download, and is 100 percent editable in Powerpoint. Download this now and use it in your presentations to impress your audience.
-
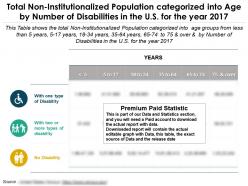 Total non institutionalized population categorized into age by number of disabilities in us for year 2017
Presenting this set of slides with name - Total Non Institutionalized Population Categorized Into Age By Number Of Disabilities In Us For Year 2017. Total Non Institutionalized Population categorized into Age by Number of Disabilities in the U.S. for the year 2017. This is part of our Data and Statistics products selection, and you will need a Paid account to download the actual report with accurate data. Downloaded report will contain the actual editable graph with the actual data, an excel table with the actual data, the exact source of the data and the release date. This Table shows the total Non Institutionalized Population categorized into age groups from less than 5 Yrs, 5-17 Yrs, 18-34 Yrs, 35-64Yrs, 65-74 to 75 and over and by Number of Disabilities in the U.S. for the year 2017. It covers topic Number of Disabilities for Non Institutionalized Population by Age Groups for region USA and is for date range 2017. Download it immediately and use it for your business.
-
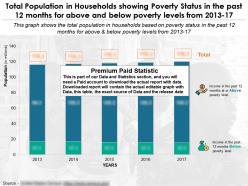 Total population in households showing poverty status in the past 12 months
Presenting this set of slides with name - Total Population In Households Showing Poverty Status In The Past 12 Months. Total Population in Households showing Poverty Status in the past 12 months for above and below poverty levels from 2013 to 17. This is part of our Data and Statistics products selection, and you will need a Paid account to download the actual report with accurate data. Downloaded report will contain the actual editable graph with the actual data, an excel table with the actual data, the exact source of the data and the release date. This graph shows the total population in households based on poverty status in the past 12 months for above and below poverty levels from 2013 to 17. It covers topic Households Population with Poverty Status by Poverty Levels for region USA and is for date range 2013 to 2017. Download it immediately and use it for your business.
-
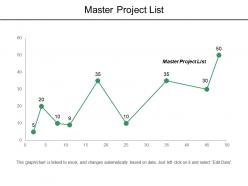 Master project list ppt powerpoint presentation file ideas cpb
Presenting this set of slides with name - Master Project List Ppt Powerpoint Presentation File Ideas Cpb. This is an editable one stages graphic that deals with topics like Master Project List to help convey your message better graphically. This product is a premium product available for immediate download,and is 100 percent editable in Powerpoint. Download this now and use it in your presentations to impress your audience.
-
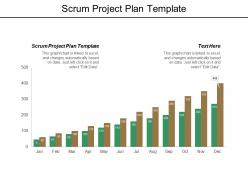 Scrum project plan template ppt powerpoint presentation file outfit cpb
Presenting this set of slides with name - Scrum Project Plan Template Ppt Powerpoint Presentation File Outfit Cpb. This is an editable two stages graphic that deals with topics like Scrum Project Plan Template to help convey your message better graphically. This product is a premium product available for immediate download,and is 100 percent editable in Powerpoint. Download this now and use it in your presentations to impress your audience.
-
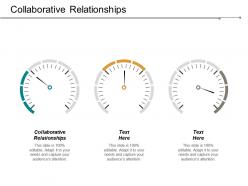 Collaborative relationships ppt powerpoint presentation infographic template icon cpb
Presenting this set of slides with name - Collaborative Relationships Ppt Powerpoint Presentation Infographic Template Icon Cpb. This is an editable three stages graphic that deals with topics like Collaborative Relationships to help convey your message better graphically. This product is a premium product available for immediate download, and is 100 percent editable in Powerpoint. Download this now and use it in your presentations to impress your audience.
-
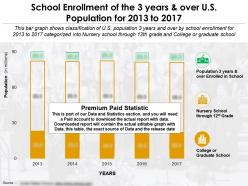 School enrollment of the 3 years and over us population for 2013-2017
Presenting this set of slides with name - School Enrollment Of The 3 Years And Over US Population For 2013-2017. School Enrollment of the 3 years and over U.S. Population for 2013 to 2017. This is part of our Data and Statistics products selection, and you will need a Paid account to download the actual report with accurate data. Downloaded report will contain the actual editable graph with the actual data, an excel table with the actual data, the exact source of the data and the release date. This bar graph shows classification of U.S. population 3 years and over by school enrollment for 2013 to 2017 categorized into Nursery school through 12th grade and College or graduate school. It covers topic School Enrollment for 3 years and over in U.S for region USA and is for date range 2013 to 17. Download it immediately and use it for your business.
-
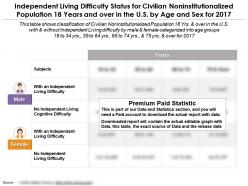 Independent difficulty status for non institutionalized population 18 years and over in the us by sex for 2017
Presenting this set of slides with name - Independent Difficulty Status For Non Institutionalized Population 18 Years And Over In The US By Sex For 2017. Independent Living Difficulty Status for Civilian Noninstitutionalized Population 18 Years and over in the U.S. by Age and Sex for 2017. This is part of our Data and Statistics products selection, and you will need a Paid account to download the actual report with accurate data. Downloaded report will contain the actual editable graph with the actual data, an excel table with the actual data, the exact source of the data and the release date. This table shows classification of Civilian Noninstitutionalized Population 18 Years and over in the U.S. with and without Independent Living difficulty by male and female categorized into age groups 18 to 34 years, 35 to 64 years, 65 to 74 years, and 75 years and over for 2017. It covers topic Civilian Noninstitutionalized Independent Living Difficulty Status for region USA and is for date range 2017. Download it immediately and use it for your business.
-
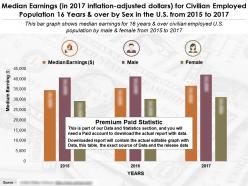 Median earnings for civilian employed population 16 years and over by sex in the us from 2015-17
Presenting this set of slides with name - Median Earnings For Civilian Employed Population 16 Years And Over By Sex In The US From 2015-17. Median Earnings in 2017 inflation adjusted dollars for Civilian Employed Population 16 Years and over by Sex in the U.S. from 2015 to 2017. This is part of our Data and Statistics products selection, and you will need a Paid account to download the actual report with accurate data. Downloaded report will contain the actual editable graph with the actual data, an excel table with the actual data, the exact source of the data and the release date. This bar graph shows median earnings for 16 years and over civilian employed U.S. population by male and female from 2015 to 2017. It covers topic Distribution of Population with Occupations by Sex for region USA and is for date range 2015 to 17. Download it immediately and use it for your business.
-
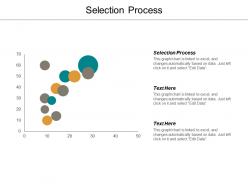 Selection process ppt powerpoint presentation outline grid cpb
Presenting this set of slides with name - Selection Process Ppt Powerpoint Presentation Outline Grid Cpb. This is an editable three stages graphic that deals with topics like Selection Process to help convey your message better graphically. This product is a premium product available for immediate download, and is 100 percent editable in Powerpoint. Download this now and use it in your presentations to impress your audience.
-
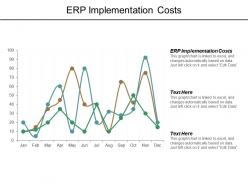 Erp implementation costs ppt powerpoint presentation summary cpb
Presenting this set of slides with name - Erp Implementation Costs Ppt Powerpoint Presentation Summary Cpb. This is an editable three stages graphic that deals with topics like Erp Implementation Costs to help convey your message better graphically. This product is a premium product available for immediate download, and is 100 percent editable in Powerpoint. Download this now and use it in your presentations to impress your audience.
-
 Earning population of the us by sex for 2013-2017
Presenting this set of slides with name - Earning Population Of The US By Sex For 2013-2017. Earning Population of the U.S. by Sex for 2013 To 2017. This is part of our Data and Statistics products selection, and you will need a Paid account to download the actual report with accurate data. Downloaded report will contain the actual editable graph with the actual data, an excel table with the actual data, the exact source of the data and the release date. This bar graph shows earning population of the U.S. by male and female for 2013 to 2017. It covers topic Earning Population by Sex for region USA and is for date range 2013 to 2017. Download it immediately and use it for your business.
-
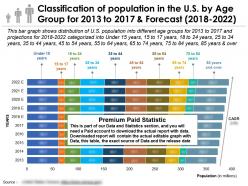 Classification of population in the us by age group for 2013-2022
Presenting this set of slides with name - Classification Of Population In The US By Age Group For 2013-2022. Classification of population in the U.S. by Age Group for 2013 to 2017 and Forecast 2018 TO 2022. This is part of our Data and Statistics products selection, and you will need a Paid account to download the actual report with accurate data. Downloaded report will contain the actual editable graph with the actual data, an excel table with the actual data, the exact source of the data and the release date. This bar graph shows distribution of U.S. population into different age groups for 2013 to 2017 and projections for 2018 TO 2022. It covers topic Population in the U.S. by Age Group for region USA and is for date range 2013 TO 22. Download it immediately and use it for your business.
-
 Employer value proposition customer analytics data strategy five steps cpb
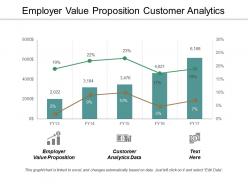
Presenting this set of slides with name - Employer Value Proposition Customer Analytics Data Strategy Five Steps Cpb. This is an editable three stages graphic that deals with topics like Employer Value Proposition, Customer Analytics Data, Strategy Five Steps to help convey your message better graphically. This product is a premium product available for immediate download, and is 100 percent editable in Powerpoint. Download this now and use it in your presentations to impress your audience.
-
 Procurement negotiation ppt powerpoint presentation show slide download cpb
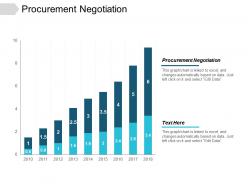
Presenting this set of slides with name - Procurement Negotiation Ppt Powerpoint Presentation Show Slide Download Cpb. This is an editable two stages graphic that deals with topics like Procurement Negotiation to help convey your message better graphically. This product is a premium product available for immediate download, and is 100 percent editable in Powerpoint. Download this now and use it in your presentations to impress your audience.
-
 Maslow employee motivation ppt powerpoint presentation gallery mockup cpb
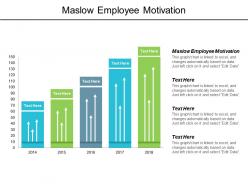
Presenting this set of slides with name - Maslow Employee Motivation Ppt Powerpoint Presentation Gallery Mockup Cpb. This is an editable four stages graphic that deals with topics like Maslow Employee Motivation to help convey your message better graphically. This product is a premium product available for immediate download, and is 100 percent editable in Powerpoint. Download this now and use it in your presentations to impress your audience.
-
 Educational attainment for the population between 35 to 44 years categorized into sex in the us from 2015-2022
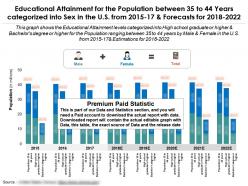
Presenting this set of slides with name - Educational Attainment For The Population Between 35 To 44 Years Categorized Into Sex In The US From 2015-2022. Educational Attainment for the Population between 35 to 44 Years categorized into Sex in the U.S. from 2015 to 17 and Forecasts for 2018 to 2022. This is part of our Data and Statistics products selection, and you will need a Paid account to download the actual report with accurate data. Downloaded report will contain the actual editable graph with the actual data, an excel table with the actual data, the exact source of the data and the release date. This graph shows the Educational Attainment levels categorized into High school graduate or higher and Bachelors degree or higher for the Population ranging between 35 to 44 years by Male and Female in the U.S. from 2015 to 17 and Estimations for 2018 to 2022. It covers topic Educational Attainment levels by Sex for 35 to 44 Years for region USA and is for date range 2015 to 22. Download it immediately and use it for your business.
-
 Opm org chart ppt powerpoint presentation model demonstration cpb
Presenting this set of slides with name - OPM Org Chart Ppt Powerpoint Presentation Model Demonstration Cpb. This is an editable three stages graphic that deals with topics like OPM Org Chart to help convey your message better graphically. This product is a premium product available for immediate download, and is 100 percent editable in Powerpoint. Download this now and use it in your presentations to impress your audience.
-
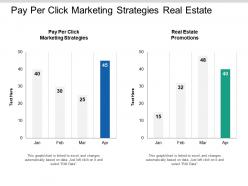 Pay per click marketing strategies real estate promotions cpb
Presenting this set of slides with name - Pay Per Click Marketing Strategies Real Estate Promotions Cpb. This is an editable two stages graphic that deals with topics like Pay Per Click Marketing Strategies, Real Estate Promotions to help convey your message better graphically. This product is a premium product available for immediate download, and is 100 percent editable in Powerpoint. Download this now and use it in your presentations to impress your audience.
-
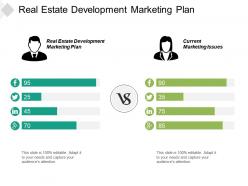 Real estate development marketing plan current marketing issues cpb
Presenting this set of slides with name - Real Estate Development Marketing Plan Current Marketing Issues Cpb. This is an editable two stages graphic that deals with topics like Real Estate Development Marketing Plan, Current Marketing Issues to help convey your message better graphically. This product is a premium product available for immediate download, and is 100 percent editable in Powerpoint. Download this now and use it in your presentations to impress your audience.
-
 Operational excellence framework ppt powerpoint presentation pictures infographics cpb
Presenting this set of slides with name - Operational Excellence Framework Ppt Powerpoint Presentation Pictures Infographics Cpb. This is an editable three stages graphic that deals with topics like Operational Excellence Framework to help convey your message better graphically. This product is a premium product available for immediate download, and is 100 percent editable in Powerpoint. Download this now and use it in your presentations to impress your audience.
-
 Educational achievement by sex for 25 years and over white alone for regular high school us 2015-2017
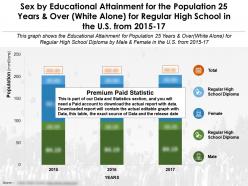
Presenting this set of slides with name - Educational Achievement By Sex For 25 Years And Over White Alone For Regular High School US 2015-2017. Sex By Educational Attainment For The Population 25 Years And Over White Alone For Regular High School In The U.S. From 2015 to 17. This is part of our Data and Statistics products selection, and you will need a Paid account to download the actual report with accurate data. Downloaded report will contain the actual editable graph with the actual data, an excel table with the actual data, the exact source of the data and the release date.This graph shows the Educational Attainment for Population 25 Years and Over White Alone for Regular High School Diploma by Male and Female in the U.S. from 2015 to 17. It covers topic Educational Attainment for Regular High School for region USA and is for date range 2015 to 17. Download it immediately and use it for your business.
-
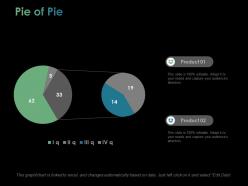 Pie of pie financial ppt powerpoint presentation file model
Presenting pie of pie financial PPT PowerPoint presentation file model PPT slide. The user can easily change the color codes and background without affecting the image resolution. Also, the PowerPoint is thoroughly compatible with Google Slides, multiple software options, and format options. The download process and the editing process related to this PPT is completely hassle free.


