- Sub Categories
-
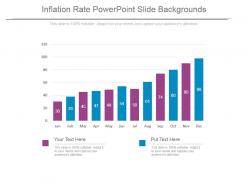 Inflation rate powerpoint slide backgrounds
Presenting inflation rate powerpoint slide backgrounds. This is a inflation rate powerpoint slide backgrounds. This is a twelve stage process. The stages in this process are jan, feb, mar, apr, may, jun, jul, aug, sep, oct, nov, dec.
-
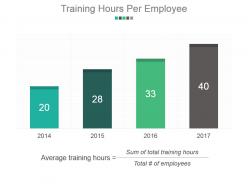 Training hours per employee powerpoint slide presentation tips
Presenting training hours per employee powerpoint slide presentation tips. This is a training hours per employee powerpoint slide presentation tips. This is a four stage process. The stages in this process are average training hours, sum of total training hours, total number of employees.
-
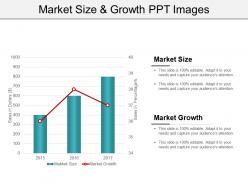 Market size and growth ppt images
Presenting market size and growth ppt images. This is a market size and growth ppt images. This is a three stage process. The stages in this process are market size, market growth.
-
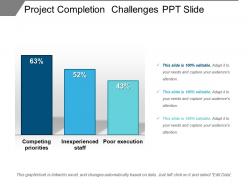 Project completion challenges ppt slide
Presenting project completion challenges PPT slide PPT slide.PPT has impressive high-quality visuals. Images do not pixelate when projected on a wide screen. Result of intrinsic research and brainstorming done by our experts. PPT is easy to understand and compatible with numerous software and format options. 100 percent editable slide design. Personalize the content with company-specific name and logo. Such PPT is used by profit and non-profit organizations and also educational institutions for their profile presentations during meets.
-
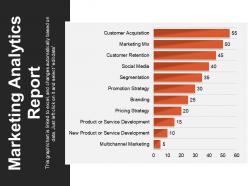 Marketing analytics report powerpoint slide show
Presenting marketing analytics report powerpoint slide show. This is a marketing analytics report powerpoint slide show. This is a eleven stage process. The stages in this process are market analysis, marketing analytics, web analytics, marketing optimization.
-
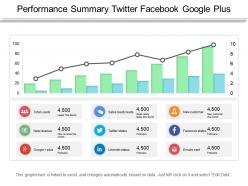 Performance summary twitter facebook google plus ppt inspiration
Presenting Performance Summary Twitter Facebook Google Plus PPT Inspiration. You can easily download this template to access its full version. This template allows you to resize it and make changes in the fonts, colors, images, icons as per your needs. The slide is compatible with Google Slides and other formats such as PDF, JPG, and PNG. The slide designs are available in both the sizes- standard(4:3) and widescreen(16:9). Project it in front of a large segment because of its splendid pixel quality.
-
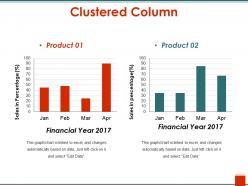 Clustered column example of ppt
Presenting Clustered Column Example Of PPT template. The slideshow is totally customizable in PowerPoint and other office suites. We have utilized the best available PowerPoint templates, images, icons, and layouts. You can include impressive, editable data visualization tools such as charts, graphs, and tables for better outcomes. Convert this into the various image or document formats such as JPEG or PDF. Moreover, this slide supports both standard and widescreen viewing angles.
-
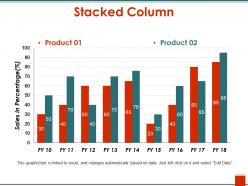 Stacked column sample ppt files
Presenting Stacked Column Sample PPT Files template. The presentation fully editable in PowerPoint and other office suites. Our designers have used the best PowerPoint templates, images, icons, and layouts currently available. The slide can be made inclusive of impressive, editable data visualization tools such as charts, graphs, and tables. Easily save it into the various image or document formats such as JPEG or PDF.
-
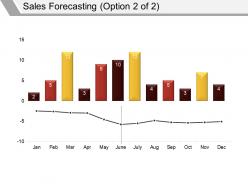 Sales forecasting powerpoint slide templates download
Presenting forecasting PowerPoint slide templates download. Get this completely customizable slide. The template can be downloaded quickly. Our templates are 100% editable. The colors, texts, fonts, images can be altered according to the theme of the organization. You can easily save the PPT in any format like PDF, JPG and PNG. It is Google Slides friendly. It is available in both the slide design sizes 4:3 and 16:9.
-
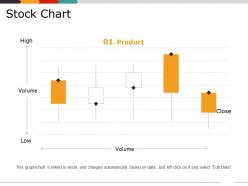 Stock chart ppt design
Presenting stock chart ppt design. This is a stock chart ppt design. This is a five stage process. The stages in this process are high, volume, low, close, product.
-
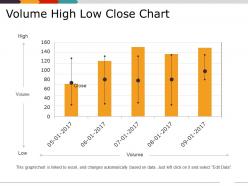 Volume high low close chart ppt images gallery
Presenting volume high low close chart ppt images gallery. This is a volume high low close chart ppt images gallery. This is a five stage process. The stages in this process are high, volume, low, close, product.
-
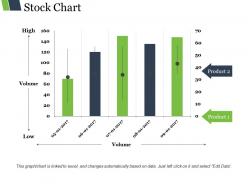 Stock chart ppt background template
Presenting stock chart ppt background template. This is a stock chart ppt background template. This is a five stage process. The stages in this process are high, volume, low, product, finance.
-
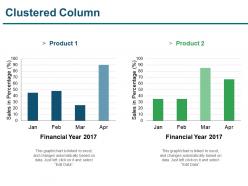 Clustered column presentation layouts
Presenting clustered column presentation layouts. This is a clustered column presentation layouts . This is a two stage process. The stages in this process are financial, clustered column, analysis, strategy, business.
-
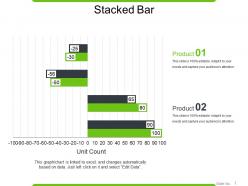 Stacked bar powerpoint slide rules
Presenting stacked bar powerpoint slide rules. This is a stacked bar powerpoint slide rules. This is a two stage process. The stages in this process are stacked bar, finance, marketing, strategy, business.
-
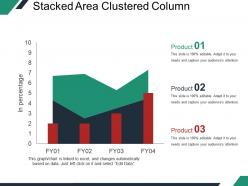 Stacked area clustered column ppt example file
Presenting stacked area clustered column ppt example file. This is a stacked area clustered column ppt example file. This is a four stage process. The stages in this process are product, in percentage, growth, success, business.
-
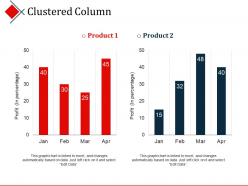 Clustered column powerpoint slides design
Presenting clustered column powerpoint slides design. This is a clustered column powerpoint slides design. This is a two stage process. The stages in this process are profit, clustered column, product.
-
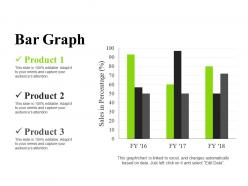 Bar graph powerpoint images template 2
Presenting bar graph powerpoint images template 2. This is a bar graph powerpoint images template 2. This is a three stage process. The stages in this process are product, bar graph, growth, success, finance.
-
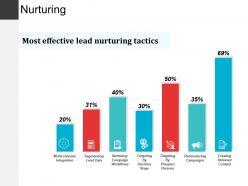 Nurturing ppt presentation examples
Presenting nurturing ppt presentation examples. This is a nurturing ppt presentation examples. This is a seven stage process. The stages in this process are segmenting lead data, nurturing campaign workflows, targeting by decision stage, personalizing campaigns, creating relevant content.
-
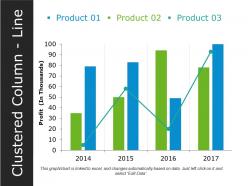 Clustered column line powerpoint templates template 1
Presenting clustered column line powerpoint templates template 1. This is a clustered column line powerpoint templates template 1. This is a three stage process. The stages in this process are profit, product, bar graph, year, success.
-
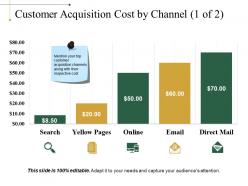 Customer acquisition cost by channel powerpoint slide design ideas
Presenting customer acquisition cost by channel powerpoint slide design ideas. This is a customer acquisition cost by channel powerpoint slide design ideas. This is a five stage process. The stages in this process are business, marketing, growth, graph, online.
-
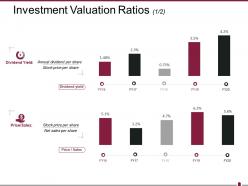 Investment valuation ratios powerpoint slide deck samples
Presenting investment valuation ratios powerpoint slide deck samples. This is a investment valuation ratios powerpoint slide deck samples. This is a two stage process. The stages in this process are dividend yield, price sales, business, marketing, finance.
-
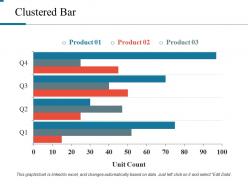 Clustered bar powerpoint slide designs download
Presenting clustered bar powerpoint slide designs download. This is a clustered bar powerpoint slide designs download. This is a three stage process. The stages in this process are unit count, business, marketing, finance, graph.
-
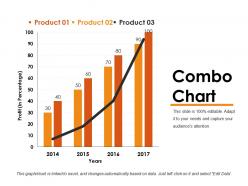 Combo chart example ppt presentation
Presenting combo chart example ppt presentation. This is a combo chart example ppt presentation. This is a three stage process. The stages in this process are profit, years, business, marketing, growth.
-
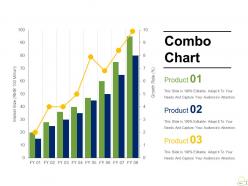 Combo chart presentation visual aids
Presenting combo chart presentation visual aids. This is a combo chart presentation visual aids. This is a three stage process. The stages in this process are growth rate, market size, business, marketing, graph.
-
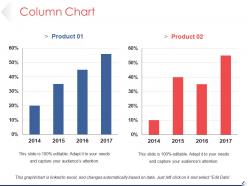 Column chart powerpoint images template 1
Presenting Column Chart PowerPoint Images Template. This PPT layout is compatible with Google Slides. You can download this PPT theme in various formats like PDF, PNG, and JPG. This PowerPoint template is completely editable and you can modify the font size, font type, and shapes as per your requirements. This PPT slide is available in 4:3 and 16:9 aspect ratios
-
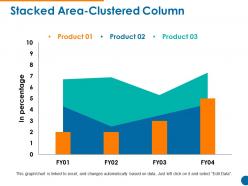 Stacked area clustered column powerpoint slide clipart
Presenting stacked area clustered column powerpoint slide clipart. This is a stacked area clustered column powerpoint slide clipart. This is a three stage process. The stages in this process are product, in percentage, area chart bar graph, growth.
-
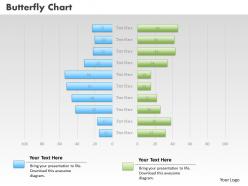 0414 butterfly bar chart business illustartion powerpoint graph
You can use slide fluently on all software. Rapid transformation to JPG and PDF formats. Highly compatible with Google slides for easy and shared information access. Widescreen viewing without PPT graphics pixelation. Add company logo, name and trademark for specificity. Editable layout with the option to alter features like font, text, color and design. High resolution PPT graphics for better clarity. Usable in businesses, small and large, startups, project management, strategic firms, quality assurance departments, government offices and educational institutes.
-
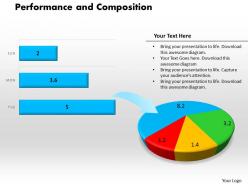 0414 performance and composition bar pie chart powerpoint graph
High resolution visuals. Ease of download. Compatible with numerous format options. Compatible with multiple online and offline software options. Thoroughly editable slide design background. Ease of inclusion and exclusion of slide content as per the need of an hour. Freedom to include the company specific name, logo and trademark, so as to personalize the presentation. Used by business professionals, finance students, marketing students, and teachers.
-
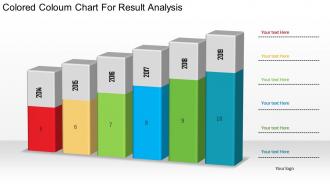 1214 colored coloum chart for result analysis powerpoint slide
We are proud to present our 1214 colored coloum chart for result analysis powerpoint slide. Colored column chart has been used to craft this power point template. This PPT slide contains the concept of result analysis. Use this PPT slide for your finance and marketing related presentations.
-
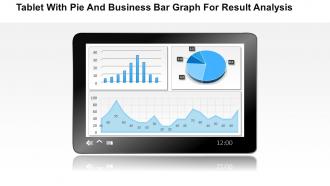 1214 tablet with pie and business bar graph for result analysis powerpoint slide
Exquisitely designed PowerPoint slide with great image quality. Editable images, icons, colors, text and layout as per the industry requisite. Alternative to add brand name and theme to customize. Presentation shape can be downloaded and save into JPG and PDF format. PPT design layout obtainable in standard and widescreen view. Fully flexible slide design with Google slides. Effortless to adjust and present when required. Innovatively designed to share the complex data in easy manner with graphs and charts. Easy to transmit any message effectively when shared even with large audience.
-
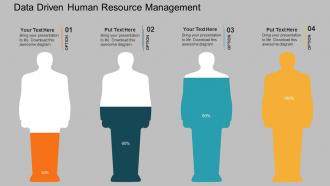 Data driven human resource management powerpoint slides
All images are 100% editable in the presentation design. Good quality images can be used to compliment message. Works well in Windows 7, 8, 10, XP, Vista and Citrix. Editing in presentation slide show can be done from anywhere by any device. Students, teachers, businessmen or industrial managers can put to use the PPT layout as per their requirement. Compatibility with Google slides. PPT graphic offers font size which can be read from a distance. High resolution is offered by the presentation slide show.
-
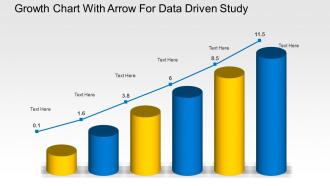 Growth chart with arrow for data driven study powerpoint slides
We are proud to present our growth chart with arrow for data driven study powerpoint slides. Graphic of growth chart with arrow has been used to design this power point template diagram. This PPT diagram contains the concept of data driven growth analysis. Use this PPT diagram for business and finance related presentations.
-
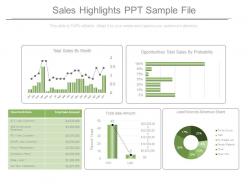 Sales highlights ppt sample file
Presenting sales highlights ppt sample file. This is a sales highlights ppt sample file. This is a five stage process. The stages in this process are total sales by month, opportunities total sales by probability, opportunity name amount, total sale amount, lead sources revenue share.
-
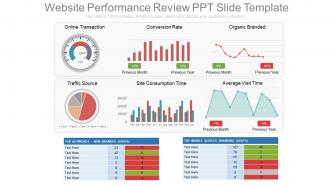 Website performance review ppt slide template
These are exclusively codified PPT design schemes which are quite suitable for online business managers, process experts etc. These PPT graphics can be acclimating with divergent software’s and Google slides. These are wonderfully conceived pictorial Presentation templates which can be customizable in to other file formats like PDF or JPG. They have an alterable designs, forms, colors, contents etc. These Website performance PPT design can also provide a space to add the title or subtitle as per your need.
-
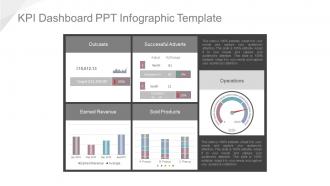 Kpi dashboard ppt infographic template
Presenting kpi dashboard ppt infographic template. This is a Kpi Dashboard Ppt Infographic Template. This is a four stage. The Stages in this process are outcasts, successful adverts, earned revenue, sold products, operations.
-
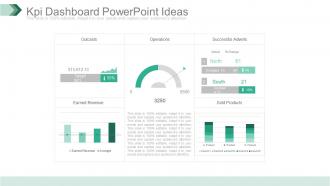 Kpi Dashboard Snapshot Powerpoint Ideas
Fabulously composed PPT design useful for business professionals, organizational experts or researchers , students and many more from diverse areas , Comprehensive and convenient PPT Images with ductile dummy data options, Consonant with all available graphic software’s and Google slides, Accessible to other file configurations like PDF or JPG. Multi-color options, background images, styles and other characteristics are fully editable, Expeditious downloading process, Allows to introduce your company logo or brand name in the PPT slides.
-
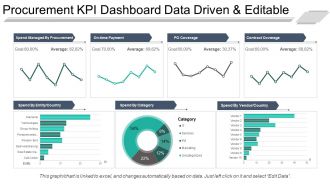 Procurement kpi dashboard snapshot data driven and editable ppt sample file
Presenting procurement kpi dashboard snapshot data driven and editable ppt sample file. This is a procurement kpi dashboard data driven and editable ppt sample file. This is a seven stage process. The stages in this process are business, strategy, growth, finance, chart and graph.
-
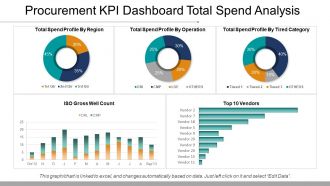 Procurement Kpi Dashboard Total Spend Analysis Ppt Samples
Presenting procurement kpi dashboard total spend analysis ppt samples. This is a procurement kpi dashboard total spend analysis ppt samples. This is a five stage process. The stages in this process are business, strategy, growth, finance, chart and graph.
-
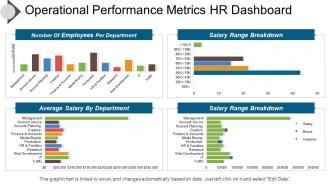 Operational performance metrics hr dashboard snapshot presentation images
Introducing operational performance metric HR PPT image. Fully regulated PowerPoint template quite reasonable for the HR and management professionals and business specialists. Extensive scope for reviving the dummy data and can add company logo, trademark etc. Reconvert able background PPT image, subject matter, designs, context etc. according to need. Versant with all Google Slides and other system applications. Can be easily projected over wide screen with exceptional picture quality.
-
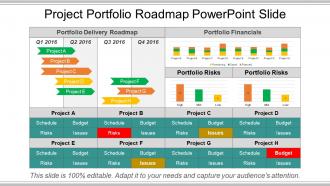 Project portfolio roadmap powerpoint slide
Presenting project portfolio roadmap PowerPoint slide. This is professional developed Presentation graphic. The PPT layout also provides the high resolution quality levels which remains unaffected even when projected on to the wider screens. This PPT slide is also simple to use and download. All the features diagram, chart, design, pattern, size, color, and PowerPoint image etc. are totally modifiable. This is also well conversant with the Google Slides and other operating software. Can be used with the different file formats such as PDF or JPG.
-
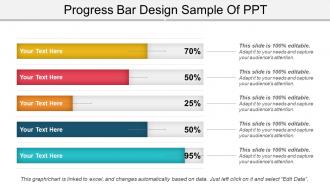 Progress bar design sample of ppt
Presenting a PowerPoint slide named Progress Bar Design Sample of PPT. Use this completely customizable and easy-to-edit PPT slide to communicate your ideas in the presentation. You can format the font size, color and style of the slide. Add your desired content anywhere in the slide. Its compatibility with Google Slides makes it readily accessible. You can save it in PDF, JPEG or JPG formats. This PPT slide is Excel-linked. You can avail it in a widescreen size as well a standard size screen.
-
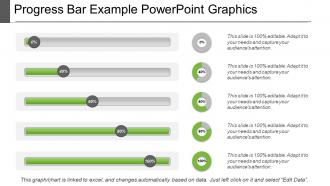 Progress bar example powerpoint graphics
We brings to you the progress bar example PowerPoint graphics. You can download this PPT completely free of cost. You just have to edit the data in a pre-designed format and present it. You can insert pictures and new slides to this ready-made deck of slides. All these slides are fully compatible with Google Slides. This presentation can be downloaded in JPG and PDF formats. It can be viewed in the 16:9 ratio widescreen size and the ratio of 4:3 standard screen size.
-
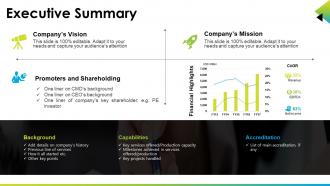 Executive summary ppt presentation examples
High resolution Presentation design is easy to portray and share with audience. PPT diagram is easy to amend as elements like font, colors and shape are editable. Download is hasty which saves time as well as effort. Tailor it by injecting corporation trade name and design. Display in both Standard and Widescreen format. Presentation design is totally responsive with Google slides. PPT PowerPoint slide comes with creative and professional approach.
-
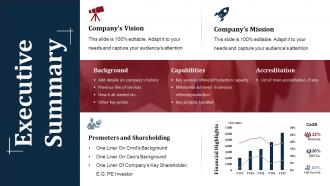 Executive summary powerpoint slide background image
Presenting executive summary powerpoint slide background image. • Tension free download possible. • Once downloaded, the presentation can be modified to any format like JPG, JPEG, PDF, etc • It’s also compatible with multiple software and Google slides. • The provided executive summary PPT presentation template can easily be used solely or as part your pre built presentation. • Be happy to customize and personalize the presentation with company specifications. • There is no hassle when any fact, figures or text is to be included or excluded in the presentation. • Picture quality compatible with wide screen exposure. • Much appreciated and used by business executives, professionals, students and teachers.
-
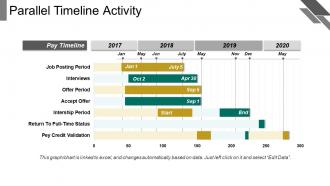 Parallel timeline activity
Presenting parallel timeline activity. This is a parallel timeline activity. This is a four stage process. The stages in this process are parallel timeline, parallel roadmap, parallel linear process.
-
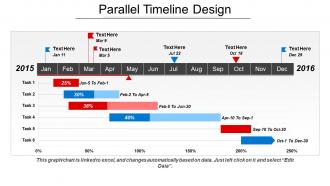 Parallel timeline design
This business template is highly recommended as it is 100% editable and can be changed as per you requirements. The font size, font color and font style can be easily modified as per your needs. This presentation is compatible with Google slides and can be viewed in widescreen in ratio of 16:9 or standard screen of 4:3. The orientation, size and color of the shapes and the designs used in this deck can be easily modified by just following the instructions given in the sample slides. You can add or remove any sort of information from this set of PPT templates.
-
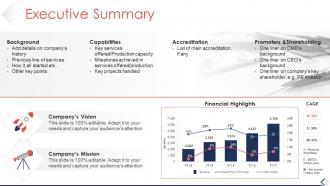 Executive summary powerpoint slide download
Presenting Executive Summary PowerPoint Slide Download template. You can include charts and graphs for a clear representation of facts. The PPT also supports the standard (4:3) and widescreen (16:9) aspect ratios. It is having compatibility with Google Slides. Save this into common images or document formats like JPEG, PNG, or PDF. High-quality graphics will ensure that picture quality does not deteriorate.
-
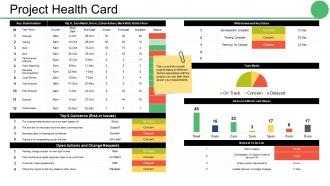 Project health card ppt gallery rules
Presenting health card PPT gallery rules. This layout is fully compatible with Google slides and data driven. User can edit the data in linked excel sheet and graphs and charts gets customized accordingly. Easy to put in company logo, trademark or name; accommodate words to support the key points. Images do no distort out even when they are projected on large screen. Adjust colors, text and fonts as per your business requirements
-
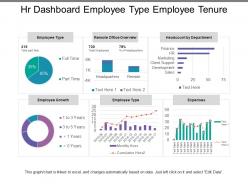 Hr dashboard employee type employee tenure
Presenting this set of slides with name - Hr Dashboard Employee Type Employee Tenure. This is a six stage process. The stages in this process are Hr Dashboard, Human Resource Dashboard, Hr Kpi.
-
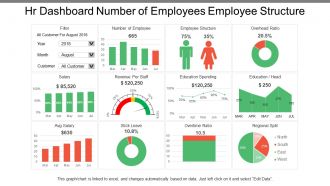 Hr Dashboard Number Of Employees Employee Structure
Presenting this set of slides with name - Hr Dashboard Number Of Employees Employee Structure. This is a four stage process. The stages in this process are Hr Dashboard, Human Resource Dashboard, Hr Kpi.
-
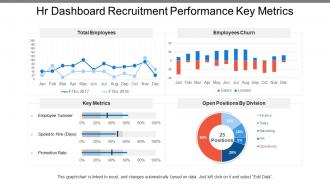 Hr dashboard snapshot recruitment performance key metrics
Presenting this set of slides with name - Hr Dashboard Snapshot Recruitment Performance Key Metrics. This is a four stage process. The stages in this process are Hr Dashboard, Human Resource Dashboard, Hr Kpi.
-
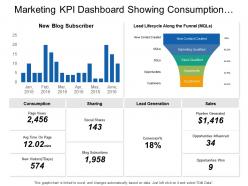 Marketing kpi dashboard showing consumption sharing sales lead generation
As this slideshow is 100% customizable you can easily add or remove anything from the pre-designed slides. You can change the font size, font color and the font style of the text used following instructions given in the sample templates. The orientation, size and the color of various graphical illustrations used in the PPT template are also adjustable. If you download this PPT slideshow you can view it in either standard size screen ratio of 4:3 or wide screen display ratio of 16:9. The PowerPoint presentation can be saved in PDF or JPG format. The slides are fully compatible with Google slides.
-
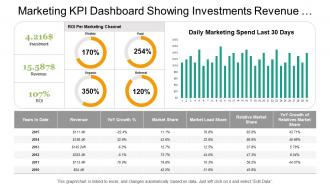 Marketing kpi dashboard showing investments revenue metrics details
Presenting marketing kpi dashboard showing investments revenue metrics details presentation template slide. The PPT template is very user friendly as it allows you to make numerous changes to the editable slides. You can amend the font size, font style and also the font color as per your requirements. Template slide can be downloaded quickly and cab be saved in format of PDF or JPG easily. The template slide after being downloaded can be viewed in large screen display ratio of 16:9 or standard size display ratio of 4:3.
-
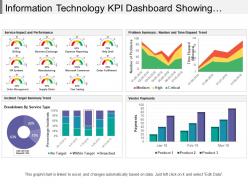 Information technology kpi dashboard showing incident target summary trend
Presenting this set of slides with name - Information Technology Kpi Dashboard Showing Incident Target Summary Trend. This is a five stage process. The stages in this process are Information Technology, It, Iot.
-
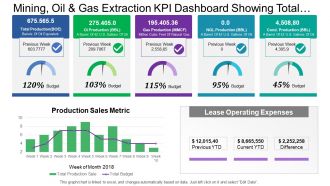 Mining oil and gas extraction kpi dashboard showing total production and budget
Presenting this set of slides with name - Mining Oil And Gas Extraction Kpi Dashboard Showing Total Production And Budget. This is a three stage process. The stages in this process are Mining, Oil And Gas Extraction, Refinery, Natural Gas.
-
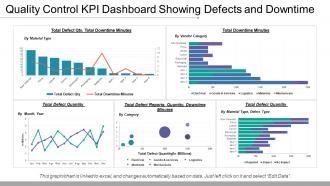 Quality control kpi dashboard showing defects and downtime
Presenting this set of slides with name - Quality Control Kpi Dashboard Showing Defects And Downtime. This is a five stage process. The stages in this process are Quality Management, Quality Control, Quality Assurance.
-
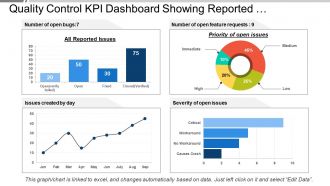 Quality control kpi dashboard showing reported issues and priority
Presenting this set of slides with name - Quality Control Kpi Dashboard Showing Reported Issues And Priority. This is a four stage process. The stages in this process are Quality Management, Quality Control, Quality Assurance.
-
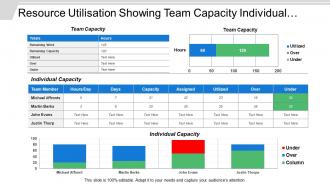 Resource utilisation showing team capacity individual capacity
Presenting this set of slides with name - Resource Utilisation Showing Team Capacity Individual Capacity. This is a four stage process. The stages in this process are Resource Management, Resource Utilization, Resource Allocation.
-
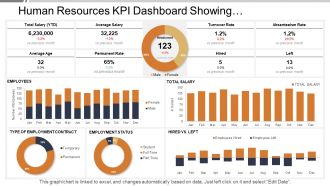 Human resources kpi dashboard showing employment status turnover rate
SlideTeam presents the Human Resources Kpi Dashboard Showing Employment Status Turnover Rate PPT which will help you keep a track of the human capital working under you. All the slides in the slideshow are 100 percent editable and you can make all the desired changes in the presentation. You can also add or delete the slides All the slides are fully compatible with Google slides as well. Your audience will be amazed by Google slides. You can even view the document in 16:9 widescreen size.
-
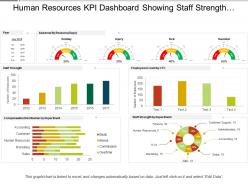 Human resources kpi dashboard showing staff strength compensation distribution
SlideTeam presenting Human Resources Kpi Dashboard Showing Staff Strength Compensation Distribution PPT. It will not only help you in knowing the exact strength of the staff but also about actual staff required in the organization. This slideshow is entirely editable and you can edit it whenever you want. All the slides in this presentation are compatible with Google slides. You can enter thousands of relatable icons of your own choice. You can also change from 4:3 standard screen size to 16:9 widescreen size.


