Data Driven Sliding Bars and and other powerpoint diagrams and templates
- Sub Categories
-
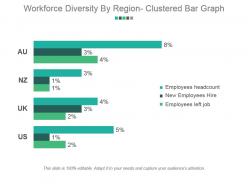 Workforce diversity by region clustered bar graph powerpoint slide design templates
Presenting workforce diversity by region clustered bar graph powerpoint slide design templates. This is a workforce diversity by region clustered bar graph powerpoint slide design templates. This is a four stage process. The stages in this process are employees headcount, new employees hire, employees left job.
-
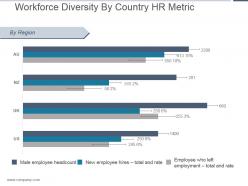 Workforce diversity by country hr metric powerpoint show
Presenting workforce diversity by country hr metric powerpoint show. This is a workforce diversity by country hr metric powerpoint show. This is a four stage process. The stages in this process are by region, employee who left employment total and rate, new employee hires total and rate, male employee headcount.
-
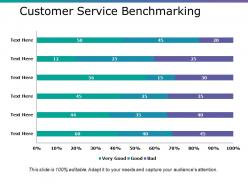 Customer service benchmarking ppt files
Presenting this set of slides with name - Customer Service Benchmarking Ppt Files. This is a six stage process. The stages in this process are Finance, Business, Management, Step, Percentage.
-
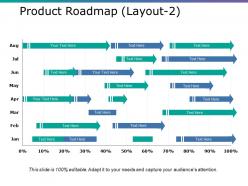 Product roadmap ppt model tips
Presenting this set of slides with name - Product Roadmap Ppt Model Tips. This is a eight stage process. The stages in this process are Percentage, Finance, Business, Arrows, Management.
-
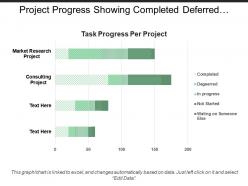 Project progress showing completed deferred not started
Presenting this set of slides with name - Project Progress Showing Completed Deferred Not Started. This is a four stage process. The stages in this process are Project Progress, Project Growth, Project Management.
-
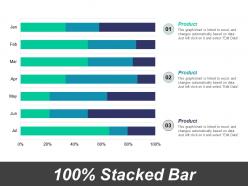 100 percent stacked bar ppt powerpoint presentation gallery outline
Presenting this set of slides with name - 100 Percent Stacked Bar Ppt Powerpoint Presentation Gallery Outline. This is a three stage process. The stages in this process are Business, Management, Strategy, Analysis, Marketing.
-
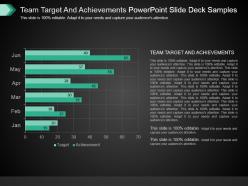 Team target and achievements powerpoint slide deck samples
Presenting team target and achievements powerpoint slide deck samples. This is a team target and achievements powerpoint slide deck samples. This is a six stage process. The stages in this process are team, target, achievements, business, marketing, management, strategy, presentation.
-
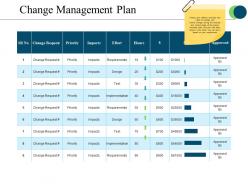 Change management plan powerpoint slide ideas
Presenting change management plan powerpoint slide ideas. This is a change management plan powerpoint slide ideas. This is a nine stage process. The stages in this process are change request, priority, impacts, effort, approved.
-
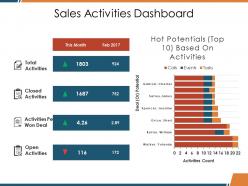 Sales activities dashboard ppt designs
Presenting this set of slides with name - Sales Activities Dashboard Ppt Designs. This is a two stage process. The stages in this process are Total Activities, Closed Activities, Activities Per Won Deal, Open Activities, Business.
-
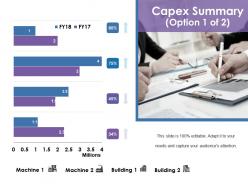 Capex summary ppt summary gallery
Presenting this set of slides with name - Capex Summary Ppt Summary Gallery. This is a four stage process. The stages in this process are Millions, Building, Machine, Percentage, Business.
-
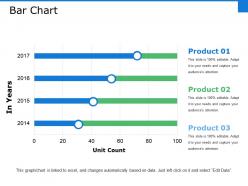 Bar chart ppt file deck
Presenting this set of slides with name - Bar Chart Ppt File Deck. This is a three stage process. The stages in this process are Product, Unit Count, In Years, Business, Marketing.
-
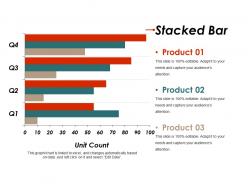 Stacked bar presentation slides
Presenting stacked Bar Presentation Slides. This slide is fully editable. This slide is also compatible with Google Slide and PowerPoint software. It is made up of high-resolution graphics that do not deteriorate the quality when projected on full screen. Customize the slide as per your needs and wants. It can be viewed on a standard screen and widescreen without any fear of pixelation. It can be easily saved into formats like PDF, JPG and PNG.
-
 Stacked bar ppt infographic template structure
This is a three stage process. The stage in this process are Business, Management, Strategy, Marketing, Icon.
-
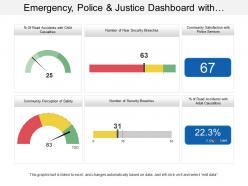 Emergency police and justice dashboard with community perception of safety
Presenting this set of slides with name - Emergency Police And Justice Dashboard With Community Perception Of Safety. This is a six stage process. The stages in this process are Emergency, Police And Justice, Police And Emergency Services, Justice And Public Security.
-
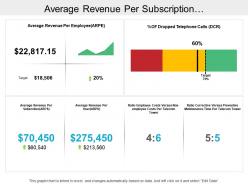 Average revenue per subscription telecommunications dashboard
Presenting this set of slides with name - Average Revenue Per Subscription Telecommunications Dashboard. High quality pixels used in the PowerPoint design and ensures no pixilation when projected on both standard and wide screen display. Easily downloadable and save PPT slide. Presentation template can be projected in JPG and PDF format. Entirely editable as color, text and font can be edited. PPT design can form an integral part of multiple business topics presentation. Matching designs comes with different nodes and stages. Presentation diagram works well with Google slides.
-
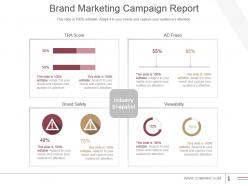 Brand marketing campaign report powerpoint guide
Presenting brand marketing campaign report powerpoint guide. This is a brand marketing campaign report powerpoint guide. This is a four stage process. The stages in this process are brand safety, industry snapshot, viewability, tra score, ad fraud.
-
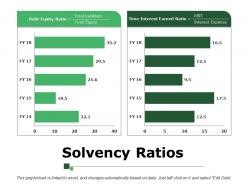 Solvency ratios powerpoint presentation
Presenting this set of slides with name - Solvency Ratios Powerpoint Presentation. This is a two stage process. The stages in this process are Solvency Ratios, Finance, Analysis, Marketing, Strategy, Business.
-
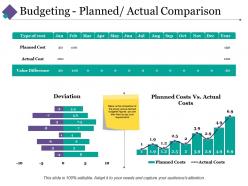 Budgeting planned actual comparison ppt pictures clipart images
Providing budgeting planned actual comparison PPT pictures clipart images. Presentation design can be shared in standard and widescreen view. High resolution ensures no pixel break even when shared with large viewers. PowerPoint template can be amended as required and transform into JPG and PDF format. Fully adjustable design with Google Slides as merge well. Ideas to share business communication effectively Easy to adapt and download with different nodes and stages.
-
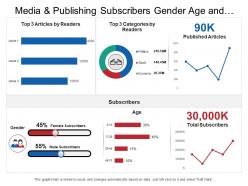 Media and publishing subscribers gender age and categories dashboard
Presenting this set of slides with name - Media And Publishing Subscribers Gender Age And Categories Dashboard. This is a six stage process. The stages in this process are Media And Publishing, Media Communication.
-
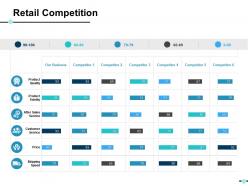 Retail competition ppt slides diagrams
Presenting this set of slides with name - Retail Competition Ppt Slides Diagrams. This is a four stage process. The stages in this process are Business, Management, Strategy, Analysis, Icons.
-
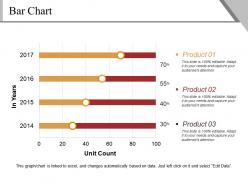 Bar chart template 3 powerpoint slide backgrounds
Presenting Bar Chart Template 3 PowerPoint Slide Backgrounds. This PowerPoint slide is completely editable so you can modify, font type, font color, shape and image according to your requirements. This Google Slides compatible PPT is available in 4:3 and 16:9 aspect ratios. Easy to download PPT layout and can be saved in different formats like JPG, PDF, and PNG.
-
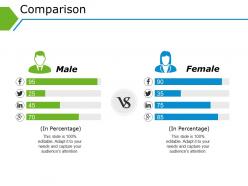 Comparison powerpoint topics template 1
Presenting comparison powerpoint topics template 1. This is a comparison powerpoint topics template 1. This is a two stage process. The stages in this process are male, female, compare, in percentage, business.
-
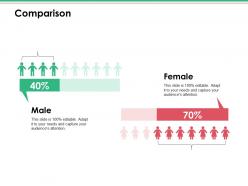 Comparison ppt infographic template model
Presenting this set of slides with name - Comparison Ppt Infographic Template Model. This is a two stage process. The stages in this process are Business, Management, Strategy, Analysis, Compare.
-
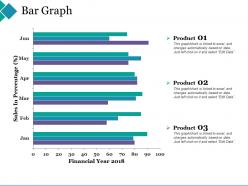 Bar graph sales in percentage financial
Presenting this set of slides with name - Bar Graph Sales In Percentage Financial. This is a three stage process. The stages in this process are Percentage, Product, Marketing, Management.
-
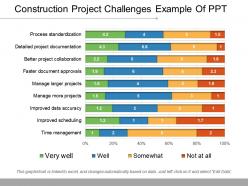 Construction project challenges example of ppt
Presenting, our construction project challenges example of PPT design. We have shown adjustable color, text, and font as per the need in the comparison bars here. We have provided a predesigned format with engaging and easy to comprehend infographic visuals. Following PPT deck can be Instantly downloaded and can be switched into jpg and pdf format. The ease of extension of logo and trademarks for personalization is provided. Supportive with a widescreen view without the intricacy of pixelation. This construction project layout is well-matched with Google Slides. Easily open in 4:3 and full-screen version 16:9 aster downloading.
-
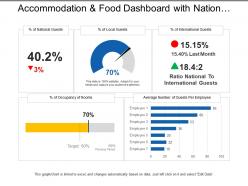 Accommodation and food dashboard with nation and local guests percentage
Presenting this set of slides with name - Accommodation And Food Dashboard With Nation And Local Guests Percentage. This is a five stage process. The stages in this process are Accommodation And Food, Shelter And Food, Accommodation And Beverages.
-
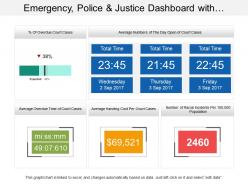 Emergency police and justice dashboard with overdue court cases
Presenting this set of slides with name - Emergency Police And Justice Dashboard With Overdue Court Cases. This is a five stage process. The stages in this process are Emergency, Police And Justice, Police And Emergency Services, Justice And Public Security.
-
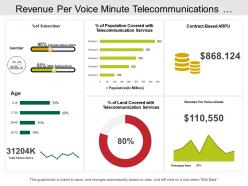 Revenue per voice minute telecommunications dashboard
Presenting this set of slides with name - Revenue Per Voice Minute Telecommunications Dashboard. Innovatively crafted Presentation design as it comes with amazing picture quality. Editing is possible with color, text, font and shape. Fast download and can be convert in JPEG and PDF format. PPT slide gives a specialized effect to your Presentation template. Preference customizes the PowerPoint template adding business name and icon. PPT diagram can be shared in standard and widescreen view. PPT graphic can be downloaded with different nodes and stages as required.
-
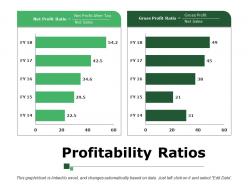 Profitability ratios ppt samples
Presenting this set of slides with name - Profitability Ratios Ppt Samples. This is a two stage process. The stages in this process are Profitability Ratios, Finance, Analysis, Marketing, Strategy, Business.
-
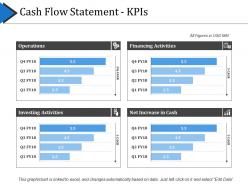 Cash flow statement kpis good ppt example
Presenting this set of slides with name - Cash Flow Statement Kpis Good Ppt Example. This is a four stage process. The stages in this process are Business, Operations, Financing Activities, Net Increase In Cash, Investing Activities.
-
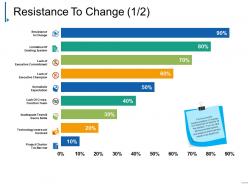 Resistance to change ppt slide design
Presenting resistance to change ppt slide design. This is a resistance to change ppt slide design. This is a nine stage process. The stages in this process are resistance to change, limitation of existing system, lack of executive commitment, unrealistic expectation, project charter too narrow.
-
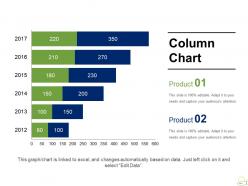 Column chart presentation powerpoint templates
Presenting the Column Chart Presentation PowerPoint Templates. This PPT theme is available in both 4:3 and 16:9 aspect ratios. As this PowerPoint template is 100% editable, you can modify the color, font size, font type, and shapes as per your requirements. This PPT presentation is Google Slides compatible hence it is easily accessible. You can download and save this PowerPoint layout in different formats like PDF, PNG, and JPG.
-
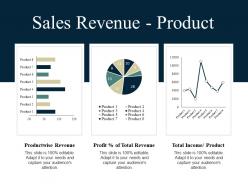 Sales revenue product ppt summary graphics pictures
Presenting this set of slides with name - Sales Revenue Product Ppt Summary Graphics Pictures. This is a three stage process. The stages in this process are Productwise Revenue, Total Revenue, Total Income, Business, Marketing.
-
 Comparison ppt file visuals
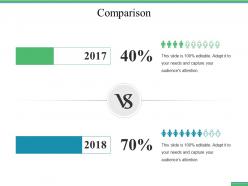
Presenting this set of slides with name - Comparison Ppt File Visuals. This is a two stage process. The stages in this process are Compare, Percentage, Finance, Business, Marketing.
-
 Xx is targeting a large addressable market ppt icon portrait
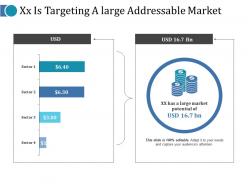
Presenting this set of slides with name - Xx Is Targeting A Large Addressable Market Ppt Icon Portrait. This is a two stage process. The stages in this process are Currency, Finance, Business, Symbol, Category.
-
 Relative performance summary ppt slide design
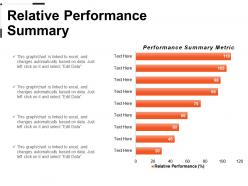
Presenting relative performance summary ppt slide design. This is a relative performance summary ppt slide design. This is a nine stage process. The stages in this process are performance analysis, performance assessment, performance evaluation, performance summary.
-
 Customer experience analytics business ppt professional grid
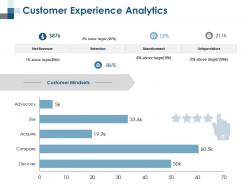
Presenting this set of slides with name - Customer Experience Analytics Business Ppt Professional Grid. This is a four stage process. The stages in this process are Compare, Discover, Acquire, Retention, Abandonment.
-
 Channel kpis ppt images gallery
Presenting channel kpis ppt images gallery. This is a channel kpis ppt images gallery. This is a four stage process. The stages in this process are sales density, personnel cost, real estate cost, inventory turnover, supermarkets, soft discount, hard discount.
-
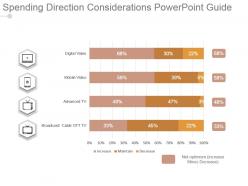 Spending direction considerations powerpoint guide
Presenting spending direction considerations powerpoint guide. Presenting spending direction considerations powerpoint guide. This is a spending direction considerations powerpoint guide. This is a four stage process. The stages in this process are digital video, mobile video, advanced tv, broadcast.
-
 Spending direction considerations powerpoint slide
Presenting spending direction considerations powerpoint slide. This is a spending direction considerations powerpoint slide. This is a four stage process. The stages in this process are digital video, mobile video, advanced tv, broadcast.
-
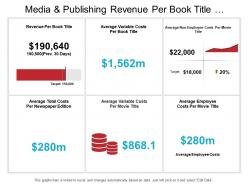 Media and publishing revenue per book title dashboard
Presenting this set of slides with name - Media And Publishing Revenue Per Book Title Dashboard. This is a six stage process. The stages in this process are Media And Publishing, Media Communication.
-
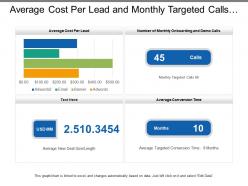 Average cost per lead and monthly targeted calls sales dashboard
Presenting this set of slides with name - Average Cost Per Lead And Monthly Targeted Calls Sales Dashboard. This is a four stage process. The stages in this process are Sales Dashboard, Sales Kpis, Sales Performance.
-
 Customer service dials per hour and call success rate dashboard
Presenting customer service dials per hour and call success rate dashboard presentation slide. Well-crafted graphics has been used in this template. This template is entirely adjustable with Google Slide. Have the tendency to increase the overall influence of your presentation. Quick to download and presented to be saved in JPEG, JPG or PDF format if required. You can personalize the template slide by adding your company information when required. Educational slides are available for guidance. This slide maintains the professionalism of the presentation. Graphics quality does not blur when projected on large screen.
-
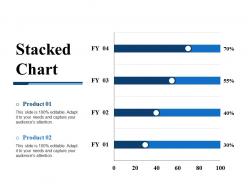 Stacked bar powerpoint slide influencers
Presenting this set of slides with name - Stacked Bar Powerpoint Slide Influencers. This is a four stage process. The stages in this process are Stacked Chart, Finance, Marketing, Analysis, Business.
-
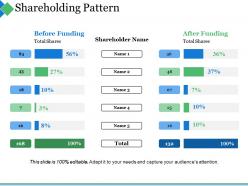 Shareholding pattern ppt summary professional
Presenting this set of slides with name - Shareholding Pattern Ppt Summary Professional. This is a five stage process. The stages in this process are Business, Marketing, Before Funding, Shareholder Name, After Funding.
-
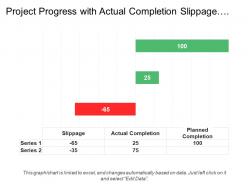 Project progress with actual completion slippage planned completion
Presenting this set of slides with name - Project Progress With Actual Completion Slippage Planned Completion. This is a three stage process. The stages in this process are Project Progress, Project Growth, Project Management.
-
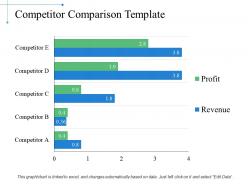 Competitor comparison powerpoint slide show
Presenting this set of slides with name - Competitor Comparison Powerpoint Slide Show. This is a five stage process. The stages in this process are Business, Marketing, Finance, Planning, Analysis.
-
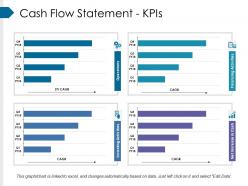 Cash flow statement kpis ppt background images
Presenting this set of slides with name - Cash Flow Statement Kpis Ppt Background Images. This is a four stage process. The stages in this process are Business, Marketing, Finance, Operations, Investing Activities, Net Increase In Cash, Financing Activities.
-
 Define role of leadership in cm ppt design
Presenting define role of leadership in cm ppt design. This is a define role of leadership in cm ppt design. This is a five stage process. The stages in this process are vision, energizing people, communication, charisma, competence.
-
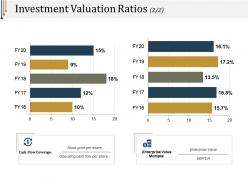 Investment valuation ratios ppt examples professional
Presenting investment valuation ratios ppt examples professional. This is a investment valuation ratios ppt examples professional. This is a two stage process. The stages in this process are business, marketing, strategy, slide bar, finance.
-
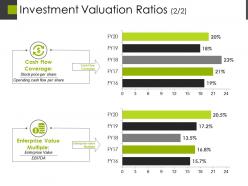 Investment valuation ratios powerpoint slide presentation examples
Presenting investment valuation ratios powerpoint slide presentation examples. This is a investment valuation ratios powerpoint slide presentation examples. This is a two stage process. The stages in this process are cash flow coverage, enterprise value multiple, business, marketing, finance.
-
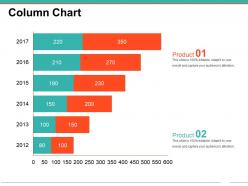 Column chart powerpoint presentation examples
Presenting column chart powerpoint presentation examples. This is a column chart powerpoint presentation examples. This is a two stage process. The stages in this process are finance, business, marketing, graph, strategy.
-
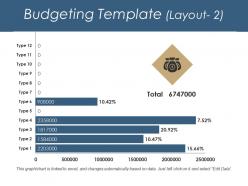 Budgeting template ppt icon
Presenting this set of slides with name - Budgeting Template Ppt Icon. This is a five stage process. The stages in this process are Finance, Analysis, Business, Strategy, Management.
-
 Performance of marketing channels ppt diagrams
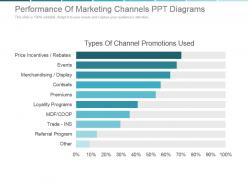
Presenting performance of marketing channels ppt diagrams. This is a performance of marketing channels ppt diagrams. This is a ten stage process. The stages in this process are price incentives, events, merchandising display, contests, premiums, loyalty program, referral program.
-
 Absenteeism rate in a company powerpoint graphics
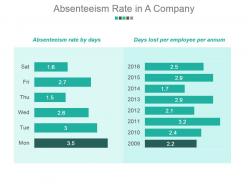
Presenting absenteeism rate in a company powerpoint graphics. This is a absenteeism rate in a company powerpoint graphics. This is a two stage process. The stages in this process are absenteeism rate by days, days lost per employee per annum.
-
 Country wise crowdfunding platforms powerpoint slide designs
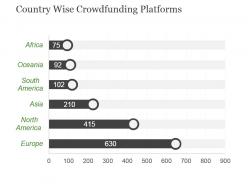
Presenting country wise crowdfunding platforms powerpoint slide designs. This is a country wise crowdfunding platforms powerpoint slide designs. This is a six stage process. The stages in this process are africa, oceania, south america, asia, north america, europe.
-
 Project management execution challenges ppt ideas
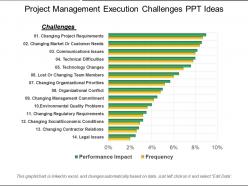
Presenting project management execution challenges PPT ideas PPT slide. Being a vector based PowerPoint model, it is completely editable and easy to modify. You will never have to create anything from scratch. The slide is hundred percent editable. With slight touch up done to the designing elements as per your preference and a little modification here and there you are ready to attract your audience. The PPT is compatible with Google Slides, multiple formats, and other software options. The visuals as used are of high resolution, and so projection on the wide screen will simply widen the view and not pixelate it.
-
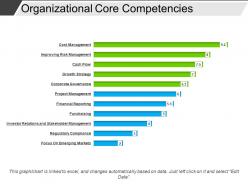 Organizational core competencies powerpoint templates
Presenting organizational core competencies PowerPoint template PPT slide. PPT’s content is adaptable to tailor-made the needs of individual professionals. Impressive high-resolution images which do not pixelate when projected on a wide screen. PPT is adjustable with multiple formats like JPEG, JPG, etc. There is a high level of compatibility with numerous software options. PPT is compatible with versions of Windows and Mac. Easy to download and edit as per the need. Special assistance in the form of pictorial instructions is given in the sample slides itself. It has a predesigned set of slides to save time and efforts. This is widely accessible by product managers, EXIM professionals, individual professionals, teachers, and students.
-
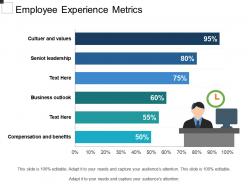 Employee experience metrics sample ppt files
Presenting employee experience metrics PPT slide. They are professionally designed Presentation graphics which are profitable for the Human resource managers, business managers and more. All the characteristics like the font, size, color, PPT image etc. are completely alterable according to your requirement. They are also well compatible with all the Google slides. They have easy and smooth downloading procedure too. They also provide an option to add your business logo too.
-
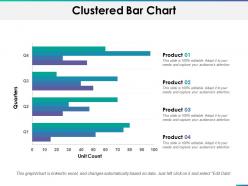 Clustered bar chart ppt summary design ideas
Presenting this set of slides with name - Clustered Bar Chart Ppt Summary Design Ideas. This is a four stage process. The stages in this process are Business, Management, Strategy, Analysis, Marketing.


