Charts, Graphs PowerPoint Designs, Presentation Charts Designs & PPT Graphics
- Sub Categories
-
- Arrows and Targets
- Bullet and Text Slides
- Charts and Graphs
- Circular Cycle Diagrams
- Concepts and Shapes
- Custom Flat Designs
- Dashboards and Measuring
- Flow Process
- Funnels
- Gears
- Growth
- Harvey Balls
- Idea Innovation and Light Bulbs
- Leadership
- Linear Process Diagrams
- Magnifying Glass
- Misc Other Graphics
- Opportunity and Handshake
- Organization Charts
- Puzzles
- Pyramids
- Roadmaps and Timelines
- Silhouettes
- Steps
- Strategic Planning Analysis
- SWOT Analysis
- Tables and Matrix
- Teamwork
- Technology and Communication
- Venn Diagrams
- Visuals and Illustrations
-
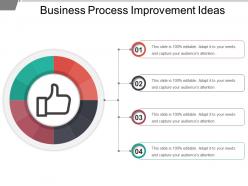 Business process improvement ideas powerpoint slide designs
Presenting business process improvement PPT slide template. This is exquisitely coordinated PPT design template beneficial for various business professionals. Easily resizable shapes, patterns, and matters etc. Genuine and admissible PPT Image with pliant data options. Adequately compatible with all operating software and all Google Slides. Easily convertible to PDF or JPG formats, unaffected high resolution PPT graphic when projected on a huge screen.
-
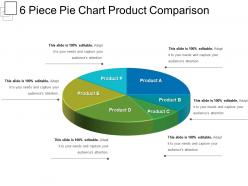 6 piece pie chart product comparison powerpoint graphics
SlideTeam would like to present to all of you our 100% customizable and user-friendly 6 piece pie chart product comparison PowerPoint graphics. This given deck of slides is fully alterable which lets you make numerous changes. The slideshow lets you save it in the format of either PDF or JPG as per your convenience. The PowerPoint presentation once downloaded can be viewed by you in widescreen display ratio of 16:9 or standards size display ratio of 4:3. The slides are very non- complex to use, as they are compatible with Google Slides. .
-
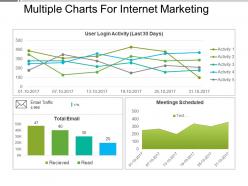 Multiple charts for internet marketing presentation outline
Presenting multiple charts for internet marketing presentation outline. Hasty download and quickly adapt into JPEG and PDF document. Preferences share PPT design in standard and widescreen display view. Accessibility edits the design with trade name, image, icon and tagline and merges with Google Slides. PowerPoint graphic is available with different nodes and stages. High quality presentation design comes with amendment options as color, text and font and other elements can be amended.
-
 3 steps upward trend icon example of ppt
Displaying 3 steps upward trend icon example of PPT design. Tailor the design with enterprise name, logo and tagline. PowerPoint layout is like-minded with Google Slides as can be merged at any stage. Color text and font can be modified as the presentation template is entirely modifiable. Fast and easy download with saving options. Adaptable with other software options PDF and JPG. PowerPoint graphic can be seen in both standard and widescreen display.
-
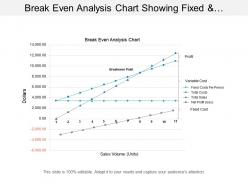 Break even analysis chart showing fixed and total costs
Presenting this set of slides with name - Break Even Analysis Chart Showing Fixed And Total Costs. This is a four stage process. The stages in this process are Break Even Analysis, Break Even Point, Break Even Level.
-
 Race starting point runners image
Presenting this set of slides with name - Race Starting Point Runners Image. This is a three stage process. The stages in this process are Start, On, Begin.
-
 Start on road image
Presenting this set of slides with name - Start On Road Image. This is a three stage process. The stages in this process are Start, On, Begin.
-
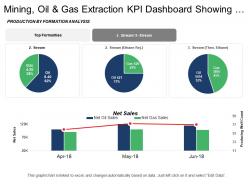 Mining oil and gas extraction kpi dashboard showing net sales and production by formation analysis
Presenting this set of slides with name - Mining Oil And Gas Extraction Kpi Dashboard Showing Net Sales And Production By Formation Analysis. This is a two stage process. The stages in this process are Mining, Oil And Gas Extraction, Refinery, Natural Gas.
-
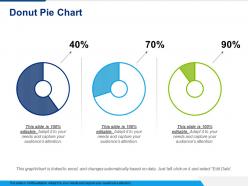 Donut pie chart powerpoint slide information
Presenting this set of slides with name - Donut Pie Chart Powerpoint Slide Information. This is a three stage process. The stages in this process are Business, Marketing, Chart, Percentage, Strategy.
-
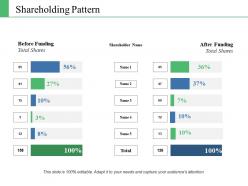 Shareholding pattern ppt infographic template slide download
Presenting this set of slides with name - Shareholding Pattern Ppt Infographic Template Slide Download. This is a six stage process. The stages in this process are Total Shares, Before Funding, After Funding, Shareholder Name.
-
 Line chart ppt summary templates
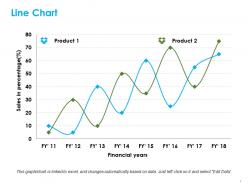
Presenting line chart PPT summary templates PPT slide. The line graph summary PowerPoint template designed by the professionals of SlideTeam to describe the huge amount of data. The run chart slide value gets edited as a user can link this slide with the Excel Sheet. The line chart summary slide is customizable in PowerPoint. The sale line graph example template is also compatible with Google Slide. A user can do modification such as font size, font type, color and dimensions in the run chart template to present the desired comparison between two things.
-
 Analytics bar chart circular icon
Presenting this set of slides with name - Analytics Bar Chart Circular Icon. This is a three stage process. The stages in this process are Bar Chart Icon, Bar Graph Icon, Data Chart Icon.
-
 Bar chart and dot graph analytics icon
Presenting this set of slides with name - Bar Chart And Dot Graph Analytics Icon. This is a three stage process. The stages in this process are Bar Chart Icon, Bar Graph Icon, Data Chart Icon.
-
 Donut chart investment ppt slides graphics template
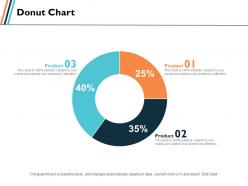
Presenting this set of slides with name - Donut Chart Investment Ppt Slides Graphics Template. This is a three stage process. The stages in this process are Finance, Analysis, Business, Investment, marketing.
-
 Comparison ppt professional summary
Presenting this set of slides with name - Comparison Ppt Professional Summary. This is a two stage process. The stages in this process are Business, Management, Strategy, Analysis, Marketing.
-
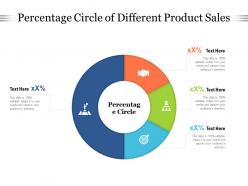 Percentage circle of different product sales
Presenting this set of slides with name Percentage Circle Of Different Product Sales. The topics discussed in these slides are Percentage Circle Of Different Product Sales. This is a completely editable PowerPoint presentation and is available for immediate download. Download now and impress your audience.
-
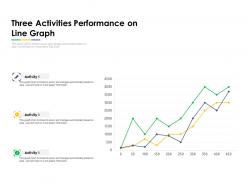 Three activities performance on line graph
Presenting this set of slides with name Three Activities Performance On Line Graph. The topics discussed in these slides is Three Activities Performance On Line Graph. This is a completely editable PowerPoint presentation and is available for immediate download. Download now and impress your audience.
-
 Declining chart icon with downward pointing arrows
Presenting this set of slides with name Declining Chart Icon With Downward Pointing Arrows. The topics discussed in these slide is Declining Chart Icon With Downward Pointing Arrows. This is a completely editable PowerPoint presentation and is available for immediate download. Download now and impress your audience.
-
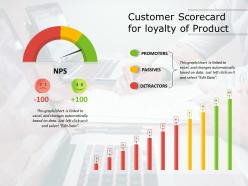 Customer scorecard for loyalty of product
Presenting this set of slides with name Customer Scorecard For Loyalty Of Product. The topics discussed in these slides are Detractors, Passives, Promoters. This is a completely editable PowerPoint presentation and is available for immediate download. Download now and impress your audience.
-
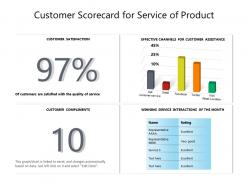 Customer scorecard for service of product
Presenting this set of slides with name Customer Scorecard For Service Of Product. The topics discussed in these slides are Customer Satisfaction, Customer Compliments, Customer Assistance, Quality, Service. This is a completely editable PowerPoint presentation and is available for immediate download. Download now and impress your audience.
-
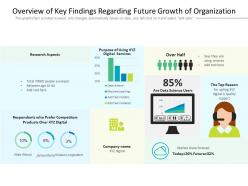 Overview of key findings regarding future growth of organization
Presenting this set of slides with name Overview Of Key Findings Regarding Future Growth Of Organization. The topics discussed in these slides are Research Aspects, Digital Services, Products, Competitors, Data. This is a completely editable PowerPoint presentation and is available for immediate download. Download now and impress your audience.
-
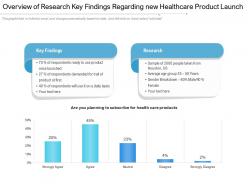 Overview of research key findings regarding new healthcare product launch
Presenting this set of slides with name Overview Of Research Key Findings Regarding New Healthcare Product Launch. The topics discussed in these slides are Product, Average, Demand, Research, Planning. This is a completely editable PowerPoint presentation and is available for immediate download. Download now and impress your audience.
-
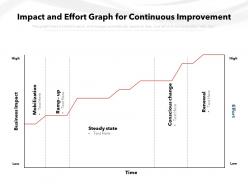 Impact and effort graph for continuous improvement
Presenting this set of slides with name Impact And Effort Graph For Continuous Improvement. The topics discussed in these slides are Business, Continuous, Mobilization. This is a completely editable PowerPoint presentation and is available for immediate download. Download now and impress your audience.
-
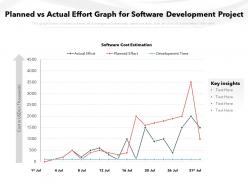 Planned vs actual effort graph for software development project
Presenting this set of slides with name Planned Vs Actual Effort Graph For Software Development Project. The topics discussed in these slides are Planned Effort, Actual Effort, Development Time. This is a completely editable PowerPoint presentation and is available for immediate download. Download now and impress your audience.
-
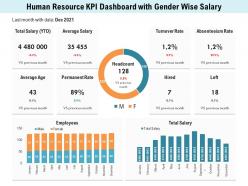 Human resource kpi dashboard with gender wise salary
Presenting our well structured Human Resource KPI Dashboard With Gender Wise Salary. The topics discussed in this slide are Turnover Rate, Employees, Average Age. This is an instantly available PowerPoint presentation that can be edited conveniently. Download it right away and captivate your audience.
-
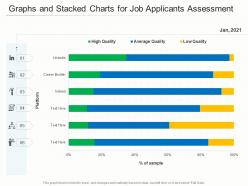 Graphs and stacked charts for job applicants assessment
Presenting our well-structured Graphs And Stacked Charts For Job Applicants Assessment. The topics discussed in this slide are Graphs And Stacked Charts For Job Applicants Assessment. This is an instantly available PowerPoint presentation that can be edited conveniently. Download it right away and captivate your audience.
-
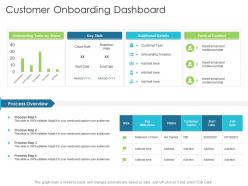 Customer onboarding dashboard techniques reduce customer onboarding time
Present the topic in a bit more detail with this Customer Onboarding Dashboard Techniques Reduce Customer Onboarding Time. Use it as a tool for discussion and navigation on Process Overview, Customer Owner, Key Milestone, Retention Rate. This template is free to edit as deemed fit for your organization. Therefore download it now.
-
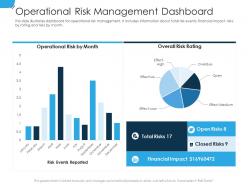 Operational risk management dashboard establishing operational risk framework organization
Present the topic in a bit more detail with this Operational Risk Management Dashboard Establishing Operational Risk Framework Organization. Use it as a tool for discussion and navigation on Risks, Financial Impact . This template is free to edit as deemed fit for your organization. Therefore download it now.
-
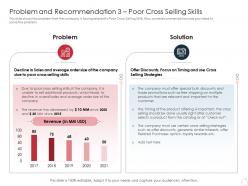 Problem and recommendation 3 poor cross selling skills latest trends can provide competitive advantage company
This slide shows the problem that the company is facing related to Poor Cross Selling Skills. Also, some recommendations are provided to solve the problem. Deliver an outstanding presentation on the topic using this Problem And Recommendation 3 Poor Cross Selling Skills Latest Trends Can Provide Competitive Advantage Company. Dispense information and present a thorough explanation of Customer, Products, Revenue, Average, Purchases using the slides given. This template can be altered and personalized to fit your needs. It is also available for immediate download. So grab it now.
-
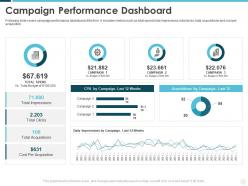 Campaign performance dashboard building effective brand strategy attract customers
Following slide covers campaign performance dashboard of the firm. It includes metrics such as total spend, total impressions, total clicks, total acquisitions and cost per acquisition.Present the topic in a bit more detail with this Campaign Performance Dashboard Building Effective Brand Strategy Attract Customers. Use it as a tool for discussion and navigation on Cost Per Acquisition, Total Impressions, Total Acquisitions. This template is free to edit as deemed fit for your organization. Therefore download it now.
-
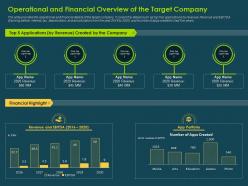 Operational and financial overview of the target company investment banking collection
The slide provides the operational and financial details of the target company. It covers the details such as top five applications by revenue Revenue and EBITDA Earning before, interest, tax, depreciation, and amortization from the year 2016 to 2020 and Number of apps created in last five years Present the topic in a bit more detail with this Operational And Financial Overview Of The Target Company Investment Banking Collection. Use it as a tool for discussion and navigation on Operational And Financial Overview Of The Target Company. This template is free to edit as deemed fit for your organization. Therefore download it now.
-
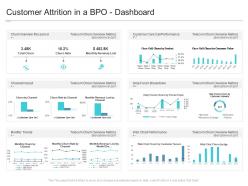 Customer attrition in a bpo dashboard reasons high customer attrition rate
Present the topic in a bit more detail with this Customer Attrition In A BPO Dashboard Reasons High Customer Attrition Rate. Use it as a tool for discussion and navigation on Telecom Churn Overview Metrics, Customer Care Call Performance, Telecom Churn Overview Metrics. This template is free to edit as deemed fit for your organization. Therefore download it now.
-
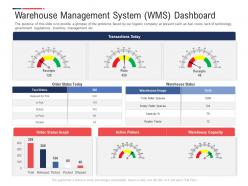 Warehouse management system dashboard inbound outbound logistics management process ppt grid
The purpose of this slide is to provide a glimpse of the problems faced by our logistic company at present such as fuel costs, lack of technology, government regulations, inventory management etc. Present the topic in a bit more detail with this Warehouse Management System Dashboard Inbound Outbound Logistics Management Process Ppt Grid. Use it as a tool for discussion and navigation on Warehouse Management System WMS Dashboard. This template is free to edit as deemed fit for your organization. Therefore download it now.
-
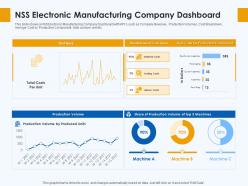 Nss electronic manufacturing company dashboard skill gap manufacturing company
This slide shows a NSS Electronic Manufacturing Company Dashboard with KPIs such as Company Revenue, Production Volumes, Cost Breakdown, Average Cost by Production Component, total cost per unit etc. Present the topic in a bit more detail with this NSS Electronic Manufacturing Company Dashboard Skill Gap Manufacturing Company. Use it as a tool for discussion and navigation on NSS Electronic Manufacturing Company Dashboard. This template is free to edit as deemed fit for your organization. Therefore download it now.
-
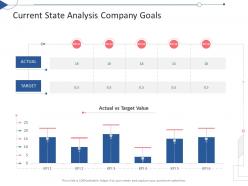 Current state analysis company goals value tactical planning needs assessment ppt pictures
Present the topic in a bit more detail with this Current State Analysis Company Goals Value Tactical Planning Needs Assessment Ppt Pictures. Use it as a tool for discussion and navigation on Current State Analysis Company Goals. This template is free to edit as deemed fit for your organization. Therefore download it now.
-
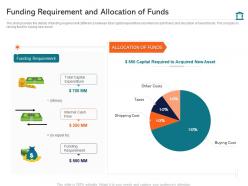 Funding requirement and allocation of funds investment pitch presentation raise funds ppt layouts
The slide provides the details of funding requirement difference between total capital expenditure and internal cash flows and allocation of raised funds. The company is raising fund for buying new asset. Present the topic in a bit more detail with this Funding Requirement And Allocation Of Funds Investment Pitch Presentation Raise Funds Ppt Layouts. Use it as a tool for discussion and navigation on Total Capital Expenditure, Funding Requirement, Cost. This template is free to edit as deemed fit for your organization. Therefore download it now.
-
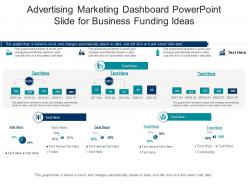 Advertising marketing dashboard powerpoint slide for business funding ideas
This is a Advertising Marketing Dashboard Powerpoint Slide For Business Funding Ideas that you can use to present real-time information about your business. With a variety of graphical representations that are in-line with the current trends, this is a great way to display quantified data and stats. This is also a great PowerPoint slide to make informed decisions based on the data and results depicted. Since this template can accommodate a lot of statistical information in one-go it can be put to use by different department heads of the organization. This PPT slide can also be used to present a thorough discussion on various KPIs, all excel-linked and susceptible to innumerable changes. Thus helping in the portrayal of calculative data in a highly professional format. Not only this, but it can also be reproduced in JPG, PNG, and PDF formats. Therefore, reinvent the wheel by downloading this PPT slide now.
-
 Company performance dashboard powerpoint slide for loan plan savings
This Company Performance Dashboard Powerpoint Slide For Loan Plan Savings is designed using a data-driven approach to help you display important stats, figures, insights, and metrics related to the topic of your choice. You can also deploy this slide to present reports on a specific business project and strategy. It is tailor-made using a mix of KPIs that make the information easily understandable. Project managers, executives, or other department heads can grab this readily available PowerPoint presentation slide to present relevant information. It can be further used for monitoring and identifying various trends doing rounds in the industry of your choice. The biggest feature of this PowerPoint layout is that it is designed using vector-based and high-quality graphics that can be reproduced as PNGs, JPGs, and PDFs. It also works well with Google Slides and PowerPoint. Therefore, giving a lot of options to work with.
-
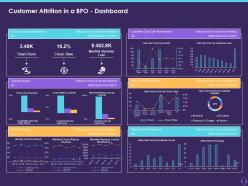 Customer attrition in a bpo dashboard customer attrition in a bpo slide
Present the topic in a bit more detail with this Customer Attrition In A BPO Dashboard Customer Attrition In A BPO Slide. Use it as a tool for discussion and navigation on Monthly Revenue, Customer Tenure, Product. This template is free to edit as deemed fit for your organization. Therefore download it now.
-
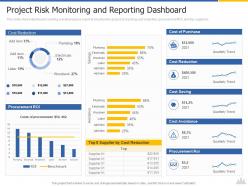 Project risk monitoring and reporting dashboard construction project risk landscape ppt professional
This slide shows dashboard covering overall progress report of construction project by tracking cost reduction, procurement ROI, and top suppliers. Present the topic in a bit more detail with this Project Risk Monitoring And Reporting Dashboard Construction Project Risk Landscape Ppt Professional. Use it as a tool for discussion and navigation on Cost Reduction, Procurement Roi, Cost Of Purchase, Cost Reduction, Cost Saving. This template is free to edit as deemed fit for your organization. Therefore download it now.
-
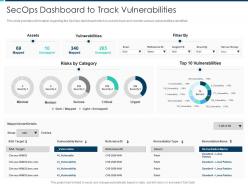 Secops dashboard to track vulnerabilities security operations integration ppt icons
This slide provides information regarding the SecOps dashboard which is used to track and monitor various vulnerabilities identified. Present the topic in a bit more detail with this Secops Dashboard To Track Vulnerabilities Security Operations Integration Ppt Icons. Use it as a tool for discussion and navigation on Secops Dashboard To Track Vulnerabilities. This template is free to edit as deemed fit for your organization. Therefore download it now.
-
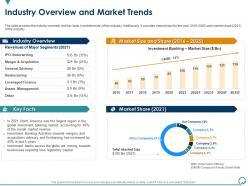 Industry overview and market trends general and ipo deal ppt information
The slide provides the industry overview and key facts market trends of the industry. Additionally, it provides market size for the year 2016 to 2025 and market share 2021 of the industry. Present the topic in a bit more detail with this Industry Overview And Market Trends General And IPO Deal Ppt Information. Use it as a tool for discussion and navigation on Industry Overview And Market Trends. This template is free to edit as deemed fit for your organization. Therefore download it now.
-
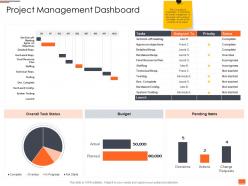 Project planning and governance project management dashboard ppt portfolio
Present the topic in a bit more detail with this Project Planning And Governance Project Management Dashboard Ppt Portfolio. Use it as a tool for discussion and navigation on Budget, Technical, Objectives, System Testing. This template is free to edit as deemed fit for your organization. Therefore download it now.
-
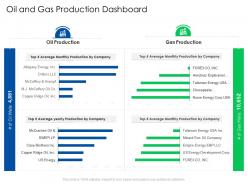 Oil and gas production dashboard global energy outlook challenges recommendations
Present the topic in a bit more detail with this Oil And Gas Production Dashboard Global Energy Outlook Challenges Recommendations. Use it as a tool for discussion and navigation on Oil And Gas Production Dashboard. This template is free to edit as deemed fit for your organization. Therefore download it now.
-
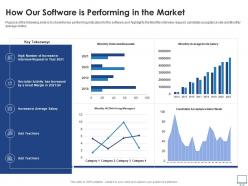 How our software is performing in the market recruitment industry investor funding elevator ppt slides
Purpose of the following slide is to show the key performing indicators for the software as it highlights the Monthly interview request, candidate acceptance rate and Monthly average invites Deliver an outstanding presentation on the topic using this How Our Software Is Performing In The Market Recruitment Industry Investor Funding Elevator Ppt Slides. Dispense information and present a thorough explanation of Key Takeaways, Monthly Interview Requests, Monthly Average Invite Salary using the slides given. This template can be altered and personalized to fit your needs. It is also available for immediate download. So grab it now.
-
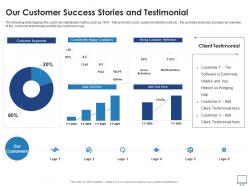 Our customer success stories and testimonial recruitment industry investor funding elevator ppt rules
The following slide displays the customer satisfaction metrics such as NPS Net promoter score, customer retention rate etc., the provided slide also provides an overview of the customer testimonials and the key customers logo Present the topic in a bit more detail with this Our Customer Success Stories And Testimonial Recruitment Industry Investor Funding Elevator Ppt Rules. Use it as a tool for discussion and navigation on Customer Segments, Consistently Happy Customers, Strong Customer Retention This template is free to edit as deemed fit for your organization. Therefore download it now.
-
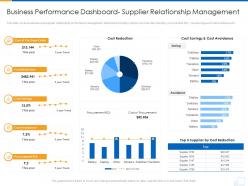 Business performance dashboard supplier relationship management supplier strategy
This slide covers business and supplier relationship performance management dashboard including metrics such as cist reduction, procurement ROI, cost savings and cost avoidance etc. Present the topic in a bit more detail with this Business Performance Dashboard Supplier Relationship Management Supplier Strategy. Use it as a tool for discussion and navigation on Business Performance Dashboard Supplier Relationship Management. This template is free to edit as deemed fit for your organization. Therefore download it now.
-
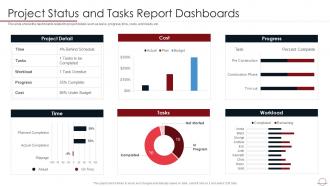 Best Practices For Successful Project Management Status And Tasks Report Dashboards
This slide shows the dashboards related to project details such as tasks, progress, time, costs, workloads, etc. Present the topic in a bit more detail with this Best Practices For Successful Project Management Status And Tasks Report Dashboards. Use it as a tool for discussion and navigation on Project Status And Tasks Report Dashboards. This template is free to edit as deemed fit for your organization. Therefore download it now.
-
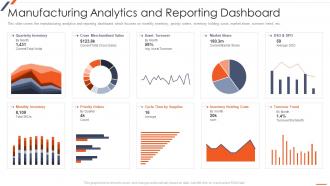 Strategic Planning For Industrial Marketing Manufacturing Analytics And Reporting Dashboard
This slide covers the manufacturing analytics and reporting dashboard which focuses on monthly inventory, priority orders, inventory holding costs, market share, turnover trend, etc. Deliver an outstanding presentation on the topic using this Strategic Planning For Industrial Marketing Manufacturing Analytics And Reporting Dashboard. Dispense information and present a thorough explanation of Manufacturing, Analytics, Dashboard using the slides given. This template can be altered and personalized to fit your needs. It is also available for immediate download. So grab it now.
-
 Financial Us Equity Market Ownership Report Analysis
The following slide highlights the USA market report of equity Market which includes households, mutual funds, and foreign investors. Introducing our Financial Us Equity Market Ownership Report Analysis set of slides. The topics discussed in these slides are Ownership, Analysis, Financial. This is an immediately available PowerPoint presentation that can be conveniently customized. Download it and convince your audience.
-
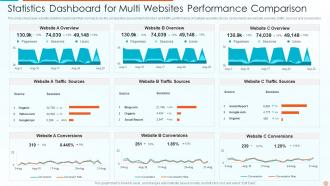 Statistics Dashboard For Multi Websites Performance Comparison
This slide showcases website statistics dashboard that can help to do the comparative assessment of visitors and traffic performance of multiple websites. Its key components are website overview, traffic sources and conversions Presenting our well-structured Statistics Dashboard For Multi Websites Performance Comparison. The topics discussed in this slide are Statistics, Dashboard, Performance, Comparison. This is an instantly available PowerPoint presentation that can be edited conveniently. Download it right away and captivate your audience.
-
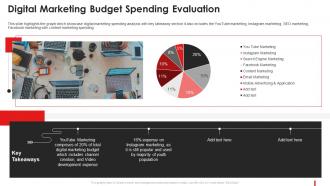 Digital Marketing Budget Spending Marketing Guide Promote Brand Youtube Channel
This slide highlights the graph which showcase digital marketing spending analysis with key takeaway section it also includes the YouTube marketing, Instagram marketing, SEO marketing, Facebook marketing with content marketing spending. Deliver an outstanding presentation on the topic using this Digital Marketing Budget Spending Marketing Guide Promote Brand Youtube Channel. Dispense information and present a thorough explanation of Digital Marketing Budget Spending Evaluation using the slides given. This template can be altered and personalized to fit your needs. It is also available for immediate download. So grab it now.
-
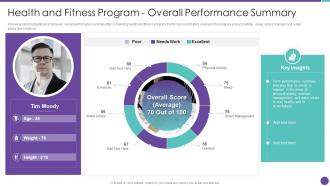 Playbook Employee Wellness Health And Fitness Program Overall Performance Summary
Following slide highlights an employees overall performance summary after completing health and fitness program. Performance indicators covered in the slide are physical activity, sleep, stress management, water intake and emotions. Deliver an outstanding presentation on the topic using this Playbook Employee Wellness Health And Fitness Program Overall Performance Summary. Dispense information and present a thorough explanation of Health And Fitness Program Overall Performance Summary using the slides given. This template can be altered and personalized to fit your needs. It is also available for immediate download. So grab it now.
-
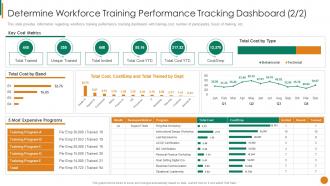 Determine Workforce Training Performance Tracking Staff Mentoring Playbook
This slide provides information regarding workforce training performance tracking dashboard with training cost, number of participants, hours of training, etc. Deliver an outstanding presentation on the topic using this Determine Workforce Training Performance Tracking Staff Mentoring Playbook. Dispense information and present a thorough explanation of Determine Workforce Training Performance Tracking Dashboard using the slides given. This template can be altered and personalized to fit your needs. It is also available for immediate download. So grab it now.
-
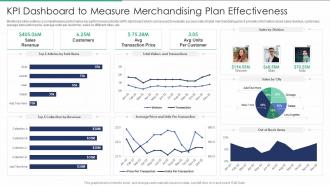 KPI Dashboard Snapshot To Measure Merchandising Plan Effectiveness
Mentioned slide outlines a comprehensive performance key performance indicator KPI dashboard which can be used to evaluate success rate of retail merchandising plan. It provides information about sales revenue, customers, average transaction price, average units per customer, sales by different cities, etc. Presenting our well structured KPI Dashboard To Measure Merchandising Plan Effectiveness. The topics discussed in this slide are Sales Revenue, Customers, Avg Transaction Price. This is an instantly available PowerPoint presentation that can be edited conveniently. Download it right away and captivate your audience.
-
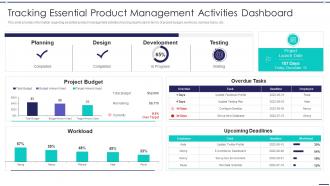 Agile Digitization For Product Tracking Essential Product Management Activities Dashboard
This slide provides information regarding essential product management activities tracking dashboard in terms of project budget, workload, overdue tasks, etc. Deliver an outstanding presentation on the topic using this Agile Digitization For Product Tracking Essential Product Management Activities Dashboard. Dispense information and present a thorough explanation of Planning, Development, Testing, Design, Project Launch Date using the slides given. This template can be altered and personalized to fit your needs. It is also available for immediate download. So grab it now.
-
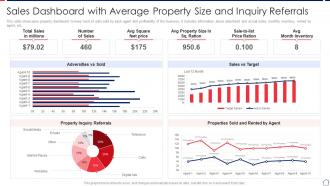 Sales Dashboard With Average Property Size And Inquiry Referrals
This slide showcases property dashboard to keep track of units sold by each agent and profitability of the business. It includes information about advertised and actual sales, monthly inventory, rented by agent, etc. Presenting our well structured Sales Dashboard With Average Property Size And Inquiry Referrals. The topics discussed in this slide are Social Media, Emails, Television, Calls, Digital Ads. This is an instantly available PowerPoint presentation that can be edited conveniently. Download it right away and captivate your audience.
-
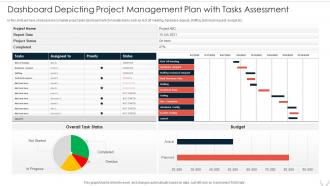 Dashboard Depicting Project Management Plan With Tasks Assessment
In this slide we have showcased a complete project plan dashboard which includes tasks such as kick off meeting, hardware request, staffing, technical request, budget etc. Introducing our Dashboard Depicting Project Management Plan With Tasks Assessment set of slides. The topics discussed in these slides are Management, Assessment, Dashboard, Depicting. This is an immediately available PowerPoint presentation that can be conveniently customized. Download it and convince your audience.
-
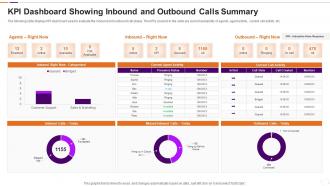 KPI Dashboard Showing Inbound And Outbound Calls Summary
The following slide displays KPI dashboard used to evaluate the inbound and outbound call status. The KPIs covered in the slide are current availability of agents, agent activity, current call activity etc. Introducing our KPI Dashboard Showing Inbound And Outbound Calls Summary set of slides. The topics discussed in these slides are Customer Support, Sales And Marketing. This is an immediately available PowerPoint presentation that can be conveniently customized. Download it and convince your audience.
-
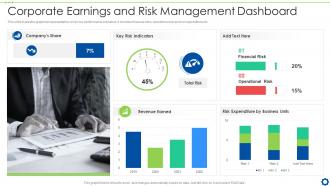 Corporate Earnings And Risk Management Dashboard
This slide illustrates graphical representation of risk key performance indicators. It includes financial risks, operational risk and risk expenditure etc. Presenting our well structured Corporate Earnings And Risk Management Dashboard. The topics discussed in this slide are Companys Share, Key Risk Indicators, Revenue Earned, Risk Expenditure by Business Units. This is an instantly available PowerPoint presentation that can be edited conveniently. Download it right away and captivate your audience.


