Charts, Graphs PowerPoint Designs, Presentation Charts Designs & PPT Graphics
- Sub Categories
-
- Arrows and Targets
- Bullet and Text Slides
- Charts and Graphs
- Circular Cycle Diagrams
- Concepts and Shapes
- Custom Flat Designs
- Dashboards and Measuring
- Flow Process
- Funnels
- Gears
- Growth
- Harvey Balls
- Idea Innovation and Light Bulbs
- Leadership
- Linear Process Diagrams
- Magnifying Glass
- Misc Other Graphics
- Opportunity and Handshake
- Organization Charts
- Puzzles
- Pyramids
- Roadmaps and Timelines
- Silhouettes
- Steps
- Strategic Planning Analysis
- SWOT Analysis
- Tables and Matrix
- Teamwork
- Technology and Communication
- Venn Diagrams
- Visuals and Illustrations
-
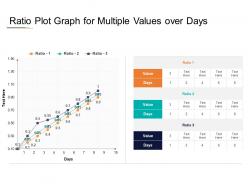 Ratio plot graph for multiple values over days
Presenting this set of slides with name Ratio Plot Graph For Multiple Values Over Days. The topics discussed in these slides are Value, Days, Ratio. This is a completely editable PowerPoint presentation and is available for immediate download. Download now and impress your audience.
-
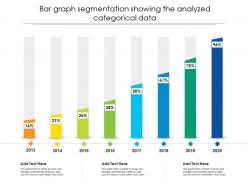 Bar graph segmentation showing the analyzed categorical data
Presenting this set of slides with name Bar Graph Segmentation Showing The Analyzed Categorical Data. The topics discussed in these slide is Bar Graph Segmentation Showing The Analyzed Categorical Data. This is a completely editable PowerPoint presentation and is available for immediate download. Download now and impress your audience.
-
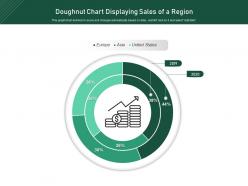 Doughnut chart displaying sales of a region
Presenting this set of slides with name Doughnut Chart Displaying Sales Of A Region. The topics discussed in these slide is Doughnut Chart Displaying Sales Of A Region. This is a completely editable PowerPoint presentation and is available for immediate download. Download now and impress your audience.
-
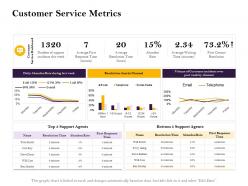 Customer service metrics week ppt powerpoint presentation ideas vector
Presenting this set of slides with name Customer Service Metrics Week Ppt Powerpoint Presentation Ideas Vector. The topics discussed in these slides are Service, Social Media, Resolution. This is a completely editable PowerPoint presentation and is available for immediate download. Download now and impress your audience.
-
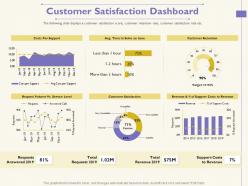 Customer satisfaction dashboard less than ppt powerpoint presentation infographics gallery
The following slide displays a customer satisfaction score, customer retention rate, customer satisfaction rate etc. Presenting this set of slides with name Customer Satisfaction Dashboard Less Than Ppt Powerpoint Presentation Infographics Gallery. The topics discussed in these slides are Revenue, Costs, Customer Satisfaction. This is a completely editable PowerPoint presentation and is available for immediate download. Download now and impress your audience.
-
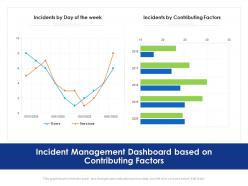 Incident management dashboard based on contributing factors
Presenting this set of slides with name Incident Management Dashboard Based On Contributing Factors. The topics discussed in these slide is Incident Management Dashboard Based On Contributing Factors. This is a completely editable PowerPoint presentation and is available for immediate download. Download now and impress your audience.
-
 Business intelligence kpi dashboard score ppt powerpoint background images
Presenting this set of slides with name Business Intelligence KPI Dashboard Score Ppt Powerpoint Background Images. The topics discussed in these slides are Revenue, Projections, Locations, Growth, Sales. This is a completely editable PowerPoint presentation and is available for immediate download. Download now and impress your audience.
-
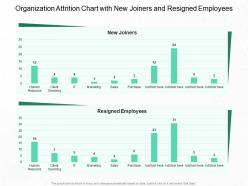 Organization attrition chart with new joiners and resigned employees
Presenting this set of slides with name Organization Attrition Chart With New Joiners And Resigned Employees. The topics discussed in these slides are Organization Attrition Chart With New Joiners And Resigned Employees. This is a completely editable PowerPoint presentation and is available for immediate download. Download now and impress your audience.
-
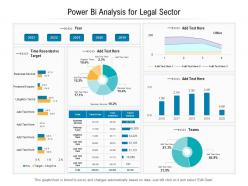 Power bi analysis for legal sector
Presenting this set of slides with name Power Bi Analysis For Legal Sector. The topics discussed in these slides are Business, Services, Target. This is a completely editable PowerPoint presentation and is available for immediate download. Download now and impress your audience.
-
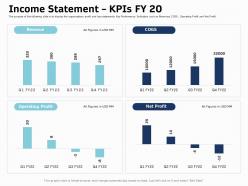 Income statement kpis fy 20 net profit ppt powerpoint presentation styles rules
The purpose of the following slide is to display the organizations profit and loss statements Key Performance Indicators such as Revenues COGS Operating Profit and Net Profit. Presenting this set of slides with name Income Statement Kpis Fy 20 Net Profit Ppt Powerpoint Presentation Styles Rules. The topics discussed in these slides are Revenue, Operating Profit, Net Profit, COGS. This is a completely editable PowerPoint presentation and is available for immediate download. Download now and impress your audience.
-
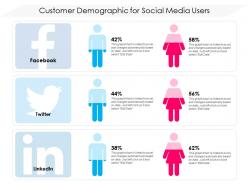 Customer demographic for social media users
Presenting this set of slides with name Customer Demographic For Social Media Users. The topics discussed in these slides are Facebook, Twitter, Linkedin. This is a completely editable PowerPoint presentation and is available for immediate download. Download now and impress your audience.
-
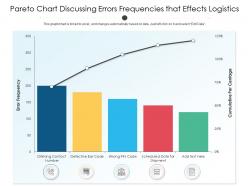 Pareto chart discussing errors frequencies that effects logistics
Presenting this set of slides with name Pareto Chart Discussing Errors Frequencies That Effects Logistics. The topics discussed in these slide is Pareto Chart Discussing Errors Frequencies That Effects Logistics. This is a completely editable PowerPoint presentation and is available for immediate download. Download now and impress your audience.
-
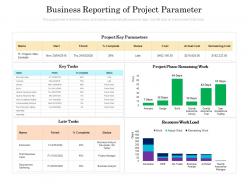 Business reporting of project parameter
Presenting this set of slides with name Business Reporting Of Project Parameter. The topics discussed in these slides are Project Phase Remaining Work, Resource Work Load, Cost. This is a completely editable PowerPoint presentation and is available for immediate download. Download now and impress your audience.
-
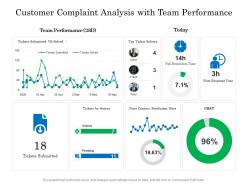 Customer complaint analysis with team performance
Presenting this set of slides with name Customer Complaint Analysis With Team Performance. The topics discussed in these slides are Customer Complaint Analysis With Team Performance. This is a completely editable PowerPoint presentation and is available for immediate download. Download now and impress your audience.
-
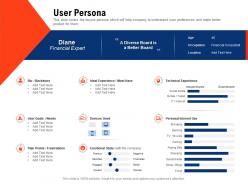 User persona requirement gathering methods ppt powerpoint presentation infographics smartart
This slide covers the buyers persona which will help company to understand user preferences and make better product for them.Present the topic in a bit more detail with this User Persona Requirement Gathering Methods Ppt Powerpoint Presentation Infographics Smartart. Use it as a tool for discussion and navigation on technical experience, ideal experience, financial expert. This template is free to edit as deemed fit for your organization. Therefore download it now.
-
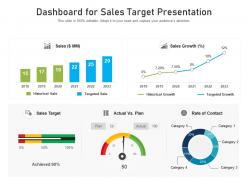 Dashboard for sales target presentation
Introducing our Dashboard For Sales Target Presentation set of slides. The topics discussed in these slides are Sales Target, Sales Growth, Targeted Growth. This is an immediately available PowerPoint presentation that can be conveniently customized. Download it and convince your audience.
-
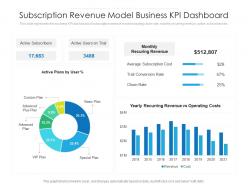 Subscription revenue model business kpi dashboard
Presenting our well structured Subscription Revenue Model Business Kpi Dashboard. The topics discussed in this slide are Monthly Recuring Revenue, Average Subscription Cost, Trail Conversion Rate, Active Subscribers Active Users On Trial, Active Subscribers Active Users On Trial. This is an instantly available PowerPoint presentation that can be edited conveniently. Download it right away and captivate your audience.
-
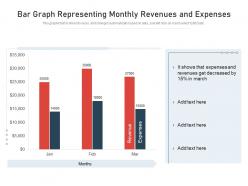 Bar graph representing monthly revenues and expenses
This graph or chart is linked to excel, and changes automatically based on data. Just left click on it and select Edit Data. Introducing our Bar Graph Representing Monthly Revenues And Expenses set of slides. The topics discussed in these slides are Bar Graph Representing Monthly Revenues And Expenses. This is an immediately available PowerPoint presentation that can be conveniently customized. Download it and convince your audience.
-
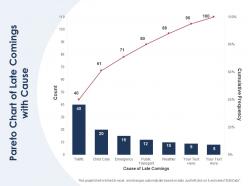 Pareto chart of late comings with cause
Presenting our well-structured Pareto Chart Of Late Comings With Cause. The topics discussed in this slide are Pareto Chart Of Late Comings With Cause. This is an instantly available PowerPoint presentation that can be edited conveniently. Download it right away and captivate your audience.
-
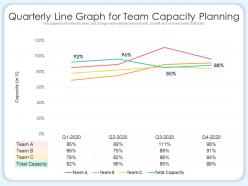 Quarterly line graph for team capacity planning
This graph or chart is linked to excel, and changes automatically based on data. Just left click on it and select Edit Data. Introducing our Quarterly Line Graph For Team Capacity Planning set of slides. The topics discussed in these slides are Quarterly Line Graph For Team Capacity Planning. This is an immediately available PowerPoint presentation that can be conveniently customized. Download it and convince your audience.
-
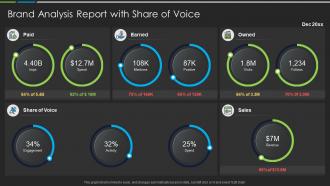 Brand analysis report with share of voice
Presenting our well structured Brand Analysis Report With Share Of Voice. The topics discussed in this slide are Paid, Earned, Sales. This is an instantly available PowerPoint presentation that can be edited conveniently. Download it right away and captivate your audience.
-
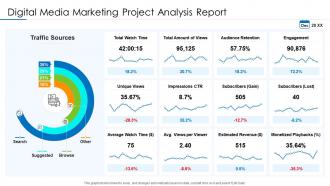 Digital media marketing project analysis report
Presenting our well structured Digital Media Marketing Project Analysis Report. The topics discussed in this slide are Estimated Revenue, Traffic Sources. This is an instantly available PowerPoint presentation that can be edited conveniently. Download it right away and captivate your audience.
-
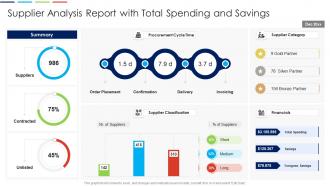 Supplier analysis report with total spending and savings
Introducing our Supplier Analysis Report With Total Spending And Savings set of slides. The topics discussed in these slides are Contracted, Suppliers, Unlisted. This is an immediately available PowerPoint presentation that can be conveniently customized. Download it and convince your audience.
-
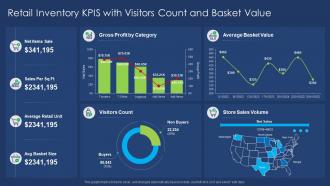 Retail inventory kpis with visitors count and basket value
Introducing our Retail Inventory KPIS With Visitors Count And Basket Value set of slides. The topics discussed in these slides are Average Retail Unit, Sales, Gross Profit. This is an immediately available PowerPoint presentation that can be conveniently customized. Download it and convince your audience.
-
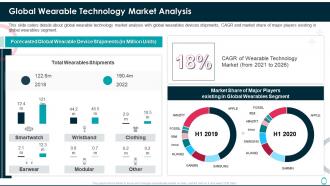 Fitbit investor funding elevator pitch deck global wearable technology market analysis
This slide caters details about global wearable technology market analysis with global wearables devices shipments, CAGR and market share of major players existing in global wearables segment. Present the topic in a bit more detail with this Fitbit Investor Funding Elevator Pitch Deck Global Wearable Technology Market Analysis. Use it as a tool for discussion and navigation on Global Wearable Technology Market Analysis. This template is free to edit as deemed fit for your organization. Therefore download it now.
-
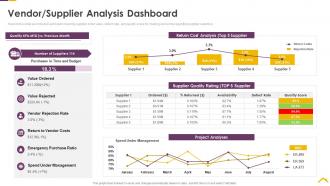 Risk assessment strategies for real estate vendor supplier analysis dashboard
Here in this slide we include Dashboard covering supplier order value, defect rate, and quality score for making decisions regarding supplier selection. Present the topic in a bit more detail with this Risk Assessment Strategies For Real Estate Vendor Supplier Analysis Dashboard. Use it as a tool for discussion and navigation on Vendor Supplier Analysis Dashboard. This template is free to edit as deemed fit for your organization. Therefore download it now.
-
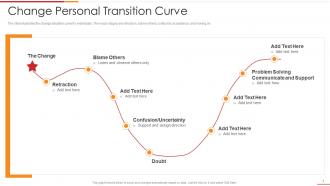 Change personal transition curve ultimate change management guide with process frameworks
The slide illustrates the change adoption curve for individuals. The major stages are retraction, blame others, confusion, acceptance, and moving on. Deliver an outstanding presentation on the topic using this Change Personal Transition Curve Ultimate Change Management Guide With Process Frameworks. Dispense information and present a thorough explanation of Change Personal Transition Curve using the slides given. This template can be altered and personalized to fit your needs. It is also available for immediate download. So grab it now.
-
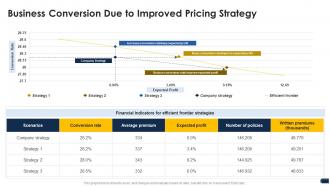 Companys pricing strategies business conversion strategy ppt pictures grid
Deliver an outstanding presentation on the topic using this Companys Pricing Strategies Business Conversion Strategy Ppt Pictures Grid. Dispense information and present a thorough explanation of Scenarios, Profit, Premiums using the slides given. This template can be altered and personalized to fit your needs. It is also available for immediate download. So grab it now.
-
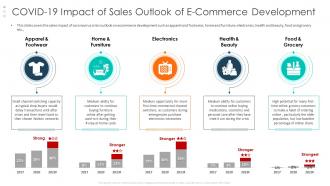 Covid 19 impact of sales covid 19 business survive adapt
This slide covers the sales impact of coronavirus crisis outlook on ecommerce development such as apparel and footwear, home and furniture, electronics, health and beauty, food and grocery etc., Deliver an outstanding presentation on the topic using this Covid 19 Impact Of Sales Covid 19 Business Survive Adapt. Dispense information and present a thorough explanation of Customers, Transactions, Networks using the slides given. This template can be altered and personalized to fit your needs. It is also available for immediate download. So grab it now.
-
 Daily unit products covid 19 business survive adapt
This slide covers the volume and unit purchased of Apparel goods through offline sales channels during COVID 19 pandemic Deliver an outstanding presentation on the topic using this Daily Unit Products Covid 19 Business Survive Adapt. Dispense information and present a thorough explanation of Interested, Department, Suffering using the slides given. This template can be altered and personalized to fit your needs. It is also available for immediate download. So grab it now.
-
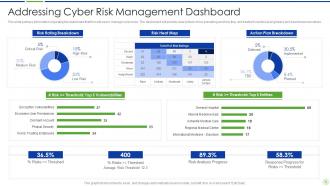 Implementing advanced system workplace addressing cyber risk management dashboard
This slide portrays information regarding the dashboard that firm will use to manage cyber risks. The dashboard will provide clear picture of risk prevailing and how they are treated to technical engineers and board level executives.Present the topic in a bit more detail with this Implementing Advanced System Workplace Addressing Cyber Risk Management Dashboard. Use it as a tool for discussion and navigation on Management, Dashboard, Cyber. This template is free to edit as deemed fit for your organization. Therefore download it now.
-
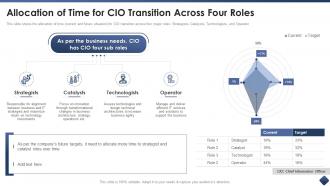 Effective cio transitions create organizational value allocation of time for cio transition across
This slide shows the allocation of time current and future situation for CIO transition across four major roles Strategists, Catalysts, Technologists, and Operator. Present the topic in a bit more detail with this Effective CIO Transitions Create Organizational Value Allocation Of Time For CIO Transition Across. Use it as a tool for discussion and navigation on Strategists, Catalysts, Technologists, Operator, Target. This template is free to edit as deemed fit for your organization. Therefore download it now.
-
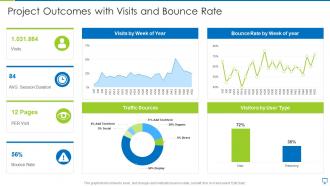 Project outcomes with visits and bounce rate
Presenting our well structured Project Outcomes With Visits And Bounce Rate. The topics discussed in this slide are Project Outcomes With Visits And Bounce Rate. This is an instantly available PowerPoint presentation that can be edited conveniently. Download it right away and captivate your audience.
-
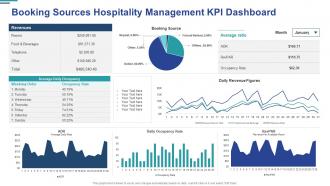 Booking sources hospitality management kpi dashboard
Deliver an outstanding presentation on the topic using this Booking Sources Hospitality Management KPI Dashboard. Dispense information and present a thorough explanation of Average, Revenues, Source using the slides given. This template can be altered and personalized to fit your needs. It is also available for immediate download. So grab it now.
-
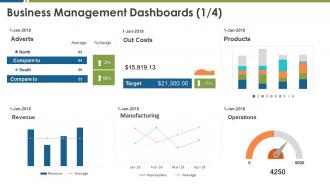 Business management dashboards average business management
Deliver an outstanding presentation on the topic using this Business Management Dashboards Average Business Management. Dispense information and present a thorough explanation of Business Management Dashboards using the slides given. This template can be altered and personalized to fit your needs. It is also available for immediate download. So grab it now.
-
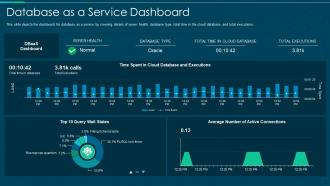 Database as a service dashboard snapshot ppt file graphics tutorials
This slide depicts the dashboard snapshot for database as a service by covering details of server health, database type, total time in the cloud database, and total executions. Present the topic in a bit more detail with this Database As A Service Dashboard Ppt File Graphics Tutorials. Use it as a tool for discussion and navigation on Database As A Service Dashboard. This template is free to edit as deemed fit for your organization. Therefore download it now.
-
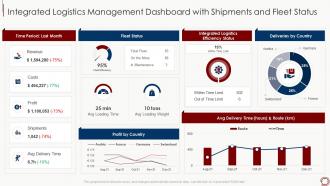 Supply chain management tools enhance logistics efficiency integrated shipments fleet
Present the topic in a bit more detail with this Supply Chain Management Tools Enhance Logistics Efficiency Integrated Shipments Fleet. Use it as a tool for discussion and navigation on Shipments, Profit, Costs, Revenue. This template is free to edit as deemed fit for your organization. Therefore download it now.
-
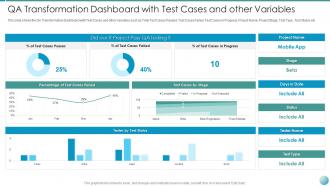 Qa transformation dashboard qa transformation improved product quality user satisfaction
This slide shows the QA Transformation Dashboard with Test Cases and other Variables such as Total Test Cases Passed, Test Cases Failed, Test Cases in Progress, Project Name, Project Stage, Test Type, Test Status etc. Deliver an outstanding presentation on the topic using this QA Transformation Dashboard QA Transformation Improved Product Quality User Satisfaction. Dispense information and present a thorough explanation of QA Transformation Dashboard With Test Cases And Other Variables using the slides given. This template can be altered and personalized to fit your needs. It is also available for immediate download. So grab it now.
-
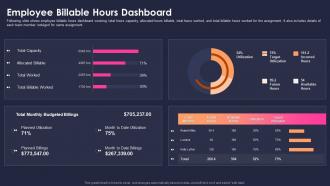 Measure sustainability key performance indicators employee billable hours
Following slide shows employee billable hours dashboard covering total hours capacity, allocated hours billable, total hours worked, and total billable hours worked for the assignment. It also includes details of each team member indulged for same assignment. Deliver an outstanding presentation on the topic using this Measure Sustainability Key Performance Indicators Employee Billable Hours. Dispense information and present a thorough explanation of Total Capacity, Allocated Billable, Total Worked, Total Billable Worked using the slides given. This template can be altered and personalized to fit your needs. It is also available for immediate download. So grab it now.
-
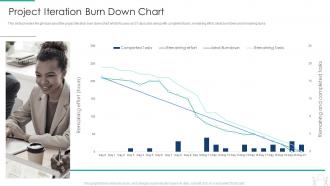 Pmp modeling techniques it project iteration burn down chart
This slide provides the glimpse about the project iteration burn down chart which focuses on 21 days plan along with completed tasks, remaining effort, ideal burndown and remaining tasks. Deliver an outstanding presentation on the topic using this Pmp Modeling Techniques It Project Iteration Burn Down Chart. Dispense information and present a thorough explanation of Project Iteration Burn Down Chart using the slides given. This template can be altered and personalized to fit your needs. It is also available for immediate download. So grab it now.
-
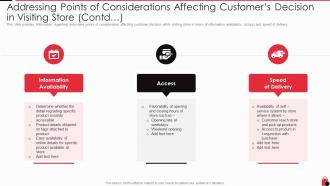 Retailing techniques optimal points considerations affecting customers decision visiting contd
This slide provides information regarding determine points of consideration affecting customer decision while visiting store in terms of information availability, access and speed of delivery. Present the topic in a bit more detail with this Retailing Techniques Optimal Points Considerations Affecting Customers Decision Visiting Contd. Use it as a tool for discussion and navigation on Information Availability, Access, Speed Of Delivery. This template is free to edit as deemed fit for your organization. Therefore download it now.
-
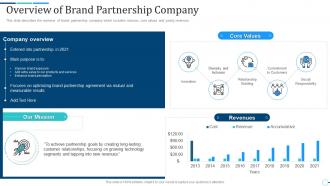 Overview of brand partnership company brand partnership investor funding elevator
This slide describes the overview of brand partnership company which includes mission, core values and yearly revenues. Deliver an outstanding presentation on the topic using this Overview Of Brand Partnership Company Brand Partnership Investor Funding Elevator. Dispense information and present a thorough explanation of Core Values, Revenues, Our Mission, Social Responsibility, Relationship Building using the slides given. This template can be altered and personalized to fit your needs. It is also available for immediate download. So grab it now.
-
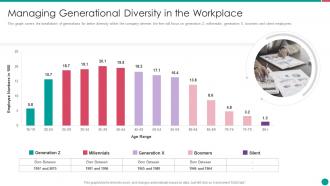 Diversity and inclusion management managing generational diversity in the workplace
This graph covers the breakdown of generations for better diversity within the company wherein the firm will focus on generation Z, millennials, generation X, boomers and silent employees. Present the topic in a bit more detail with this Diversity And Inclusion Management Managing Generational Diversity In The Workplace. Use it as a tool for discussion and navigation on Managing Generational Diversity In The Workplace. This template is free to edit as deemed fit for your organization. Therefore download it now.
-
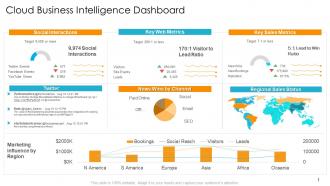 Cloud business intelligence dashboard digital infrastructure to resolve organization issues
Deliver an outstanding presentation on the topic using this Cloud Business Intelligence Dashboard Digital Infrastructure To Resolve Organization Issues. Dispense information and present a thorough explanation of Social Interactions, Lead Ratio, Win Ratio, Key Web Metrics, Key Sales Metrics using the slides given. This template can be altered and personalized to fit your needs. It is also available for immediate download. So grab it now.
-
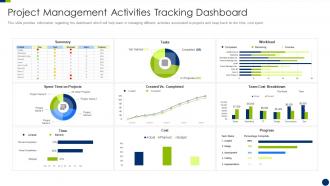 Enhancing overall project security it project management activities tracking dashboard
This slide provides information regarding the dashboard which will help team in managing different activities associated to projects and keep track on the time, cost spent. Present the topic in a bit more detail with this Enhancing Overall Project Security It Project Management Activities Tracking Dashboard. Use it as a tool for discussion and navigation on Project Management Activities Tracking Dashboard. This template is free to edit as deemed fit for your organization. Therefore download it now.
-
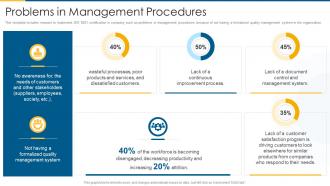 Iso 9001 problems in management procedures
This template includes reasons to implement ISO 9001 certification in company such as problems in management procedures because of not having a formalized quality management system in the organization. Deliver an outstanding presentation on the topic using this Iso 9001 Problems In Management Procedures. Dispense information and present a thorough explanation of Management, Procedures, Improvement using the slides given. This template can be altered and personalized to fit your needs. It is also available for immediate download. So grab it now.
-
 Cloud solutions predictive analytics oracle analytics cloud it oracle analytics
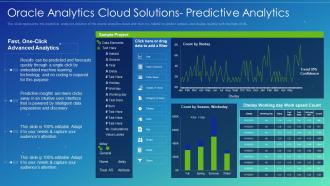
This slide represents the predictive analytics solution of the oracle analytics cloud and how it is helpful to predict outputs and display quickly with the help of ML. Deliver an outstanding presentation on the topic using this Cloud Solutions Predictive Analytics Oracle Analytics Cloud It Oracle Analytics. Dispense information and present a thorough explanation of Analytics, Solutions, Technology using the slides given. This template can be altered and personalized to fit your needs. It is also available for immediate download. So grab it now.
-
 Oracle analytics cloud it oracle business intelligence cloud service bics
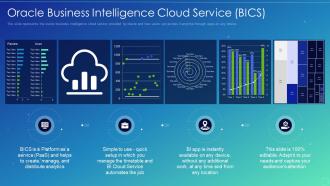
This slide represents the oracle business intelligence cloud service provided by oracle and how users can access it anytime through apps on any device. Present the topic in a bit more detail with this Oracle Analytics Cloud It Oracle Business Intelligence Cloud Service Bics. Use it as a tool for discussion and navigation on Service, Business, Intelligence. This template is free to edit as deemed fit for your organization. Therefore download it now.
-
 Managing b2b marketing managing account dashboard ppt summary icons
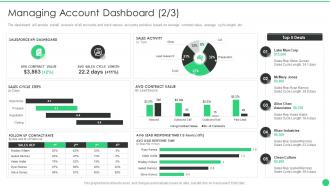
The dashboard will provide overall scenario of all accounts and track various accounts activities based on average contract value, average cycle length, etc. Present the topic in a bit more detail with this Managing B2B Marketing Managing Account Dashboard Ppt Summary Icons. Use it as a tool for discussion and navigation on Top 5 Deals, Sales Activity, Sales Cycle Steps, Follow Up Contact Rate. This template is free to edit as deemed fit for your organization. Therefore download it now.
-
 Itsm scorecard with incident trends ppt slides
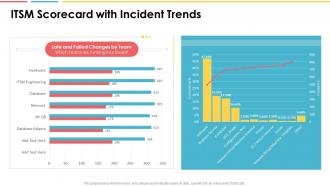
Deliver an outstanding presentation on the topic using this ITSM Scorecard With Incident Trends Ppt Slides. Dispense information and present a thorough explanation of ITSM Scorecard With Incident Trends using the slides given. This template can be altered and personalized to fit your needs. It is also available for immediate download. So grab it now.
-
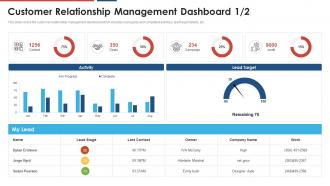 Build a dynamic partnership customer management dashboard
This slide covers the customer relationship management dashboard which includes in progress and completed activities, lead target details, etc.Present the topic in a bit more detail with this Build A Dynamic Partnership Customer Management Dashboard. Use it as a tool for discussion and navigation on Customer Relationship Management Dashboard. This template is free to edit as deemed fit for your organization. Therefore download it now.
-
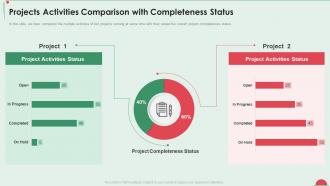 Project in controlled environment activities comparison completeness status
In this slide, we have compared the multiple activities of two projects running at same time with their respective overall project completeness status.Present the topic in a bit more detail with this Project In Controlled Environment Activities Comparison Completeness Status. Use it as a tool for discussion and navigation on Projects Activities Comparison With Completeness Status. This template is free to edit as deemed fit for your organization. Therefore download it now.
-
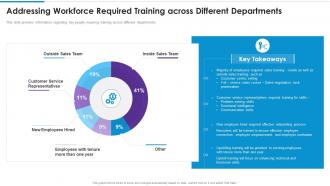 Addressing workforce required training across different departments
This slide provides information regarding key people requiring training across different departments. Deliver an outstanding presentation on the topic using this Addressing Workforce Required Training Across Different Departments. Dispense information and present a thorough explanation of Outside Sales Team, Inside Sales Team, New Employees Hired, Customer Service Representatives, Employees With Tenure More Than One Year using the slides given. This template can be altered and personalized to fit your needs. It is also available for immediate download. So grab it now.
-
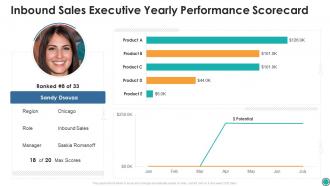 Inbound sales executive yearly performance scorecard ppt slides
Deliver an outstanding presentation on the topic using this Inbound Sales Executive Yearly Performance Scorecard Ppt Slides. Dispense information and present a thorough explanation of Inbound Sales Executive Yearly Performance Scorecard using the slides given. This template can be altered and personalized to fit your needs. It is also available for immediate download. So grab it now.
-
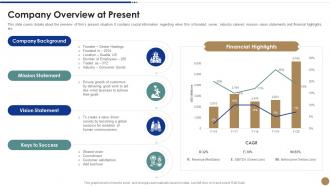 Company overview at present strawman proposal for business problem solving
This slide covers details about the overview of firms present situation. It contains crucial information regarding when firm is founded, owner, industry catered, mission, vision statements and financial highlights, etc.Deliver an outstanding presentation on the topic using this Company Overview At Present Strawman Proposal For Business Problem Solving. Dispense information and present a thorough explanation of Mission Statement, Vision Statement, Ensure Growth Of Customers using the slides given. This template can be altered and personalized to fit your needs. It is also available for immediate download. So grab it now.
-
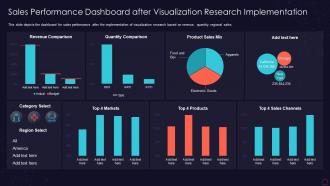 Sales performance dashboard after visualization research implementation
This slide depicts the dashboard for sales performance after the implementation of visualization research based on revenue, quantity, regional sales. Present the topic in a bit more detail with this Sales Performance Dashboard After Visualization Research Implementation. Use it as a tool for discussion and navigation on Revenue Comparison, Quantity Comparison, Product Sales Mix, Top 4 Markets. This template is free to edit as deemed fit for your organization. Therefore download it now.
-
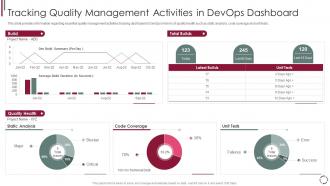 Tracking quality management devops model redefining quality assurance role it
This slide provides information regarding essential quality management activities tracking dashboard in DevOps in terms of quality health such as static analysis, code coverage and unit tests. Present the topic in a bit more detail with this Tracking Quality Management Devops Model Redefining Quality Assurance Role IT. Use it as a tool for discussion and navigation on Tracking Quality Management Activities In Devops Dashboard. This template is free to edit as deemed fit for your organization. Therefore download it now.
-
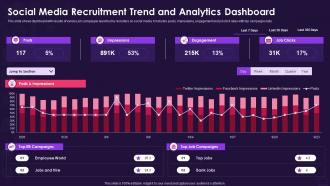 Social media recruitment trend and analytics dashboard
Introducing our Social Media Recruitment Trend And Analytics Dashboard set of slides. The topics discussed in these slides are Social Media Recruitment Trend And Analytics Dashboard. This is an immediately available PowerPoint presentation that can be conveniently customized. Download it and convince your audience.
-
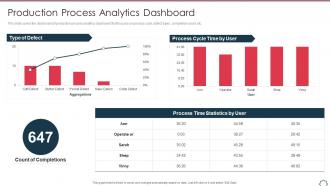 Total productivity maintenance production process analytics dashboard
This slide covers the dashboard of production process analytics dashboard that focuses on process cycle, defect types, completion count, etc. Present the topic in a bit more detail with this Total Productivity Maintenance Production Process Analytics Dashboard. Use it as a tool for discussion and navigation on Type Of Defect, Process Cycle Time By User, Count Of Completions, Process Time Statistics By User. This template is free to edit as deemed fit for your organization. Therefore download it now.
-
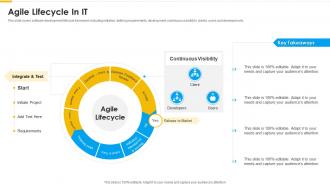 Agile methodology agile lifecycle in it ppt topics
This slide covers software development lifecycle framework including initiation, defining requirements, development, continuous visibility to clients, users and developers etc. Introducing Agile Methodology Agile Lifecycle In It Ppt Topics to increase your presentation threshold. Encompassed with three stages, this template is a great option to educate and entice your audience. Dispence information on Agile Lifecycle In IT, using this template. Grab it now to reap its full benefits.


