Charts, Graphs PowerPoint Designs, Presentation Charts Designs & PPT Graphics
- Sub Categories
-
- Arrows and Targets
- Bullet and Text Slides
- Charts and Graphs
- Circular Cycle Diagrams
- Concepts and Shapes
- Custom Flat Designs
- Dashboards and Measuring
- Flow Process
- Funnels
- Gears
- Growth
- Harvey Balls
- Idea Innovation and Light Bulbs
- Leadership
- Linear Process Diagrams
- Magnifying Glass
- Misc Other Graphics
- Opportunity and Handshake
- Organization Charts
- Puzzles
- Pyramids
- Roadmaps and Timelines
- Silhouettes
- Steps
- Strategic Planning Analysis
- SWOT Analysis
- Tables and Matrix
- Teamwork
- Technology and Communication
- Venn Diagrams
- Visuals and Illustrations
-
 Employee Happiness Survey Summary Report Survey SS
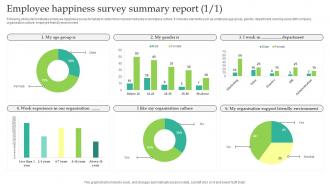
Following slides demonstrates employee happiness survey template to determine improvement area in workplace culture. It includes elements such as employee age group, gender, department, working years with company, organisation culture, employee friendly environment. Introducing our Employee Happiness Survey Summary Report Survey SS set of slides. The topics discussed in these slides are My Age Group, Organisation Culture, Support Friendly Environment. This is an immediately available PowerPoint presentation that can be conveniently customized. Download it and convince your audience.
-
 Data Security And Privacy Survey Overview Report Survey SS
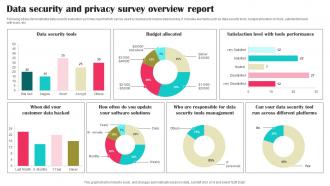
Following slides demonstrates data security evaluation summary report which can be used by business to reduce data hacking. It includes elements such as data security tools, budget allocation on tools, satisfaction level with tools, etc. Presenting our well structured Data Security And Privacy Survey Overview Report Survey SS. The topics discussed in this slide are Data Security Tools, Budget Allocated, Software Solutions. This is an instantly available PowerPoint presentation that can be edited conveniently. Download it right away and captivate your audience.
-
 Brand Performance Overview Market Share Marketing Tactics To Improve Brand
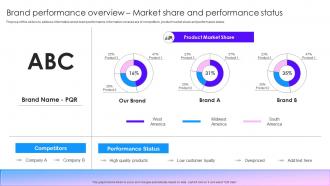
Purpose of this slide is to address information about brand performance. Information covered are of competitors, product market share and performance status. Present the topic in a bit more detail with this Brand Performance Overview Market Share Marketing Tactics To Improve Brand. Use it as a tool for discussion and navigation on Product Market Share, Performance Status, Competitors. This template is free to edit as deemed fit for your organization. Therefore download it now.
-
 Competitive Landscape Analysis Based On Market Share Marketing Tactics To Improve Brand
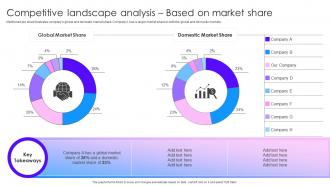
Mentioned pie chart illustrates companys global and domestic market share. Company A has a larger market share in both the global and domestic markets. Deliver an outstanding presentation on the topic using this Competitive Landscape Analysis Based On Market Share Marketing Tactics To Improve Brand. Dispense information and present a thorough explanation of Global Market Share, Domestic Market Share, Landscape Analysis using the slides given. This template can be altered and personalized to fit your needs. It is also available for immediate download. So grab it now.
-
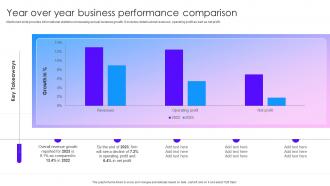 Year Over Year Business Performance Comparison Marketing Tactics To Improve Brand
Mentioned slide provides informational statistics showcasing annual business growth. It includes details about revenues, operating profit as well as net profit. Deliver an outstanding presentation on the topic using this Year Over Year Business Performance Comparison Marketing Tactics To Improve Brand. Dispense information and present a thorough explanation of Year Business, Performance Comparison using the slides given. This template can be altered and personalized to fit your needs. It is also available for immediate download. So grab it now.
-
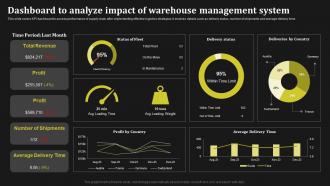 Dashboard To Analyze Impact Of Warehouse Management Key Methods To Enhance
This slide covers KPI dashboard to assess performance of supply chain after implementing effective logistics strategies. It involves details such as delivery status, number of shipments and average delivery time. Deliver an outstanding presentation on the topic using this Dashboard To Analyze Impact Of Warehouse Management Key Methods To Enhance Dispense information and present a thorough explanation of Status Of Fleet, Delivery Status using the slides given. This template can be altered and personalized to fit your needs. It is also available for immediate download. So grab it now.
-
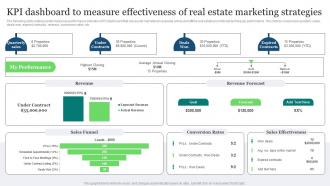 Real Estate Marketing Ideas To Improve KPI Dashboard To Measure Effectiveness Of Real Estate MKT SS V
The following slide outlines performance key performance indicator KPI dashboard that can assist marketers to evaluate online and offline real estate promotional techniques performance. The metrics covered are quarterly sales, deals won, expired contracts, revenue, conversion rates, etc. Deliver an outstanding presentation on the topic using this Real Estate Marketing Ideas To Improve KPI Dashboard To Measure Effectiveness Of Real Estate MKT SS V. Dispense information and present a thorough explanation of Revenue, Revenue Forecast, Sales Funnel using the slides given. This template can be altered and personalized to fit your needs. It is also available for immediate download. So grab it now.
-
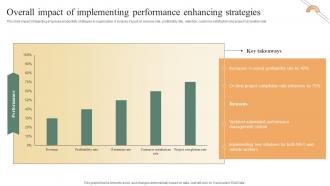 Performance Improvement Methods Overall Impact Of Implementing Performance Enhancing
This slide impact of depicting employee productivity strategies in organization. It involves impact on revenue rate, profitability rate, retention, customer satisfaction and project completion rate. Deliver an outstanding presentation on the topic using this Performance Improvement Methods Overall Impact Of Implementing Performance Enhancing. Dispense information and present a thorough explanation of Overall Profitability, Project Completion, Updated Automated using the slides given. This template can be altered and personalized to fit your needs. It is also available for immediate download. So grab it now.
-
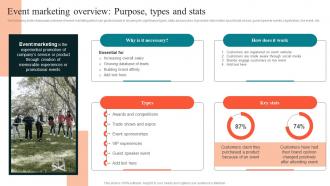 Event Marketing Overview Purpose Types Using Experiential Advertising Strategy SS V
The following slide showcases overview of event marketing which can guide brands in knowing its significance types, stats and process. It provides information about trade shows, guest speaker events, registration, live event, etc.Present the topic in a bit more detail with this Event Marketing Overview Purpose Types Using Experiential Advertising Strategy SS V. Use it as a tool for discussion and navigation on Memorable Experiences, Promotional Events, Experiential Promotion. This template is free to edit as deemed fit for your organization. Therefore download it now.
-
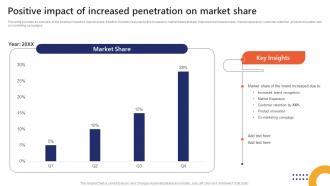 Positive Impact Of Increased Penetration On Market Share Market Penetration To Improve Brand Strategy SS
This slide provides an overview of the positive impact on market share. It further includes reasons for the increase in market share that are improved brand awareness, market expansion, customer retention, product innovation and co marketing campaigns. Deliver an outstanding presentation on the topic using this Positive Impact Of Increased Penetration On Market Share Market Penetration To Improve Brand Strategy SS. Dispense information and present a thorough explanation of Positive, Penetration, Market using the slides given. This template can be altered and personalized to fit your needs. It is also available for immediate download. So grab it now.
-
 Pain Points In Digital Marketing Of Products Ppt File Background Designs
This slide exhibits the statistical data for problems related to digital marketing of product and services to help business create and implement a strategic marketing approach. Key elements are cash flow management, privacy regulations, omnichannel marketing etc. Deliver an outstanding presentation on the topic using this Pain Points In Digital Marketing Of Products Ppt File Background Designs. Dispense information and present a thorough explanation of Marketers Find Generating, Pain Point, Problem Digital using the slides given. This template can be altered and personalized to fit your needs. It is also available for immediate download. So grab it now.
-
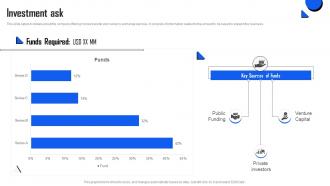 Investment Ask Remitbee Investor Funding Elevator Pitch Deck Ppt Template
This slide caters to details about the company offering money transfer and currency exchange services. It consists of information related to the amount to be raised to expand the business. Present the topic in a bit more detail with this Investment Ask Remitbee Investor Funding Elevator Pitch Deck Ppt Template. Use it as a tool for discussion and navigation on Funds Required, Investment Ask. This template is free to edit as deemed fit for your organization. Therefore download it now.
-
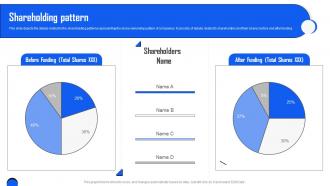 Shareholding Pattern Remitbee Investor Funding Elevator Pitch Deck Ppt Sample
This slide depicts the details related to the shareholding patterns representing the share ownership pattern of companies. It consists of details related to shareholders and their shares before and after funding. Present the topic in a bit more detail with this Shareholding Pattern Remitbee Investor Funding Elevator Pitch Deck Ppt Sample. Use it as a tool for discussion and navigation on Before Funding, Shareholding Pattern. This template is free to edit as deemed fit for your organization. Therefore download it now.
-
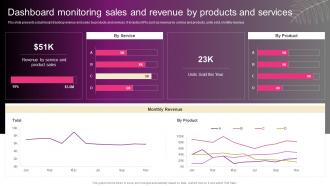 Dashboard Monitoring Sales And Revenue New Hair And Beauty Salon Marketing Strategy SS
This slide presents a dashboard tracking revenue and sales by products and services. It includes KPIs such as revenue by service and products, units sold, monthly revenue. Present the topic in a bit more detail with this Dashboard Monitoring Sales And Revenue New Hair And Beauty Salon Marketing Strategy SS. Use it as a tool for discussion and navigation on Dashboard Monitoring, Sales And Revenue, Products And Services. This template is free to edit as deemed fit for your organization. Therefore download it now.
-
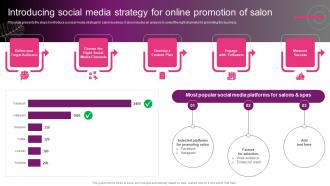 Introducing Social Media Strategy For Online New Hair And Beauty Salon Marketing Strategy SS
This slide presents the steps to introduce a social media strategy for salon business. It also includes an analysis to select the right channels for promoting the business. Present the topic in a bit more detail with this Introducing Social Media Strategy For Online New Hair And Beauty Salon Marketing Strategy SS. Use it as a tool for discussion and navigation on Target Audience, Social Media Channels, Measure Success. This template is free to edit as deemed fit for your organization. Therefore download it now.
-
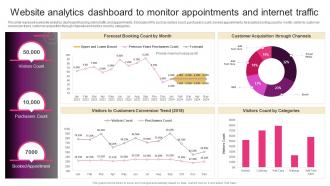 Website Analytics Dashboard To Monitor Appointments Hair And Beauty Salon Marketing Strategy SS
This slide represent a website analytics dashboard tracking online traffic and appointments. It includes KPIs such as visitors count, purchasers count, booked appointments, forecasted booking count by month, visitor to customer conversion trend, customer acquisition through channels and visitors count by categories. Present the topic in a bit more detail with this Website Analytics Dashboard To Monitor Appointments Hair And Beauty Salon Marketing Strategy SS. Use it as a tool for discussion and navigation on Visitors Count, Purchasers Count, Booked Appointment. This template is free to edit as deemed fit for your organization. Therefore download it now.
-
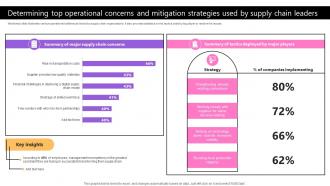 Determining Top Operational Concerns And Mitigation Taking Supply Chain Performance Strategy SS V
Mentioned slide illustrates various operational bottlenecks faced by supply chain organizations. It also provides statistics on the tactics used by big player to resolve the issues. Present the topic in a bit more detail with this Determining Top Operational Concerns And Mitigation Taking Supply Chain Performance Strategy SS V. Use it as a tool for discussion and navigation on Supply Chain Concerns, Major Players. This template is free to edit as deemed fit for your organization. Therefore download it now.
-
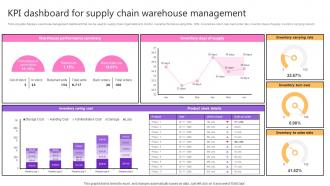 KPI Dashboard For Supply Chain Warehouse Taking Supply Chain Performance Strategy SS V
Following slide displays warehouse management dashboard that can be used by supply chain organizations to monitor overall performance using KPIs. KPIs covered are return rate, back order rate, inventory days of supply, inventory carrying cost etc. Present the topic in a bit more detail with this KPI Dashboard For Supply Chain Warehouse Taking Supply Chain Performance Strategy SS V. Use it as a tool for discussion and navigation on Warehouse Performance Summary, Inventory Days Of Supply. This template is free to edit as deemed fit for your organization. Therefore download it now.
-
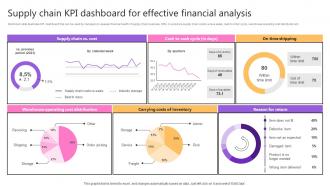 Supply Chain KPI Dashboard For Effective Financial Analysis Taking Supply Chain Performance Strategy SS V
Mentioned slide illustrates KPI dashboard that can be used by managers to assess financial health of supply chain business. KPIs covered are supply chain costs versus sales, cash to order cycle, warehouse operating cost distribution etc. Present the topic in a bit more detail with this Supply Chain KPI Dashboard For Effective Financial Analysis Taking Supply Chain Performance Strategy SS V. Use it as a tool for discussion and navigation on Time Shipping, Carrying Costs Of Inventory. This template is free to edit as deemed fit for your organization. Therefore download it now.
-
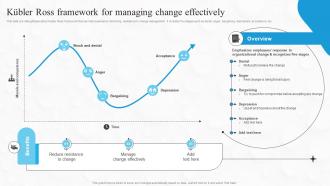 Kubler Ross Framework For Managing Change Boosting Financial Performance And Decision Strategy SS
This slide provides glimpse about Kubler Ross framework that can help business in minimizing resistance to change management. It includes five stages such as denial, anger, bargaining, depression, acceptance, etc. Deliver an outstanding presentation on the topic using this Kubler Ross Framework For Managing Change Boosting Financial Performance And Decision Strategy SS. Dispense information and present a thorough explanation of Framework, Managing, Change using the slides given. This template can be altered and personalized to fit your needs. It is also available for immediate download. So grab it now.
-
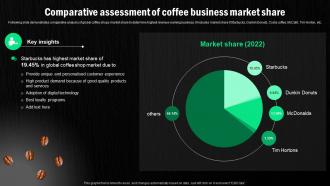 Starbucks Corporation Company Profile Comparative Assessment Of Coffee Business CP SS
Following slide demonstrates comparative analysis of global coffee shops market share to determine highest revenue earning business. It includes market share if Starbucks, Dunkin Donuts, Costa coffee, McCafe, Tim Horton, etc. Present the topic in a bit more detail with this Starbucks Corporation Company Profile Comparative Assessment Of Coffee Business CP SS. Use it as a tool for discussion and navigation on Quality Products And Ser, Adoption Of Digital Technology, Market Share. This template is free to edit as deemed fit for your organization. Therefore download it now.
-
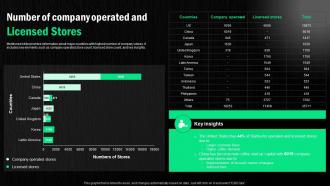 Starbucks Corporation Company Profile Number Of Company Operated CP SS
Mentioned slide provides information about major countries with highest number of company stores. It includes key elements such as company operated store count, licensed store count, and key insights. Present the topic in a bit more detail with this Starbucks Corporation Company Profile Number Of Company Operated CP SS. Use it as a tool for discussion and navigation on Implementation, Market Strategies, Customer. This template is free to edit as deemed fit for your organization. Therefore download it now.
-
 Impact Of Supplier Relationships Challenges On Business Business Relationship Management To Build
Mentioned slide illustrates supplier relationship management challenges impact on business led to reduce business performance. It includes key performance indicators such as lead time, compliance rate, defective product, product quality and timely product delivery. Present the topic in a bit more detail with this Impact Of Supplier Relationships Challenges On Business Business Relationship Management To Build. Use it as a tool for discussion and navigation on Supplier Relationship Management. This template is free to edit as deemed fit for your organization. Therefore download it now.
-
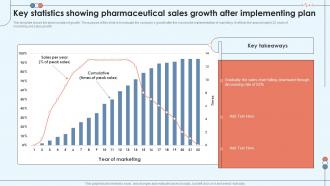 Key Statistics Showing Pharmaceutical Sales Growth After Implementing Plan
This template shows the pharma sales of growth. The purpose of this slide is to evaluate the companys growth after the successful implementation of marketing. It reflects the approximately 22 years of marketing and sales growth. Presenting our well structured Key Statistics Showing Pharmaceutical Sales Growth After Implementing Plan. The topics discussed in this slide are Statistics Showing, Pharmaceutical Sales, Implementing Plan. This is an instantly available PowerPoint presentation that can be edited conveniently. Download it right away and captivate your audience.
-
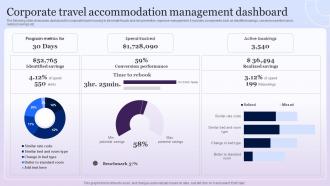 Corporate Travel Accommodation Management Dashboard
The following slide showcases dashboard for corporate travel housing to eliminate frauds and risk prevention, expense management. It includes components such as identified savings, conversion performance, realized savings etc. Introducing our Corporate Travel Accommodation Management Dashboard set of slides. The topics discussed in these slides are Program Metrics, Conversion Performance, Realized Savings. This is an immediately available PowerPoint presentation that can be conveniently customized. Download it and convince your audience.
-
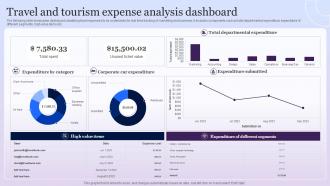 Travel And Tourism Expense Analysis Dashboard
The following slide showcases dashboard classifying travel expenses to be undertaken for real time tracking of marketing and business. It includes components such as total departmental expenditure, expenditure of different segments, high value items etc. Introducing our Travel And Tourism Expense Analysis Dashboard set of slides. The topics discussed in these slides are Expenditure By Category, Corporate Car Expenditure, Departmental Expenditure. This is an immediately available PowerPoint presentation that can be conveniently customized. Download it and convince your audience.
-
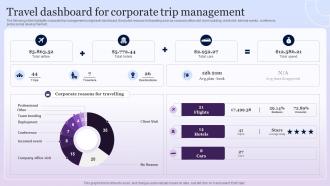 Travel Dashboard For Corporate Trip Management
The following slide highlights corporate trip management using travel dashboard. It includes reasons for travelling such as company office visit, team building, client visit, internal events, conference, professional development etc. Introducing our Travel Dashboard For Corporate Trip Management set of slides. The topics discussed in these slides are Team Bonding, Deployment, Trip Management. This is an immediately available PowerPoint presentation that can be conveniently customized. Download it and convince your audience.
-
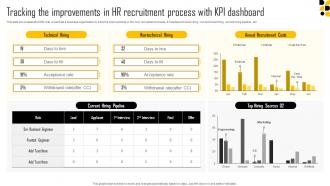 Tracking The Improvements In HR Recruitment Process With Kpi New Age Hiring Techniques
This slide showcases the KPIS that would help a business organization to track the improvements in the new recruitment process. It includes technical hiring, non technical hiring, current hiring pipeline, etc. Present the topic in a bit more detail with this Tracking The Improvements In HR Recruitment Process With Kpi New Age Hiring Techniques Use it as a tool for discussion and navigation on Technical Hiring, Annual Recruitment Costs This template is free to edit as deemed fit for your organization. Therefore download it now.
-
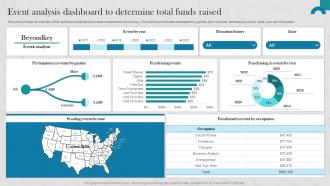 Raising Donations By Optimizing Nonprofit Event Analysis Dashboard MKT SS V
This slide provides an overview of the dashboard depicting the events conducted to raise money. The dashboard includes participation by gender, type of events, fundraising event by state, year and occupation. Deliver an outstanding presentation on the topic using this Raising Donations By Optimizing Nonprofit Event Analysis Dashboard MKT SS V. Dispense information and present a thorough explanation of Business Analyst, Entrepreneur, Social Worker using the slides given. This template can be altered and personalized to fit your needs. It is also available for immediate download. So grab it now.
-
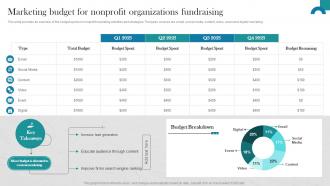 Raising Donations By Optimizing Nonprofit Marketing Budget For Nonprofit MKT SS V
This slide provides an overview of the budget spent on nonprofit marketing activities and strategies. The types covered are email, social media, content, video, event and digital marketing. Deliver an outstanding presentation on the topic using this Raising Donations By Optimizing Nonprofit Marketing Budget For Nonprofit MKT SS V. Dispense information and present a thorough explanation of Budget Breakdown, Search Engine Ranking, Nonprofit Organizations Fundraising using the slides given. This template can be altered and personalized to fit your needs. It is also available for immediate download. So grab it now.
-
 Overview of monthly traffic sources powerpoint graphics
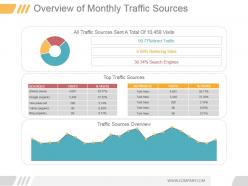
Presenting overview of monthly traffic sources powerpoint graphics. This is a overview of monthly traffic sources powerpoint graphics. This is a three stage process. The stages in this process are all traffic sources sent a total of 10 458 visits, 50 77 percentage direct traffic, 9 89 percentage referring sites, 39 34 percentage search engines, sources, visits, direct none, google organic, vine press net, yahoo organic, bing organic, top traffic sources, keywords, visits, traffic source overview.
-
 Understanding organic search vs paid search powerpoint topics
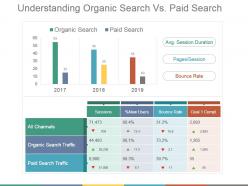
Presenting to you the organic vs. paid search PowerPoint template. This slide is fully customizable PowerPoint template to communicate your ideas clearly. You can easily edit the charts and graphs in excel sheet. This presentation slide is designed with elegant shapes and visuals. You can convert this slide into numerous format options like JPEG, JPG or PDF. This template is compatible with Google slides. It is easy to customize each graphics and text as per your need. You can download it easily at a click of a button.
-
 Referral marketing concept ppt design
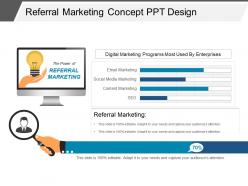
Presenting referral marketing concept ppt design. This is a referral marketing concept ppt design. This is a two stage process. The stages in this process are digital marketing, programs most used by, enterprises.
-
 Project complex challenges ppt summary
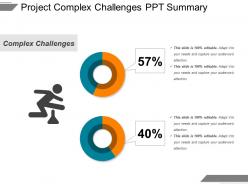
Presenting project complex challenges PPT summary presentation slide. You can download this template and then save into another format such as JPG and PDF and can also display in standard and widescreen view. A user can alter this slide such as color, text, font type, font size and aspect ratio. This slide gets synced with Google Slides and edit it in PowerPoint. You may share this template with large segment because it has great pixel quality. You can insert the relevant content in text placeholder of this slide.
-
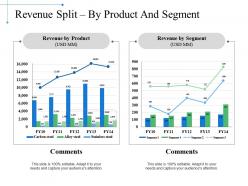 Revenue split by product and segment ppt slide template
Presenting this set of slides with name - Revenue Split By Product And Segment Ppt Slide Template. This is a two stage process. The stages in this process are Business, Marketing, Finance, Planning, Analysis.
-
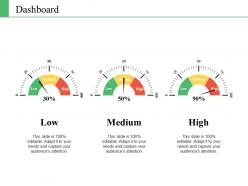 Dashboard Snapshot ppt summary rules
Presenting this set of slides with name - Dashboard Snapshot Ppt Summary Rules. This is a three stage process. The stages in this process are Low, Medium, High, Dashboard, Measurement.
-
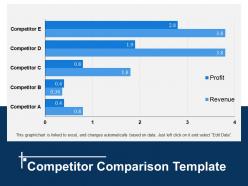 Competitor comparison template powerpoint templates
Presenting this set of slides with name - Competitor Comparison Template Powerpoint Templates. This is a five stage process. The stages in this process are Finance, Marketing, Slide Bar, Planning, Growth.
-
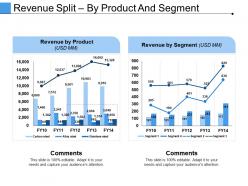 Revenue split by product and segment ppt examples slides
Presenting this set of slides with name - Revenue Split By Product And Segment Ppt Examples Slides. This is a two stage process. The stages in this process are Finance, Marketing, Bar, Planning, Growth.
-
 P and l kpis ppt styles layout
Presenting this set of slides with name - P And L Kpis Ppt Styles Layout. This is a four stage process. The stages in this process are Revenue, Cogs, Operating Profit, Net Profit.
-
 Wholesale and retail kpi dashboard showing total stores by type employee turnover by city
Presenting the KPI dashboard presentation template. This PPT template is 100% editable in MS PowerPoint and is designed professionally. You can edit the objects in the slide like font size and font color very easily. This presentation template is 100% compatible with Google Slide and can be saved in JPG or PDF file format easily. Click on the download tab to download this presentation template.
-
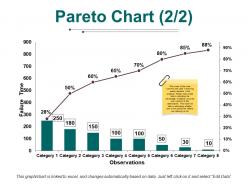 Pareto chart ppt pictures file formats
Presenting Pareto chart PPT pictures file formats PPT slide. The Pareto graph picture style PowerPoint slide designed by the professional team of SlideTeam is useful for illustrating the count of failures. The Pareto chart file style template is the data driven template and you can edit the value as the file style slide gets linked with the Excel sheet. The graphical Pareto chart picture style slide is customizable in PowerPoint as well as compatible with Google Slide. A presenter can modify the visual Pareto chart file format template such as font size, font type, color and dimensions of the charts.
-
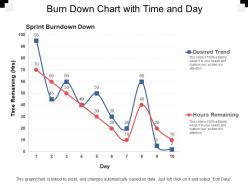 Burn down chart with time and day
Presenting this set of slides with name - Burn Down Chart With Time And Day. This is a two stage process. The stages in this process are Burn Down Chart, Agile Software Development Chart, Run Chart.
-
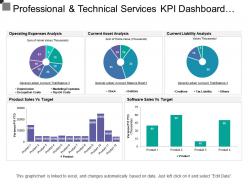 Professional and technical services kpi dashboard showing current asset and liabilities
Presenting this set of slides with name - Professional And Technical Services Kpi Dashboard Showing Current Asset And Liabilities. This is a five stage process. The stages in this process are Professional And Technical Services, Services Management, Technical Management.
-
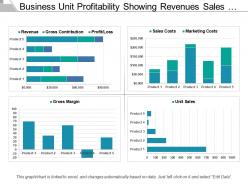 Business unit profitability showing revenues sales costs unit sales
Presenting this set of slides with name - Business Unit Profitability Showing Revenues Sales Costs Unit Sales. This is a four stage process. The stages in this process are Business Unit Profitability, Profitable Organization, Corporate Unit Profitability.
-
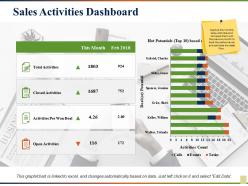 Sales activities dashboard activities per won deal open activities
Presenting this set of slides with name - Sales Activities Dashboard Activities Per Won Deal Open Activities. This is a two stage process. The stages in this process are Total Activities, Closed Activities, Activities Per Won Deal, This Monthopen Activities.
-
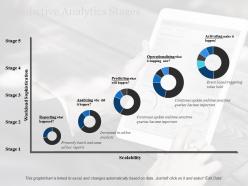 Predictive analytics stages activating ppt professional layout ideas
Presenting this set of slides with name - Predictive Analytics Stages Activating Ppt Professional Layout Ideas. This is a five stage process. The stages in this process are Workload Sophistication, Donut, Process, Finance, Planning.
-
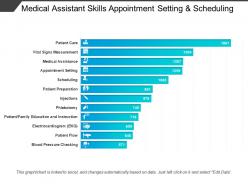 Medical assistant skills appointment setting and scheduling
Presenting this set of slides with name - Medical Assistant Skills Appointment Setting And Scheduling. This is a twelve stage process. The stages in this process are Medical Assistant, Medical Help, Medical Support.
-
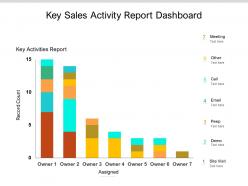 Key sales activity report dashboard snapshot
Presenting this set of slides with name Key Sales Activity Report Dashboard. The topics discussed in these slides are Key Activities Report, Record Count, Meeting. This is a completely editable PowerPoint presentation and is available for immediate download. Download now and impress your audience.
-
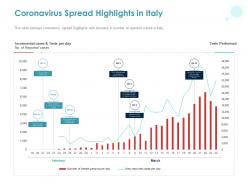 Coronavirus spread highlights in italy ppt powerpoint presentation infographics ideas
This slide portrays coronavirus spread highlights with increase in number of reported cases in Italy. Presenting this set of slides with name Coronavirus Spread Highlights In Italy Ppt Powerpoint Presentation Infographics Ideas. The topics discussed in these slides are Incremental Cases And Tests Per Day, Tests Performed. This is a completely editable PowerPoint presentation and is available for immediate download. Download now and impress your audience.
-
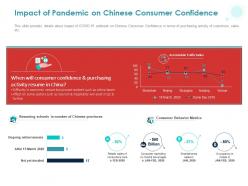 Impact of pandemic on chinese consumer confidence ppt powerpoint presentation infographic
This slide provides details about impact of COVID-19 outbreak on Chinese Consumer Confidence in terms of purchasing activity of customers, sales etc. Presenting this set of slides with name Impact Of Pandemic On Chinese Consumer Confidence Ppt Powerpoint Presentation Infographic. The topics discussed in these slides are Resuming schools in number of Chinese provinces, Consumer Behavior Metrics, Retails sales of consumers cars in FEB 2020, Consumer spending on food And beverages in JAN to FEB, 2020, Smartphones sales in JAN, 2020, Occupancy in hotels in JAN to FEB, 2020. This is a completely editable PowerPoint presentation and is available for immediate download. Download now and impress your audience.
-
 Icon for business market share loss
Introducing our premium set of slides with Icon For Business Market Share Loss. Ellicudate the one stage and present information using this PPT slide. This is a completely adaptable PowerPoint template design that can be used to interpret topics like Icon For Business Market Share Loss. So download instantly and tailor it with your information.
-
 Icon for workforce pink slip due to business loss
Presenting our set of slides with Icon For Workforce Pink Slip Due To Business Loss. This exhibits information on one stage of the process. This is an easy-to-edit and innovatively designed PowerPoint template. So download immediately and highlight information on Icon For Workforce Pink Slip Due To Business Loss.
-
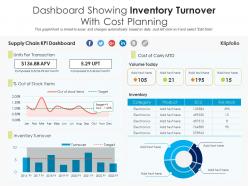 Dashboard showing inventory turnover with cost planning
Introducing our Dashboard Showing Inventory Turnover With Cost Planning set of slides. The topics discussed in these slides are Dashboard Showing Inventory Turnover With Cost Planning. This is an immediately available PowerPoint presentation that can be conveniently customized. Download it and convince your audience.
-
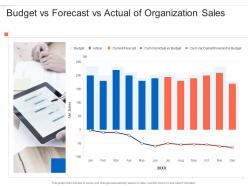 Budget vs forecast vs actual of organization sales
Presenting our well-structured Budget Vs Forecast Vs Actual Of Organization Sales. The topics discussed in this slide are Current Forecast, Budget. This is an instantly available PowerPoint presentation that can be edited conveniently. Download it right away and captivate your audience.
-
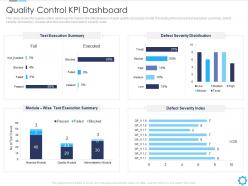 Quality control kpi dashboard agile quality assurance model it ppt introduction
This slide shows the quality control dashboard to monitor the effectiveness of agile quality assurance model. It includes KPIs namely test execution summary, defect severity distribution, module-wise text execution and defect severity index. Present the topic in a bit more detail with this Quality Control KPI Dashboard Agile Quality Assurance Model IT Ppt Introduction. Use it as a tool for discussion and navigation on Test Execution Summary, Module Wise Test Execution Summary, Defect Severity Index, Defect Severity Distribution. This template is free to edit as deemed fit for your organization. Therefore download it now.
-
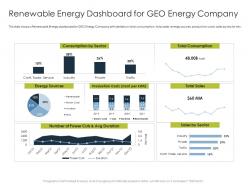 Renewable energy dashboard for geo energy company ppt summary clipart images
This slide shows a Renewable Energy dashboard for GEO Energy Company with details on total consumption, total sales, energy sources, production costs, sales by sector etc. Deliver an outstanding presentation on the topic using this Renewable Energy Dashboard For Geo Energy Company Ppt Summary Clipart Images. Dispense information and present a thorough explanation of Costs, Sales using the slides given. This template can be altered and personalized to fit your needs. It is also available for immediate download. So grab it now.
-
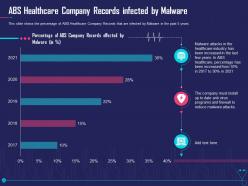 Abs healthcare company overcome challenge cyber security healthcare ppt infographic
This slide shows the percentage of ABS Healthcare Company Records that are infected by Malware in the past 5 years. Present the topic in a bit more detail with this Abs Healthcare Company Overcome Challenge Cyber Security Healthcare Ppt Infographic. Use it as a tool for discussion and navigation on Industry, Programs, Reduce. This template is free to edit as deemed fit for your organization. Therefore download it now.
-
 Healthcare cybersecurity breaches worldwide overcome challenge cyber security healthcare
This slide shows the number of Healthcare Cybersecurity Breaches on a global scale for the past 5 years. It also provides the growth rate of key insights related to Healthcare Cybersecurity Breaches. Present the topic in a bit more detail with this Healthcare Cybersecurity Breaches Worldwide Overcome Challenge Cyber Security Healthcare. Use it as a tool for discussion and navigation on Healthcare Cybersecurity Breaches Worldwide. This template is free to edit as deemed fit for your organization. Therefore download it now.
-
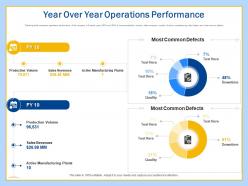 Year over year operations workplace transformation incorporating advanced tools technology
Following slide compares operations performance of the company in financial years 2018 and 2019. It covers production volume, sales revenues, number of active manufacturing plant status and most common defects. Present the topic in a bit more detail with this Year Over Year Operations Workplace Transformation Incorporating Advanced Tools Technology. Use it as a tool for discussion and navigation on Production, Revenues, Sales, Manufacturing. This template is free to edit as deemed fit for your organization. Therefore download it now.
-
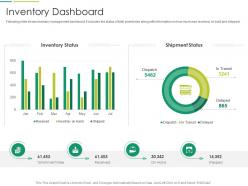 Inventory dashboard it transformation at workplace ppt themes
Following slide shows inventory management dashboard. It includes the status of total inventories along with information on how much was received, on hold and shipped. Present the topic in a bit more detail with this Inventory Dashboard IT Transformation At Workplace Ppt Themes. Use it as a tool for discussion and navigation on Inventory Dashboard. This template is free to edit as deemed fit for your organization. Therefore download it now.


