Charts, Graphs PowerPoint Designs, Presentation Charts Designs & PPT Graphics
- Sub Categories
-
- Arrows and Targets
- Bullet and Text Slides
- Charts and Graphs
- Circular Cycle Diagrams
- Concepts and Shapes
- Custom Flat Designs
- Dashboards and Measuring
- Flow Process
- Funnels
- Gears
- Growth
- Harvey Balls
- Idea Innovation and Light Bulbs
- Leadership
- Linear Process Diagrams
- Magnifying Glass
- Misc Other Graphics
- Opportunity and Handshake
- Organization Charts
- Puzzles
- Pyramids
- Roadmaps and Timelines
- Silhouettes
- Steps
- Strategic Planning Analysis
- SWOT Analysis
- Tables and Matrix
- Teamwork
- Technology and Communication
- Venn Diagrams
- Visuals and Illustrations
-
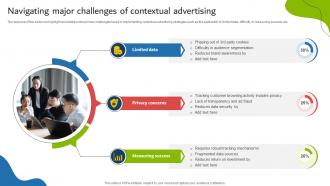 Navigating Major Challenges Of Contextual Advertising
The purpose of this slide is to highlight and address the primary challenges faced in implementing contextual advertising strategies such as the availability of limited data, difficulty in measuring success, etc.Presenting our well structured Navigating Major Challenges Of Contextual Advertising The topics discussed in this slide are Measuring Success, Privacy Concerns, Limited Data. This is an instantly available PowerPoint presentation that can be edited conveniently. Download it right away and captivate your audience.
-
 Trends In Contextual Advertising Aiding Internet Marketers
The purpose of this slide is to outline emerging trends in contextual advertising that are beneficial for internet marketers including billboards, behavioral advertising, etc.Presenting our well structured Trends In Contextual Advertising Aiding Internet Marketers The topics discussed in this slide are Market Penetration, Embedded Cameras, Audience Identification. This is an instantly available PowerPoint presentation that can be edited conveniently. Download it right away and captivate your audience.
-
 Market Share Of Different Media Industry Types
This slide covers share of major sectors under media industry such as TV, digital media, print, etc with categorization based on generation of revenue and key insights.Introducing our Market Share Of Different Media Industry Types set of slides. The topics discussed in these slides are Preferred Platform, Newspaper Magazines, Industry Segments. This is an immediately available PowerPoint presentation that can be conveniently customized. Download it and convince your audience.
-
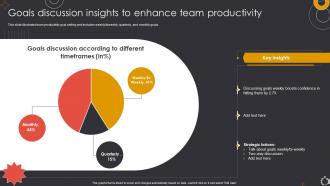 Goals Discussion Insights To Enhance Team Productivity
This slide illustrates team productivity goal setting and includes weeklyorbiweekly, quarterly, and monthly goals.Introducing our Goals Discussion Insights To Enhance Team Productivity set of slides. The topics discussed in these slides are Discussing Goals Weekly, Boosts Confidence, Team Productivity. This is an immediately available PowerPoint presentation that can be conveniently customized. Download it and convince your audience.
-
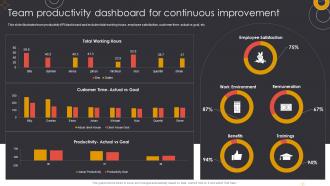 Team Productivity Dashboard For Continuous Improvement
This slide illustrates team productivity KPIordashboard and includes total working hours, employee satisfaction, customer time actual vs goal, etc.Introducing our Team Productivity Dashboard For Continuous Improvement set of slides. The topics discussed in these slides are Work Environment, Remuneration, Dashboard Continuous. This is an immediately available PowerPoint presentation that can be conveniently customized. Download it and convince your audience.
-
 Team Productivity Dashboard For Delivering Valuable Insights
This slide illustrates team productivity KPIordashboard and includes total tasks progress, tasks completed on time, and tasks age in progress.Presenting our well structured Team Productivity Dashboard For Delivering Valuable Insights The topics discussed in this slide are Productivity Dashboard, Delivering Valuable Insights. This is an instantly available PowerPoint presentation that can be edited conveniently. Download it right away and captivate your audience.
-
 Team Productivity Dashboard For Performance Monitoring
This slide illustrates team productivity KPIordashboard and includes time breakdown, productive time breakdown, progress against goals, etc.Presenting our well structured Team Productivity Dashboard For Performance Monitoring The topics discussed in this slide are Productivity Breakdown, Time Breakdown, Productive Time Breakdown. This is an instantly available PowerPoint presentation that can be edited conveniently. Download it right away and captivate your audience.
-
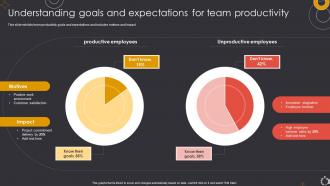 Understanding Goals And Expectations For Team Productivity
This slide exhibits team productivity goals and expectations and includes motives and impact.Presenting our well structured Understanding Goals And Expectations For Team Productivity The topics discussed in this slide are Innovation Stagnation, Unproductive Employees, Productive Employees. This is an instantly available PowerPoint presentation that can be edited conveniently. Download it right away and captivate your audience.
-
 Financial Projection Ride Sharing Business Model BMC SS V
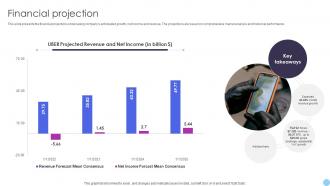
This slide presents the financial projections showcasing companys anticipated growth, net income and revenue. The projections are based on comprehensive market analysis and historical performance. Present the topic in a bit more detail with this Financial Projection Ride Sharing Business Model BMC SS V Use it as a tool for discussion and navigation on Projected Revenue, Net Income This template is free to edit as deemed fit for your organization. Therefore download it now.
-
 Revenue Model Ride Sharing Business Model BMC SS V
This slide showcases the plan how company earns revenue from the business. It include three segments and streams such as car rides, surge pricing, service divisions, and advertising and marketing. Present the topic in a bit more detail with this Revenue Model Ride Sharing Business Model BMC SS V Use it as a tool for discussion and navigation on Uber Revenue Segment Breakdown, Revenue Streams This template is free to edit as deemed fit for your organization. Therefore download it now.
-
 Financial Projection Programmable Communications Platform Business Model BMC SS V
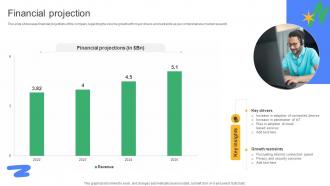
This slide showcases financial projections of the company regarding the income growth with major drivers and restraints as per comprehensive market research. Present the topic in a bit more detail with this Financial Projection Programmable Communications Platform Business Model BMC SS V Use it as a tool for discussion and navigation on Financial Projections, Growth Restraints This template is free to edit as deemed fit for your organization. Therefore download it now.
-
 Revenue Model Programmable Communications Platform Business Model BMC SS V
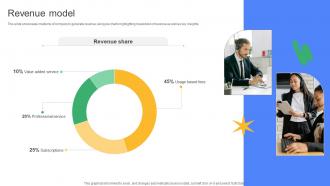
This slide showcases mediums of company to generate revenue using pie charts highlighting breakdown of revenue as well as key insights. Present the topic in a bit more detail with this Revenue Model Programmable Communications Platform Business Model BMC SS V Use it as a tool for discussion and navigation on Revenue Share, Professional Service This template is free to edit as deemed fit for your organization. Therefore download it now.
-
 Declining Graph Of Task Completion Rate Mastering Digital Project PM SS V
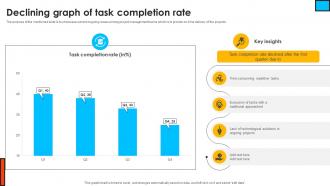
The purpose of the mentioned slide is to showcase current ongoing issues among project management teams which is to provide on-time delivery of the projects Present the topic in a bit more detail with this Declining Graph Of Task Completion Rate Mastering Digital Project PM SS V Use it as a tool for discussion and navigation on Task Completion, Declining Graph This template is free to edit as deemed fit for your organization. Therefore download it now.
-
 Digital Project Management Performance Analysis Dashboard Mastering Digital Project PM SS V
This slide represents dashboard to analyze progress and health of changes implemented to organizational projects. It includes details related to KPIs such as progress, cost, workload, etc. Deliver an outstanding presentation on the topic using this Digital Project Management Performance Analysis Dashboard Mastering Digital Project PM SS V Dispense information and present a thorough explanation of Health, Progress, Workload, Cost using the slides given. This template can be altered and personalized to fit your needs. It is also available for immediate download. So grab it now.
-
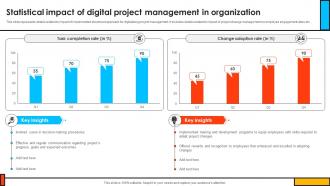 Statistical Impact Of Digital Project Management In Organization Mastering Digital Project PM SS V
This slide represents details related to impact of implemented structured approach for digitalizing project management. It includes details related to impact of project change management on employee engagement rates etc. Present the topic in a bit more detail with this Statistical Impact Of Digital Project Management In Organization Mastering Digital Project PM SS V Use it as a tool for discussion and navigation on Task Completion Rate, Change Adoption Rate This template is free to edit as deemed fit for your organization. Therefore download it now.
-
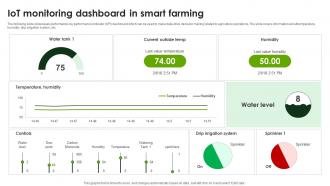 IoT Monitoring Dashboard In Smart Smart Agriculture Using IoT System IoT SS V
The following slide showcases performance key performance indicator KPI dashboard which can be used to make data-drive decision making related to agriculture operations. The slide covers information about temperature, humidity, drip irrigation system, etc. Present the topic in a bit more detail with this IoT Monitoring Dashboard In Smart Smart Agriculture Using IoT System IoT SS V. Use it as a tool for discussion and navigation on Water Tank, Value Temperature, Humidity. This template is free to edit as deemed fit for your organization. Therefore download it now.
-
 Market Size For IoT In Agriculture Smart Agriculture Using IoT System IoT SS V
The following slide display graphical representation of total market size for Internet of Things IoT in agriculture. Market size is covered for the period of 10 years 2021-2030 along with key insights. Deliver an outstanding presentation on the topic using this Market Size For IoT In Agriculture Smart Agriculture Using IoT System IoT SS V. Dispense information and present a thorough explanation of Food Companies, Market Size, Global Market using the slides given. This template can be altered and personalized to fit your needs. It is also available for immediate download. So grab it now.
-
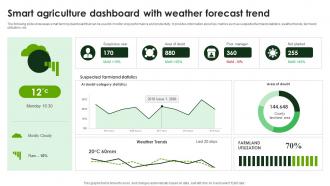 Smart Agriculture Dashboard With Smart Agriculture Using IoT System IoT SS V
The following slide showcases smart farming dashboard that can be used to monitor crop performance and productivity. It provides information about key metrics such as suspected farmland statistics, weather trends, farmland utilization, etc. Deliver an outstanding presentation on the topic using this Smart Agriculture Dashboard With Smart Agriculture Using IoT System IoT SS V. Dispense information and present a thorough explanation of Farmland Statistics, Category Statistics, Weather Trends using the slides given. This template can be altered and personalized to fit your needs. It is also available for immediate download. So grab it now.
-
 Smart Agriculture Market Across Asia Smart Agriculture Using IoT System IoT SS V
The following slide displays statistical representation of IoT agriculture market size across Asia-Pacific region. Information covered in this slide is related to period from 2018-2025 along with Compound Annual Growth Rate CAGR. Present the topic in a bit more detail with this Smart Agriculture Market Across Asia Smart Agriculture Using IoT System IoT SS V. Use it as a tool for discussion and navigation on Market Size, Agriculture Market, Raven Industries. This template is free to edit as deemed fit for your organization. Therefore download it now.
-
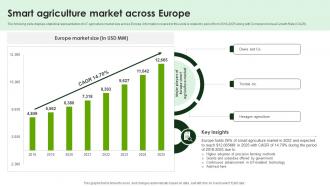 Smart Agriculture Market Across Europe Smart Agriculture Using IoT System IoT SS V
The following slide displays statistical representation of IoT agriculture market size across Europe. Information covered in this slide is related to period from 2018-2025 along with Compound Annual Growth Rate CAGR. Deliver an outstanding presentation on the topic using this Smart Agriculture Market Across Europe Smart Agriculture Using IoT System IoT SS V. Dispense information and present a thorough explanation of Agriculture Market, Farming Methods, Market Size using the slides given. This template can be altered and personalized to fit your needs. It is also available for immediate download. So grab it now.
-
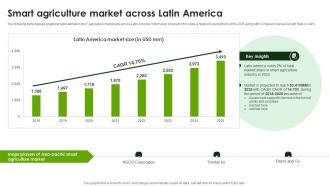 Smart Agriculture Market Across Latin Smart Agriculture Using IoT System IoT SS V
The following slide displays graphical representation of IoT agriculture market size across Latin America. Information covered in this slide is related to period from 2018-2025 along with Compound Annual Growth Rate CAGR. Present the topic in a bit more detail with this Smart Agriculture Market Across Latin Smart Agriculture Using IoT System IoT SS V. Use it as a tool for discussion and navigation on Agriculture Market, Market Size, Grants And Subsidies. This template is free to edit as deemed fit for your organization. Therefore download it now.
-
 Smart Agriculture Market Across Middle Eas Smart Agriculture Using IoT System IoT SS V
The following slide displays graphical representation of IoT agriculture market size across Middle East and Africa. Information covered in this slide is related to period from 2018-2025 along with Compound Annual Growth Rate CAGR. Deliver an outstanding presentation on the topic using this Smart Agriculture Market Across Middle Eas Smart Agriculture Using IoT System IoT SS V. Dispense information and present a thorough explanation of Agriculture Market, Growing Population, Farming Services using the slides given. This template can be altered and personalized to fit your needs. It is also available for immediate download. So grab it now.
-
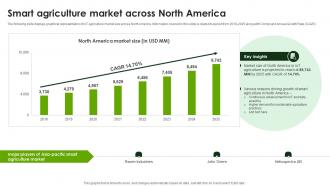 Smart Agriculture Market Across North Smart Agriculture Using IoT System IoT SS V
The following slide displays graphical representation of IoT agriculture market size across North America. Information covered in this slide is related to period from 2018-2025 along with Compound Annual Growth Rate CAGR. Present the topic in a bit more detail with this Smart Agriculture Market Across North Smart Agriculture Using IoT System IoT SS V. Use it as a tool for discussion and navigation on Agriculture Is Projected, Data Analytics, Sustainable Agriculture. This template is free to edit as deemed fit for your organization. Therefore download it now.
-
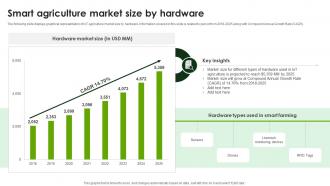 Smart Agriculture Market Size By Hardware Smart Agriculture Using IoT System IoT SS V
The following slide displays graphical representation of IoT agriculture market size by hardware. Information covered in this slide is related to period from 2018-2025 along with Compound Annual Growth Rate CAGR. Deliver an outstanding presentation on the topic using this Smart Agriculture Market Size By Hardware Smart Agriculture Using IoT System IoT SS V. Dispense information and present a thorough explanation of Monitoring Devices, Market Size, Agriculture Market using the slides given. This template can be altered and personalized to fit your needs. It is also available for immediate download. So grab it now.
-
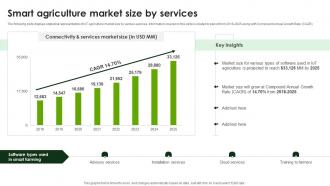 Smart Agriculture Market Size By Services Smart Agriculture Using IoT System IoT SS V
The following slide displays statistical representation of IoT agriculture market size by various services. Information covered in this slide is related to period from 2018-2025 along with Compound Annual Growth Rate CAGR. Present the topic in a bit more detail with this Smart Agriculture Market Size By Services Smart Agriculture Using IoT System IoT SS V. Use it as a tool for discussion and navigation on Market Size, Annual Growth, Agriculture Is Projected. This template is free to edit as deemed fit for your organization. Therefore download it now.
-
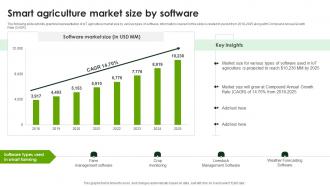 Smart Agriculture Market Size By Software Smart Agriculture Using IoT System IoT SS V
The following slide exhibits graphical representation of IoT agriculture market size by various types of software. Information covered in this slide is related to period from 2018-2025 along with Compound Annual Growth Rate CAGR. Deliver an outstanding presentation on the topic using this Smart Agriculture Market Size By Software Smart Agriculture Using IoT System IoT SS V. Dispense information and present a thorough explanation of Management Software, Crop Monitoring, Forecasting Software using the slides given. This template can be altered and personalized to fit your needs. It is also available for immediate download. So grab it now.
-
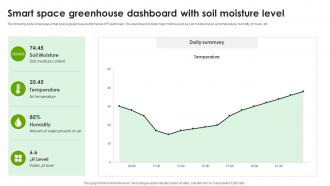 Smart Space Greenhouse Dashboard Smart Agriculture Using IoT System IoT SS V
The following slide showcases smart space greenhouse performance KPI dashboard. The dashboard include major metrics such as soil moisture level, air temperature, humidity, pH level, etc. Present the topic in a bit more detail with this Smart Space Greenhouse Dashboard Smart Agriculture Using IoT System IoT SS V. Use it as a tool for discussion and navigation on Soil Moisture, Temperature, Humidity. This template is free to edit as deemed fit for your organization. Therefore download it now.
-
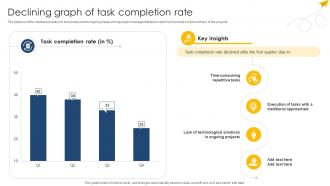 Declining Graph Of Task Completion Rate Digital Project Management Navigation PM SS V
The purpose of the mentioned slide is to showcase current ongoing issues among project management teams which is to provide on time delivery of the projects Present the topic in a bit more detail with this Declining Graph Of Task Completion Rate Digital Project Management Navigation PM SS V Use it as a tool for discussion and navigation on Technological Solutions, Traditional Approached, Repetitive Tasks This template is free to edit as deemed fit for your organization. Therefore download it now.
-
 Digital Project Management Digital Project Management Navigation PM SS V
This slide represents dashboard to analyze progress and health of changes implemented to organizational projects. It includes details related to KPIs such as progress, cost, workload, etc.Deliver an outstanding presentation on the topic using this Digital Project Management Digital Project Management Navigation PM SS V Dispense information and present a thorough explanation of Digital Project, Management Performance, Analysis Dashboard using the slides given. This template can be altered and personalized to fit your needs. It is also available for immediate download. So grab it now.
-
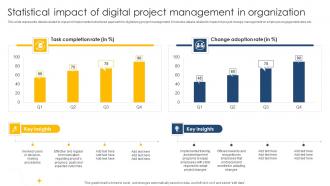 Statistical Impact Of Digital Project Digital Project Management Navigation PM SS V
This slide represents details related to impact of implemented structured approach for digitalizing project management. It includes details related to impact of project change management on employee engagement rates etc.Present the topic in a bit more detail with this Statistical Impact Of Digital Project Digital Project Management Navigation PM SS V Use it as a tool for discussion and navigation on Expected Outcomes, Implemented Training, Excelled Adopting This template is free to edit as deemed fit for your organization. Therefore download it now.
-
 Company First Time Manager Training Evaluation Dashboard
This slide depicts a dashboard highlighting an analysis of first time manager training provided to employees to enhance customer service. Introducing our Company First Time Manager Training Evaluation Dashboard set of slides. The topics discussed in these slides are Training Engagement Rate, Training Compliance, Participants By Training Mode. This is an immediately available PowerPoint presentation that can be conveniently customized. Download it and convince your audience.
-
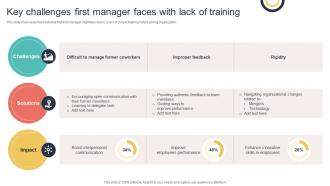 Key Challenges First Manager Faces With Lack Of Training
This slide showcases few obstacles that first manager might face due to a lack of proper training before joining organization. Introducing our Key Challenges First Manager Faces With Lack Of Training set of slides. The topics discussed in these slides are Challenges, Solutions, Impact. This is an immediately available PowerPoint presentation that can be conveniently customized. Download it and convince your audience.
-
 Budget Requirements For Applications Of IoT In Education Sector IoT SS V
Following slide exhibits budget allocation for implementing IoT devices and technology based infrastructure in educational premises. It includes elements such as technology deployment, security, integration, support, etc. Deliver an outstanding presentation on the topic using this Budget Requirements For Applications Of IoT In Education Sector IoT SS V. Dispense information and present a thorough explanation of Technology Implementation, Professional Consulting, Management Services using the slides given. This template can be altered and personalized to fit your needs. It is also available for immediate download. So grab it now.
-
 Global Market Size Of IoT In Applications Of IoT In Education Sector IoT SS V
Following slide exhibits global market view of using internet of things IoT in education sector. It provides insights about market value, CAGR, driving factors and advantages. Present the topic in a bit more detail with this Global Market Size Of IoT In Applications Of IoT In Education Sector IoT SS V. Use it as a tool for discussion and navigation on Global Market, Education Industry, Market Value. This template is free to edit as deemed fit for your organization. Therefore download it now.
-
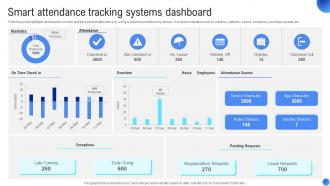 Smart Attendance Tracking Applications Of IoT In Education Sector IoT SS V
Following slide highlights dashboard to monitor and track student attendance by using Io enabled asset tracking devices. It includes indicators such as overtime, statistics, source, exceptions, pending requests, etc. Deliver an outstanding presentation on the topic using this Smart Attendance Tracking Applications Of IoT In Education Sector IoT SS V. Dispense information and present a thorough explanation of Early Going, Regularization Requests, Leave Requests using the slides given. This template can be altered and personalized to fit your needs. It is also available for immediate download. So grab it now.
-
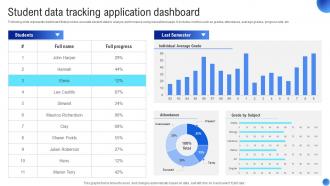 Student Data Tracking Applications Of IoT In Education Sector IoT SS V
Following slide represents dashboard that provides accurate student data to analyze performance using educational apps. It includes metrics such as grades, attendance, average grades, progress rate, etc. Present the topic in a bit more detail with this Student Data Tracking Applications Of IoT In Education Sector IoT SS V. Use it as a tool for discussion and navigation on Data Tracking, Application Dashboard, Average Grade. This template is free to edit as deemed fit for your organization. Therefore download it now.
-
 Cost Structure Fast Food Restaurant Business Model BMS SS V
This slide showcases expenses such as food and paper, payroll and employee health, occupancy and other operating expenses, depreciation and amortization, etc. Present the topic in a bit more detail with this Cost Structure Fast Food Restaurant Business Model BMS SS V. Use it as a tool for discussion and navigation on Cost Structure, Cost Breakdown. This template is free to edit as deemed fit for your organization. Therefore download it now.
-
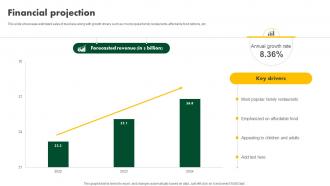 Financial Projection Fast Food Restaurant Business Model BMS SS V
This slide showcases estimated sales of business along with growth drivers such as most popular family restaurants, affordable food options, etc. Deliver an outstanding presentation on the topic using this Financial Projection Fast Food Restaurant Business Model BMS SS V. Dispense information and present a thorough explanation of Financial Projection, Family Restaurants, Affordable Food using the slides given. This template can be altered and personalized to fit your needs. It is also available for immediate download. So grab it now.
-
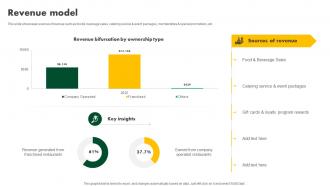 Revenue Model Fast Food Restaurant Business Model BMS SS V
This slide showcases sources of revenue such as food and beverage sales, catering service and event packages, memberships and special promotions, etc. Deliver an outstanding presentation on the topic using this Revenue Model Fast Food Restaurant Business Model BMS SS V. Dispense information and present a thorough explanation of Revenue Model, Beverage Sales, Program Rewards using the slides given. This template can be altered and personalized to fit your needs. It is also available for immediate download. So grab it now.
-
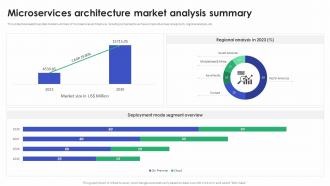 Microservices Architecture Market Analysis Summary
This slide showcases the global market summary of microservices architecture, including components such as compound annual rate growth, regional analysis, etc. Present the topic in a bit more detail with this Microservices Architecture Market Analysis Summary. Use it as a tool for discussion and navigation on Microservices Architecture, Market Analysis Summary, Compound Annual Rate Growth, Regional Analysis. This template is free to edit as deemed fit for your organization. Therefore download it now.
-
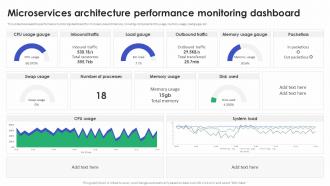 Microservices Architecture Performance Monitoring Dashboard
This slide showcases the performance monitoring dashboard for microservices architecture, including components CPU usage, memory usage, load gauge, etc. Deliver an outstanding presentation on the topic using this Microservices Architecture Performance Monitoring Dashboard. Dispense information and present a thorough explanation of Microservices Architecture, Performance, Monitoring Dashboard, Memory Usage using the slides given. This template can be altered and personalized to fit your needs. It is also available for immediate download. So grab it now.
-
 Microservices Architecture Training Cost Distribution
This slide showcases the training cost distribution, including various components of the training budget, such as instructors cost, training material cost, and so on. Present the topic in a bit more detail with this Microservices Architecture Training Cost Distribution. Use it as a tool for discussion and navigation on Microservices Architecture, Training Cost Distribution, Training Cost Distribution. This template is free to edit as deemed fit for your organization. Therefore download it now.
-
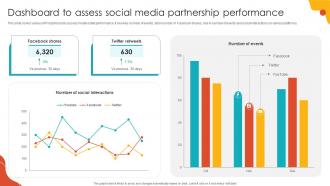 Dashboard To Assess Social Media Partnership Performance
This slide covers various KPI dashboard to assess media outlet performance. It involves number of events, total number of Facebook shares, rise in number of events and social interactions on various platforms. Introducing our Dashboard To Assess Social Media Partnership Performance set of slides. The topics discussed in these slides are Facebook Shares, Twitter Retweets This is an immediately available PowerPoint presentation that can be conveniently customized. Download it and convince your audience.
-
 Impact Of Social Media Partnership On Business Kpis
This slide analysis impact of adopting media partnership strategy on business growth. It involves impact on KPIs such as website traffic And churn rate by leveraging influencer marketing on Instagram and SEO optimization. Presenting our well structured Impact Of Social Media Partnership On Business Kpis The topics discussed in this slide are Website Traffic, Churn Rate, Increase Website Traffic. This is an instantly available PowerPoint presentation that can be edited conveniently. Download it right away and captivate your audience.
-
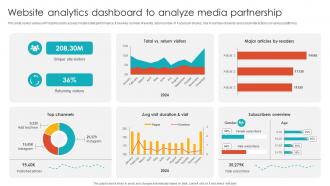 Website Analytics Dashboard To Analyze Media Partnership
This slide covers various KPI dashboard to assess media outlet performance. It involves number of events, total number of Facebook shares, rise in number of events and social interactions on various platforms. Introducing our Website Analytics Dashboard To Analyze Media Partnership set of slides. The topics discussed in these slides are Returning Visitors, Unique Site Visitors This is an immediately available PowerPoint presentation that can be conveniently customized. Download it and convince your audience.
-
 Improve Supply Chain Processes Using Big Data Statisticalillustration
This slide showcases big data platforms in the supply chain for creating responsive, agile with enhanced visibility and efficiency processes. It includes bases such as growth drivers, and opportunities available. Introducing our Improve Supply Chain Processes Using Big Data Statisticalillustration set of slides. The topics discussed in these slides are Growth Drivers, Opportunities. This is an immediately available PowerPoint presentation that can be conveniently customized. Download it and convince your audience.
-
 Study Big Data Platform Market Size For Competitive Analysis
This slide highlights big data platforms market size serving foundational element for informed decision-making, strategy formulation, and overall business success. It includes aspects such as growth drivers, and opportunities. Introducing our Study Big Data Platform Market Size For Competitive Analysis set of slides. The topics discussed in these slides are Growth Drivers, Opportunities. This is an immediately available PowerPoint presentation that can be conveniently customized. Download it and convince your audience.
-
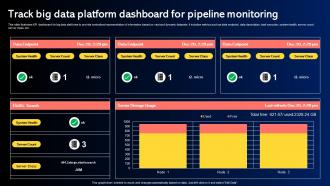 Track Big Data Platform Dashboard For Pipeline Monitoring
This slide illustrates KPI dashboard for big data platforms to provide centralized representation of information based on vast and dynamic datasets. It includes metrics such as data endpoint, data description, task executor, system health, server count, server class, etc. Introducing our Track Big Data Platform Dashboard For Pipeline Monitoring set of slides. The topics discussed in these slides are System Health, Server Count, Server Class. This is an immediately available PowerPoint presentation that can be conveniently customized. Download it and convince your audience.
-
 Financial Projections Fashion Retailer Business Model BMC SS V
This slide presents the financial projections showcasing the companys anticipated growth, net income, cost, and risk. The predictions are based on comprehensive market analysis and historical performance. Deliver an outstanding presentation on the topic using this Financial Projections Fashion Retailer Business Model BMC SS V. Dispense information and present a thorough explanation of Financial Projections using the slides given. This template can be altered and personalized to fit your needs. It is also available for immediate download. So grab it now.
-
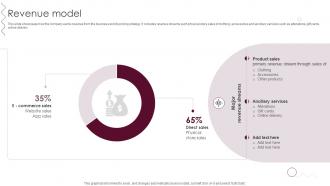 Revenue Model Fashion Retailer Business Model BMC SS V
This slide showcases how the company earns revenue from the business and its pricing strategy. It includes revenue streams such physical store sales of clothing, accessories and ancillary services such as alterations, gift cards, online delivery. Present the topic in a bit more detail with this Revenue Model Fashion Retailer Business Model BMC SS V. Use it as a tool for discussion and navigation on Product Sales, Ancillary Services, Major Revenue Streams. This template is free to edit as deemed fit for your organization. Therefore download it now.
-
 Blockchains Impact On Education Enhancing Blockchain In Education Market Size And Type Share BCT SS V
This slide covers focus on integration of blockchain technology within the education sector based on market size and share type. It includes elements such as market size from 2021 2028 along with key insights and applications covering credential verifications, expanding moocs, digital rights protection, open source universities, school assets tracking, etc. Deliver an outstanding presentation on the topic using this Blockchains Impact On Education Enhancing Blockchain In Education Market Size And Type Share BCT SS V Dispense information and present a thorough explanation of Blockchain Education, Market Size, Type Share using the slides given. This template can be altered and personalized to fit your needs. It is also available for immediate download. So grab it now.
-
 Blockchains Impact On Education Criteria When Selecting A Credential Verification Solution BCT SS V
This slide covers essential factors to consider when choosing a solution for verifying digital credentials. It includes criteria such as speed of processing transactions, results accuracy, SaaS solutions, ID documents worldwide coverage, on premises data processing, multiple document authencity check, one supply solution for biometric checks and ID verification, integration and data export, deployment speed, etc. Present the topic in a bit more detail with this Blockchains Impact On Education Criteria When Selecting A Credential Verification Solution BCT SS V Use it as a tool for discussion and navigation on Criteria When Selecting, Credential Verification Solution This template is free to edit as deemed fit for your organization. Therefore download it now.
-
 Blockchains Impact On Education Enhancing In Depth Analysis Of Identity Credential Fraud BCT SS V
This slide covers data about patterns and trends related to identity credential fraud. It includes identity credential data based on document and biometric fraud for year 2019, 2020, 2021 and 2022 along with insights on false credentials. Deliver an outstanding presentation on the topic using this Blockchains Impact On Education Enhancing In Depth Analysis Of Identity Credential Fraud BCT SS V Dispense information and present a thorough explanation of Depth Analysis, Identity Credential Fraud using the slides given. This template can be altered and personalized to fit your needs. It is also available for immediate download. So grab it now.
-
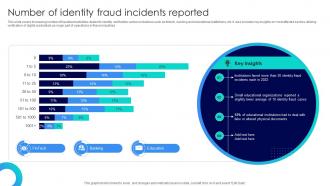 Blockchains Impact On Education Enhancing Number Of Identity Fraud Incidents Reported BCT SS V
This slide covers increasing number of fraudulent activities related to identity verification various industries such as fintech, banking and educational institutions, etc. It also includes key insights on most affected sectors utilizing verification of digital credentials as major part of operations in these industries. Present the topic in a bit more detail with this Blockchains Impact On Education Enhancing Number Of Identity Fraud Incidents Reported BCT SS V Use it as a tool for discussion and navigation on Number Identity, Fraud Incidents Reported This template is free to edit as deemed fit for your organization. Therefore download it now.
-
 Blockchains Impact On Education Enhancing Online Education Market Share Analysis BCT SS V
This slide covers assessing market size and share for online education industry. It includes elements such as market size from 2021 2028 along with key insights related to future demand for digital educational market for students, teachers and institutes. Present the topic in a bit more detail with this Blockchains Impact On Education Enhancing Online Education Market Share Analysis BCT SS V Use it as a tool for discussion and navigation on Online Education, Market Share Analysis This template is free to edit as deemed fit for your organization. Therefore download it now.
-
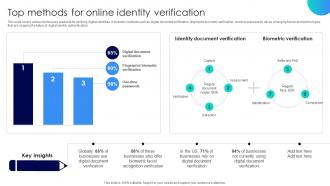 Blockchains Impact On Education Enhancing Top Methods For Online Identity Verification BCT SS V
This slide covers various techniques available for verifying digital identities. It includes methods such as digital document verification, fingerprint biometric verification, one time passwords, etc as emerging trends and technologies that are shaping the future of digital identity authentication. Present the topic in a bit more detail with this Blockchains Impact On Education Enhancing Top Methods For Online Identity Verification BCT SS V Use it as a tool for discussion and navigation on Biometric Verification, Identity Document Verification This template is free to edit as deemed fit for your organization. Therefore download it now.
-
 Balance Sheet Assets Athletics Equipment Company Profile CP SS V
This slide represents the balance sheet financials Assets of Puma. It includes elements such as current assets and total assets. Present the topic in a bit more detail with this Balance Sheet Assets Athletics Equipment Company Profile CP SS V Use it as a tool for discussion and navigation on Balance Sheet Assets This template is free to edit as deemed fit for your organization. Therefore download it now.
-
 Balance Sheet Liabilities Athletics Equipment Company Profile CP SS V
This slide represents the balance sheet financials Liabilities of Puma. It includes elements such as current liabilities, shareholders equity and total liabilities. Deliver an outstanding presentation on the topic using this Balance Sheet Liabilities Athletics Equipment Company Profile CP SS V Dispense information and present a thorough explanation of Balance Sheet Liabilities using the slides given. This template can be altered and personalized to fit your needs. It is also available for immediate download. So grab it now.
-
 Business Segment Asia Pacific Without Greater China Athletics Equipment Company Profile CP SS V
This slide showcases the key financial metrics of Asia pacific without greater china segment. It includes financial metrics such as external sales, inventories, investments and EBIT. Present the topic in a bit more detail with this Business Segment Asia Pacific Without Greater China Athletics Equipment Company Profile CP SS V Use it as a tool for discussion and navigation on Business Segment This template is free to edit as deemed fit for your organization. Therefore download it now.
-
 Business Segment Europe Athletics Equipment Company Profile CP SS V
This slide showcases the key financial metrics of Europe segment. It includes financial metrics such as external sales, inventories, investments and EBIT. Deliver an outstanding presentation on the topic using this Business Segment Europe Athletics Equipment Company Profile CP SS V Dispense information and present a thorough explanation of Business Segment using the slides given. This template can be altered and personalized to fit your needs. It is also available for immediate download. So grab it now.


