Dashboards Measuring PowerPoint Designs, Presentations Slides & PPT Shapes
- Sub Categories
-
- Arrows and Targets
- Bullet and Text Slides
- Charts and Graphs
- Circular Cycle Diagrams
- Concepts and Shapes
- Custom Flat Designs
- Dashboards and Measuring
- Flow Process
- Funnels
- Gears
- Growth
- Harvey Balls
- Idea Innovation and Light Bulbs
- Leadership
- Linear Process Diagrams
- Magnifying Glass
- Misc Other Graphics
- Opportunity and Handshake
- Organization Charts
- Puzzles
- Pyramids
- Roadmaps and Timelines
- Silhouettes
- Steps
- Strategic Planning Analysis
- SWOT Analysis
- Tables and Matrix
- Teamwork
- Technology and Communication
- Venn Diagrams
- Visuals and Illustrations
-
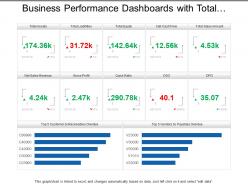 Business performance dashboards with total assets gross profit and cash flow
Presenting, business performance dashboards with total assets gross profit and cash flow PPT deck. Adjustable color, text, and font as per the need. Engaging and easy to comprehend infographic format. Even download and can be converted into JPG and PDF format. The advantage of the addition of logo and trademarks for personalization. Adaptable to widescreen view without the problem of pixelation. Exposition illustration well-matched with google slides. Related designs available with different nodes and stages. Possible in 4:3 and full-screen version 16:9
-
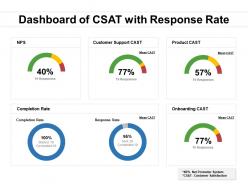 Dashboard of csat with response rate
Presenting this set of slides with name Dashboard Of CSAT With Response Rate. This is a three stage process. The stages in this process are Unsatisfied, Neutral, Satisfaction . This is a completely editable PowerPoint presentation and is available for immediate download. Download now and impress your audience.
-
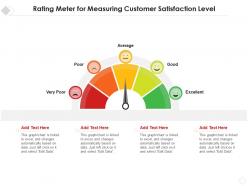 Rating meter for measuring customer satisfaction level
Introducing our premium set of slides with Rating Meter For Measuring Customer Satisfaction Level. Ellicudate the four stages and present information using this PPT slide. This is a completely adaptable PowerPoint template design that can be used to interpret topics like Rating Meter For Measuring Customer Satisfaction Level. So download instantly and tailor it with your information.
-
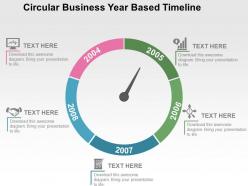 Circular business year based timeline flat powerpoint design
We are proud to present our circular business year based timeline flat powerpoint design. Graphic of circular business year timeline diagram has been used to craft this power point template diagram. This PPT diagram contains the concept of business process flow and timeline formation. This PPT diagram can be used for business and marketing related presentations.
-
 Customer Success KPI Dashboard To Measure Support Team Performance Ppt Show
Mentioned slide showcases customer success dashboard that company is currently using to measure its support team performance. KPIs covered in the dashboard are health score, retention cost, churn rate etc. Present the topic in a bit more detail with this Customer Success KPI Dashboard To Measure Support Team Performance Ppt Show. Use it as a tool for discussion and navigation on Customer Success KPI Dashboard To Measure Support Team Performance. This template is free to edit as deemed fit for your organization. Therefore download it now.
-
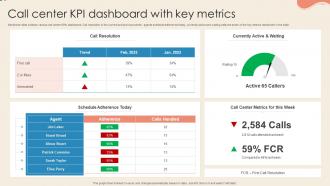 Call Center KPI Dashboard With Key Metrics
Mentioned slide outlines various call center KPIs dashboard. Call resolution in the current and previous month, agents schedule adherence today, currently active and waiting calls are some of the key metrics mentioned in the slide. Presenting our well structured Call Center KPI Dashboard With Key Metrics. The topics discussed in this slide are Call Resolution, Currently Active, Agent. This is an instantly available PowerPoint presentation that can be edited conveniently. Download it right away and captivate your audience.
-
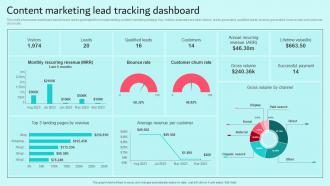 Content Marketing Lead Tracking Dashboard Brand Content Strategy Guide MKT SS V
This slide showcases dashboard used to track leads generated from implementing content marketing strategy. Key metrics evaluated are total visitors, leads generated, qualified leads, revenue generated, bounce rate and customer churn rate. Present the topic in a bit more detail with this Content Marketing Lead Tracking Dashboard Brand Content Strategy Guide MKT SS V. Use it as a tool for discussion and navigation on Customers, Annual, Revenue. This template is free to edit as deemed fit for your organization. Therefore download it now.
-
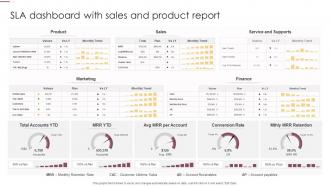 SLA Dashboard Snapshot With Sales And Product Report
Introducing our SLA Dashboard Snapshot With Sales And Product Report set of slides. The topics discussed in these slides are Marketing, Finance, Service And Supports. This is an immediately available PowerPoint presentation that can be conveniently customized. Download it and convince your audience.
-
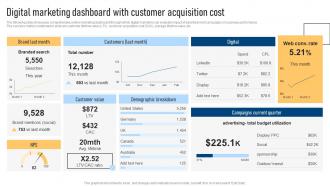 Digital Marketing Dashboard With Effective Marketing Strategies For Bootstrapped Strategy SS V
The following slide showcases comprehensive online marketing dashboard through which digital marketers can evaluate impact of advertisement campaigns on business performance. The success metrics mentioned in slide are customer lifetime value LTV, customer acquisition cost CAC, average lifetime value, etc. Deliver an outstanding presentation on the topic using this Digital Marketing Dashboard With Effective Marketing Strategies For Bootstrapped Strategy SS V. Dispense information and present a thorough explanation of Marketing, Digital, Cost using the slides given. This template can be altered and personalized to fit your needs. It is also available for immediate download. So grab it now.
-
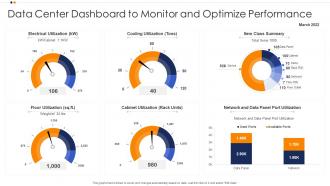 Data Center Dashboard Snapshot To Monitor And Optimize Performance
Presenting our well structured Data Center Dashboard Snapshot To Monitor And Optimize Performance. The topics discussed in this slide are Data Center Dashboard, Monitor And Optimize Performance, Cabinet Utilization. This is an instantly available PowerPoint presentation that can be edited conveniently. Download it right away and captivate your audience.
-
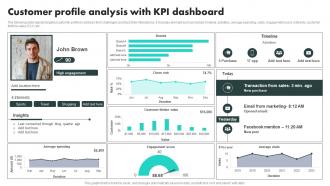 Customer Data Platform Adoption Process Customer Profile Analysis With KPI Dashboard
The following slide depicts targeted customer profile to address their challenges and track their interactions. It includes element such as brands, timeline, activities, average spending, visits, engagement score, interests, customer lifetime value CLV etc. Present the topic in a bit more detail with this Customer Data Platform Adoption Process Customer Profile Analysis With KPI Dashboard. Use it as a tool for discussion and navigation on Connected, Email, Marketing. This template is free to edit as deemed fit for your organization. Therefore download it now.
-
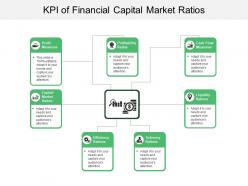 Kpi of financial capital market ratios
Presenting this set of slides with name - Kpi Of Financial Capital Market Ratios. This is a seven stage process. The stages in this process are Kpi, Dashboard, Metrics.
-
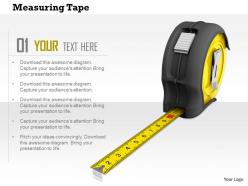 0814 3d Yellow And Black Measuring Tape For Professional Use Image Graphics For Powerpoint
We are proud to present our 0814 3d yellow and black measuring tape for professional use image graphics for powerpoint. This is a wonderful image slide of yellow and black measuring tape for professional use. This image has been crafted with 3d graphic of industrial measuring tape. Use this template for presentations related to architecture, blue print and construction. Concepts of business which can be measured may also be explained using this image slide. This image slide is 100 percent editable. Charm your audience with this image slide.
-
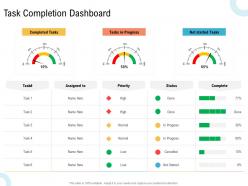 Task completion dashboard creating an effective content planning strategy for website ppt sample
Increase audience engagement and knowledge by dispensing information using Task Completion Dashboard Creating An Effective Content Planning Strategy For Website Ppt Sample. This template helps you present information on three stages. You can also present information on completed tasks, tasks in progress, net started tasksusing this PPT design. This layout is completely editable so personaize it now to meet your audiences expectations.
-
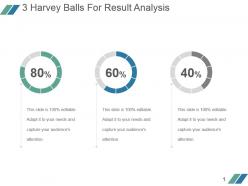 3 harvey balls for result analysis example of ppt
Presenting 3 harvey balls for result analysis example of ppt. This is a 3 harvey balls for result analysis example of ppt. This is a three stage process. The stages in this process are finance, process, business, marketing, percentage.
-
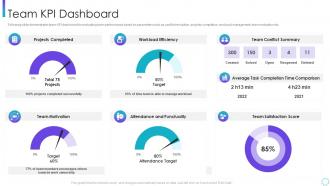 Team kpi dashboard corporate program improving work team productivity
Following slide demonstrates team KPI dashboard for evaluating team performance based on parameters such as conflict resolution, projects completion, workload management, team motivation etc. Deliver an outstanding presentation on the topic using this Team Kpi Dashboard Corporate Program Improving Work Team Productivity. Dispense information and present a thorough explanation of Team KPI Dashboard using the slides given. This template can be altered and personalized to fit your needs. It is also available for immediate download. So grab it now.
-
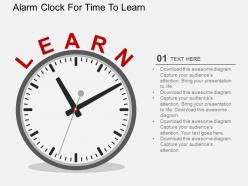 Alarm clock for time to learn flat powerpoint design
We are proud to present our alarm clock for time to learn flat powerpoint design. This power point template diagram has been crafted with graphic of alarm clock. This PPT diagram contains the concept of time management and learning. Use this PPT diagram for business and marketing related presentations.
-
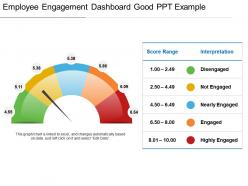 Employee engagement dashboard snapshot good ppt example
Presenting employee engagement dashboard snapshot good PPT example presentation slides. Simple data input like company logo, name or trademark. This PowerPoint template is fully supported by Google Slides. User can edit the data in linked excel sheet and graphs and charts gets customized accordingly. This layout offers fast downloading speed and formats can be easily changed to JPEG and PDF applications. This template is suitable for marketing, sales persons, business managers and entrepreneurs. Adjust PPT layout, font, text and color as per your necessity.
-
 Customers rating scale meter icon
Presenting this set of slides with name Customers Rating Scale Meter Icon. This is a three stage process. The stages in this process are Product Improvement, Rating Scale, Product Quality. This is a completely editable PowerPoint presentation and is available for immediate download. Download now and impress your audience.
-
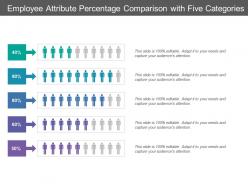 Employee attribute percentage comparison with five categories
Presenting this set of slides with name - Employee Attribute Percentage Comparison With Five Categories. This is a five stage process. The stages in this process are Percentage Comparison, Percentage Compare, Percentage Balancing.
-
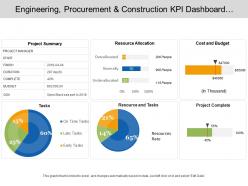 Engineering procurement and construction kpi dashboard showing project summary cost and budget
Presenting this set of slides with name - Engineering Procurement And Construction Kpi Dashboard Showing Project Summary Cost And Budget. This is a four stage process. The stages in this process are Engineering, Procurement And Construction, Construction Management, Engineering, Purchasing And Construction .
-
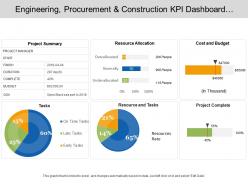 Engineering procurement and construction kpi dashboard showcasing project summary cost and budget
Presenting this set of slides with name - Engineering Procurement And Construction Kpi Dashboard Showcasing Project Summary Cost And Budget. This is a five stage process. The stages in this process are Engineering, Procurement And Construction, Construction Management, Engineering, Purchasing And Construction .
-
 Encircling the date on calendar as reminder
Presenting this set of slides with name Encircling The Date On Calendar As Reminder. This is a one stage process. The stages in this process are Reminder, Calendar, Sale Reminder. This is a completely editable PowerPoint presentation and is available for immediate download. Download now and impress your audience.
-
 Sticky notes attached with pin as reminder icon
Presenting this set of slides with name Sticky Notes Attached With Pin As Reminder Icon. This is a one stage process. The stages in this process are Reminder, Calendar, Sale Reminder. This is a completely editable PowerPoint presentation and is available for immediate download. Download now and impress your audience.
-
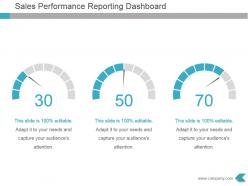 Sales performance reporting dashboard powerpoint template
Presenting sales performance reporting dashboard powerpoint template. This is a sales performance reporting dashboard powerpoint template. This is a three stage process. The stages in this process are dashboard, management, process, strategy, analysis.
-
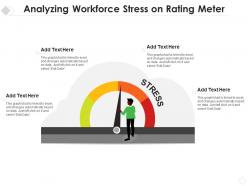 Analyzing workforce stress on rating meter
Presenting our set of slides with Analyzing Workforce Stress On Rating Meter. This exhibits information on four stages of the process. This is an easy to edit and innovatively designed PowerPoint template. So download immediately and highlight information on Analyzing Workforce Stress On Rating Meter.
-
 Four staged medical infographics flat powerpoint design
We are proud to present our four staged medical infographics flat powerpoint design. This power point template diagram has been crafted with graphic of four staged medical info graphics. These icons are used to show the medical information. Use this PPT diagram for business and medical related presentations.
-
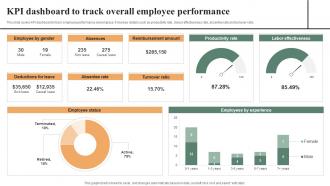 KPI Dashboard To Track Overall Employee Effective Workplace Culture Strategy SS V
This slide covers KPI dashboard to track employee performance at workplace. It involves details such as productivity rate, labour effectiveness rate, absentee rate and turnover ratio. Deliver an outstanding presentation on the topic using this KPI Dashboard To Track Overall Employee Effective Workplace Culture Strategy SS V. Dispense information and present a thorough explanation of Employee, Deductions, Reimbursement using the slides given. This template can be altered and personalized to fit your needs. It is also available for immediate download. So grab it now.
-
 Bm sand clock with blue growth arrow flat powerpoint design
Presenting bm sand clock with blue growth arrow flat powerpoint design. This Power Point template diagram has been crafted with graphic of sand clock and blue growth arrow . This PPT diagram contains the concept of growth analysis and time management .Use this PPT diagram for business and marketing related presentations.
-
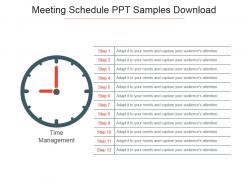 Meeting schedule ppt samples download
Presenting meeting schedule ppt samples download. This is a meeting schedule ppt samples download. This is a one stage process. The stages in this process are time management, dashboard, business, marketing, planning.
-
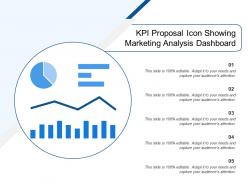 Kpi proposal icon showing marketing analysis dashboard
Presenting this set of slides with name - Kpi Proposal Icon Showing Marketing Analysis Dashboard. This is a five stage process. The stages in this process are Kpi Proposal, Kpi Plan, Kpi Scheme.
-
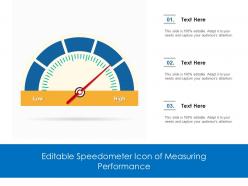 Editable speedometer icon of measuring performance
Presenting this set of slides with name Editable Speedometer Icon Of Measuring Performance. The topics discussed in these slide is Editable Speedometer Icon Of Measuring Performance. This is a completely editable PowerPoint presentation and is available for immediate download. Download now and impress your audience.
-
 PPC Marketing KPI Dashboard To Analyse Strategy MDSS To Improve Campaign Effectiveness MKT SS V
This slide covers PPC marketing dashboard to improve efficiency. It involves total spends, number of clicks, cost per conversion, change in conversion rate and cost per thousand impression. Present the topic in a bit more detail with this PPC Marketing KPI Dashboard To Analyse Strategy MDSS To Improve Campaign Effectiveness MKT SS V. Use it as a tool for discussion and navigation on Marketing, Strategy, Analyse. This template is free to edit as deemed fit for your organization. Therefore download it now.
-
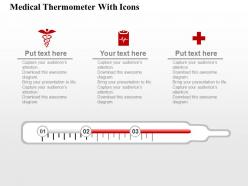 Medical thermometer with icons flat powerpoint design
We are proud to present our medical thermometer with icons flat powerpoint design. This power point icon template has been crafted with graphic of medical thermometer and icons. This diagram template contains the concept of measurement. Use this PPT diagram for medical and science related presentations.
-
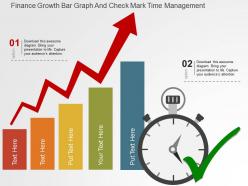 Finance growth bar graph and check mark time management flat powerpoint design
We are proud to present our finance growth bar graph and check mark time management flat powerpoint design. Graphic of bar graph and check mark has been used to craft this power point template diagram. This PPT diagram contains the concept of financial growth and time management. This PPT diagram can be used for business and finance related presentations.
-
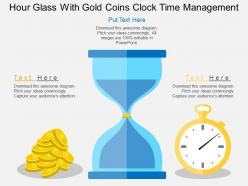 Hour glass with gold coins clock time management flat powerpoint design
We are proud to present our hour glass with gold coins clock time management flat powerpoint design. Graphic of hour glass with gold coins and clock has been used to design this power point template diagram. This PPT diagram contains the concept of time management. Use this PPT diagram for business and marketing related presentations.
-
 Man hours with arrow icon
Presenting this set of slides with name Man Hours With Arrow Icon. This is a three stage process. The stages in this process are Man Hours With Arrow Icon. This is a completely editable PowerPoint presentation and is available for immediate download. Download now and impress your audience.
-
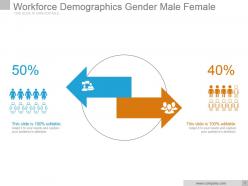 Workforce demographics gender male female sample of ppt
Presenting workforce demographics gender male female sample of ppt. This is a workforce demographics gender male female sample of ppt. This is a two stage process. The stages in this process are business, marketing, arrow, census, icons.
-
 Customer lifetime value and total mrr sales dashboards
Presenting this set of slides with name - Customer Lifetime Value And Total Mrr Sales Dashboards. This is a three stage process. The stages in this process are Sales Dashboard, Sales Kpis, Sales Performance.
-
 Content Marketing Lead Tracking Brands Content Strategy Blueprint MKT SS V
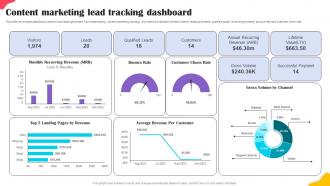
This slide showcases dashboard used to track leads generated from implementing content marketing strategy. Key metrics evaluated are total visitors, leads generated, qualified leads, revenue generated, bounce rate and customer churn rate. Deliver an outstanding presentation on the topic using this Content Marketing Lead Tracking Brands Content Strategy Blueprint MKT SS V. Dispense information and present a thorough explanation of Marketing, Tracking, Qualified using the slides given. This template can be altered and personalized to fit your needs. It is also available for immediate download. So grab it now.
-
 Server Migration Dashboard With Infrastructure Platform Analytics
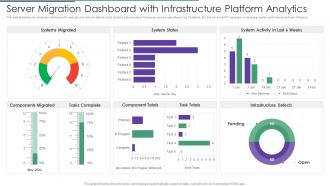
This slide illustrates risk landscape dashboard for malware and network attacks which contains malware attack frequency, country wise attacks, top 10 attacks, etc. this can benefit IT managers in managing system performance and task efficiency. Presenting our well structured Server Migration Dashboard With Infrastructure Platform Analytics. The topics discussed in this slide are Components Migrated, Infrastructure Defects, Systems Migrated. This is an instantly available PowerPoint presentation that can be edited conveniently. Download it right away and captivate your audience.
-
 Risk Assessment Dashboard For Securing Supply Chain System
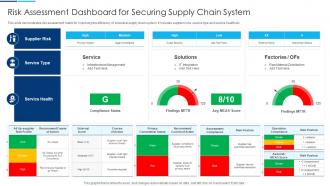
This slide demonstrates risk assessment matrix for improving the efficiency of industrial supply chain system. It includes supplier risks, service type and service health etc. Presenting our well structured Risk Assessment Dashboard For Securing Supply Chain System. The topics discussed in this slide are Service Health, Service Type, Supplier Risk. This is an instantly available PowerPoint presentation that can be edited conveniently. Download it right away and captivate your audience.
-
 Measuring Success Pmi Project Management Ppt Example
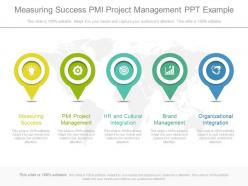
Presenting measuring success pmi project management ppt example. This is a measuring success pmi project management ppt example. This is a five stage process. The stages in this process are business, icons, process.
-
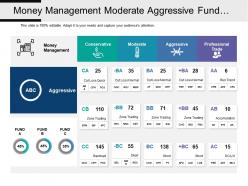 Money management moderate aggressive fund market analytics table with icons
Presenting this set of slides with name - Money Management Moderate Aggressive Fund Market Analytics Table With Icons. This is a five stage process. The stages in this process are Marketing Analytics, Marketing Performance, Marketing Discovery.
-
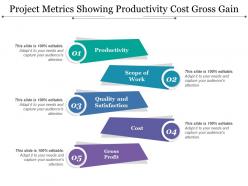 Project metrics showing productivity cost gross gain
Presenting this set of slides with name - Project Metrics Showing Productivity Cost Gross Gain. This is a five stage process. The stages in this process are Project Kpis, Project Dashboard, Project Metrics.
-
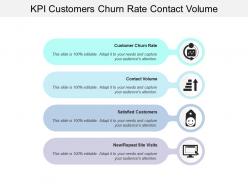 Kpi customers churn rate contact volume
Presenting this set of slides with name - Kpi Customers Churn Rate Contact Volume. This is a four stage process. The stages in this process are Kpi, Dashboard, Metrics.
-
 Clock with plan text time management flat powerpoint design
We are proud to present our clock with plan text time management flat powerpoint design. Graphic of clock with plan text diagram has been used to design this power point template diagram. This PPT diagram contains the concept of time management. Use this PPT diagram for business and marketing related presentations.
-
 Bulb with meter for speed control flat powerpoint design
We are proud to present our bulb with meter for speed control flat powerpoint design. This power point template diagram has been crafted with graphic of bulb with meter. This PPT diagram contains the concept of speed control .Use this PPT diagram for business and marketing related presentations.
-
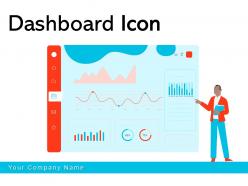 Dashboard Icon Analysis Performance Indicators Informational Business
It covers all the important concepts and has relevant templates which cater to your business needs. This complete deck has PPT slides on Dashboard Icon Analysis Performance Indicators Informational Business with well suited graphics and subject driven content. This deck consists of total of twelve slides. All templates are completely editable for your convenience. You can change the colour, text and font size of these slides. You can add or delete the content as per your requirement. Get access to this professionally designed complete deck presentation by clicking the download button below.
-
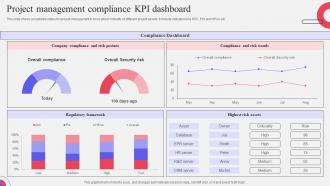 Project Management Compliance KPI Dashboard
This slide shows compliance status for project management to know about criticality of different project assets. It Include indicators like SOX, PCI and HPAA etc Presenting our well structured Project Management Compliance KPI Dashboard. The topics discussed in this slide are Management, Project, Compliance. This is an instantly available PowerPoint presentation that can be edited conveniently. Download it right away and captivate your audience.
-
 1113 Business Ppt Diagram Measuring Scale With Pointer Powerpoint Template
We are proud to present our 1113 business ppt diagram measuring scale with pointer powerpoint template. This PPT diagram has been conceived to enable you to emphatically communicate your ideas. Adjust the above image in your PPT presentations to visually support your content in an impressive way.
-
 Medicine reminder bell icon
Presenting this set of slides with name Calendar Reminder Image. This is a one stage process. The stages in this process are Reminder, Calendar, Sale Reminder. This is a completely editable PowerPoint presentation and is available for immediate download. Download now and impress your audience.
-
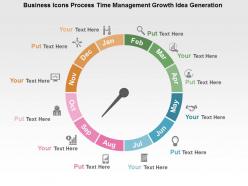 Business icons process time management growth idea generation flat powerpoint design
We are proud to present our business icons process time management growth idea generation flat powerpoint design. Concept of time management and growth can be explained with this PPT diagram. This PPT diagram contains the graphic of business icons process flow diagram. Use this PPT diagram for business and management related presentations.
-
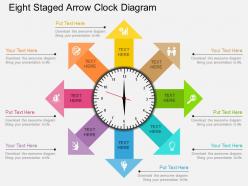 Kg eight staged arrow clock diagram flat powerpoint design
Presenting kg eight staged arrow clock diagram flat powerpoint design. Eight staged arrow clock diagram has been used to design this power point template diagram. This PPT diagram contains the concept of time management. Use this PPT diagram for business related presentations.
-
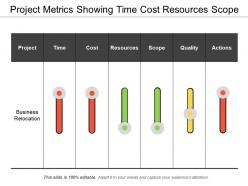 Project metrics showing time cost resources scope
Presenting this set of slides with name - Project Metrics Showing Time Cost Resources Scope. This is a six stage process. The stages in this process are Project Kpis, Project Dashboard, Project Metrics.
-
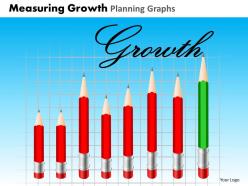 Measuring Growth Planning Graphs Powerpoint Slides And Ppt Templates Db
These high quality, editable pre-designed Measuring Growth Planning Graphs Powerpoint Slides And Ppt Templates DB powerpoint slides and powerpoint templates have been carefully created by our professional team to help you impress your audience. Each graphic in every powerpoint slide is vector based and is 100% editable in powerpoint. Each and every property of any slide - color, size, shading etc can be modified to build an effective powerpoint presentation. Use these slides to convey complex business concepts in a simplified manner. Any text can be entered at any point in the powerpoint slide. Simply DOWNLOAD, TYPE and PRESENT
-
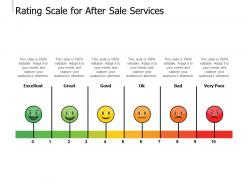 Rating scale for after sale services
Presenting this set of slides with name Rating Scale For After Sale Services. This is a six stage process. The stages in this process are Product Improvement, Rating Scale, Product Quality. This is a completely editable PowerPoint presentation and is available for immediate download. Download now and impress your audience.
-
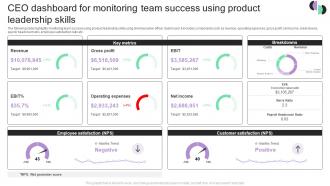 CEO Dashboard For Monitoring Team Success Using Product Leadership Skills
The following slide highlights monitoring team success using product leadership skills using chief executive officer dashboard. It includes components such as revenue, operating expenses, gross profit, net income, breakdowns, payroll headcount ratio, employee satisfaction ratio etc. Introducing our CEO Dashboard For Monitoring Team Success Using Product Leadership Skills set of slides. The topics discussed in these slides are Revenue, Gross Profit, Operating Expenses. This is an immediately available PowerPoint presentation that can be conveniently customized. Download it and convince your audience.
-
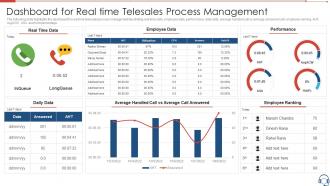 Dashboard Snapshot For Real Time Telesales Process Management
The following slide highlights the dashboard snapshot for real time telesales process management illustrating real time data, employee data, performance, daily data, average handled call vs average answered call, employee ranking, AHT, AvgACW, ASA and hold percentage Introducing our Dashboard For Real Time Telesales Process Management set of slides. The topics discussed in these slides are Dashboard For Real Time Telesales Process Management. This is an immediately available PowerPoint presentation that can be conveniently customized. Download it and convince your audience.
-
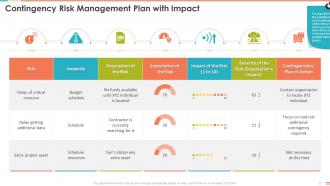 Contingency Risk Management Plan With Impact Project Management Bundle
Present the topic in a bit more detail with this Contingency Risk Management Plan With Impact Project Management Bundle. Use it as a tool for discussion and navigation on Critical Resource, Additional Data, Project Asset. This template is free to edit as deemed fit for your organization. Therefore download it now.


