Comparative Metrics For Continuous Monitoring In Devops Tools
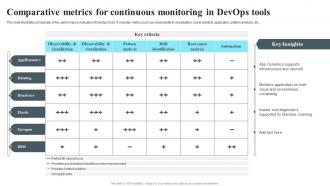
This slide illustrates comparison of key performance indicators of DevOps tools. It includes metrics such as observability and visualization, observability and application, pattern analysis, etc.
You must be logged in to download this presentation.
 Impress your
 audience
Editable
of Time
PowerPoint presentation slides
This slide illustrates comparison of key performance indicators of DevOps tools. It includes metrics such as observability and visualization, observability and application, pattern analysis, etc. Presenting our well structured Comparative Metrics For Continuous Monitoring In Devops Tools. The topics discussed in this slide are Appdynamics, Datadog, Dynatrace. This is an instantly available PowerPoint presentation that can be edited conveniently. Download it right away and captivate your audience.
People who downloaded this PowerPoint presentation also viewed the following :
Comparative Metrics For Continuous Monitoring In Devops Tools with all 6 slides:
Use our Comparative Metrics For Continuous Monitoring In Devops Tools to effectively help you save your valuable time. They are readymade to fit into any presentation structure.
-
Presentation Design is very nice, good work with the content as well.
-
Great combination of visuals and information. Glad I purchased your subscription.


