Net Profit And Margin Processed Food Company Profile Ppt Summary
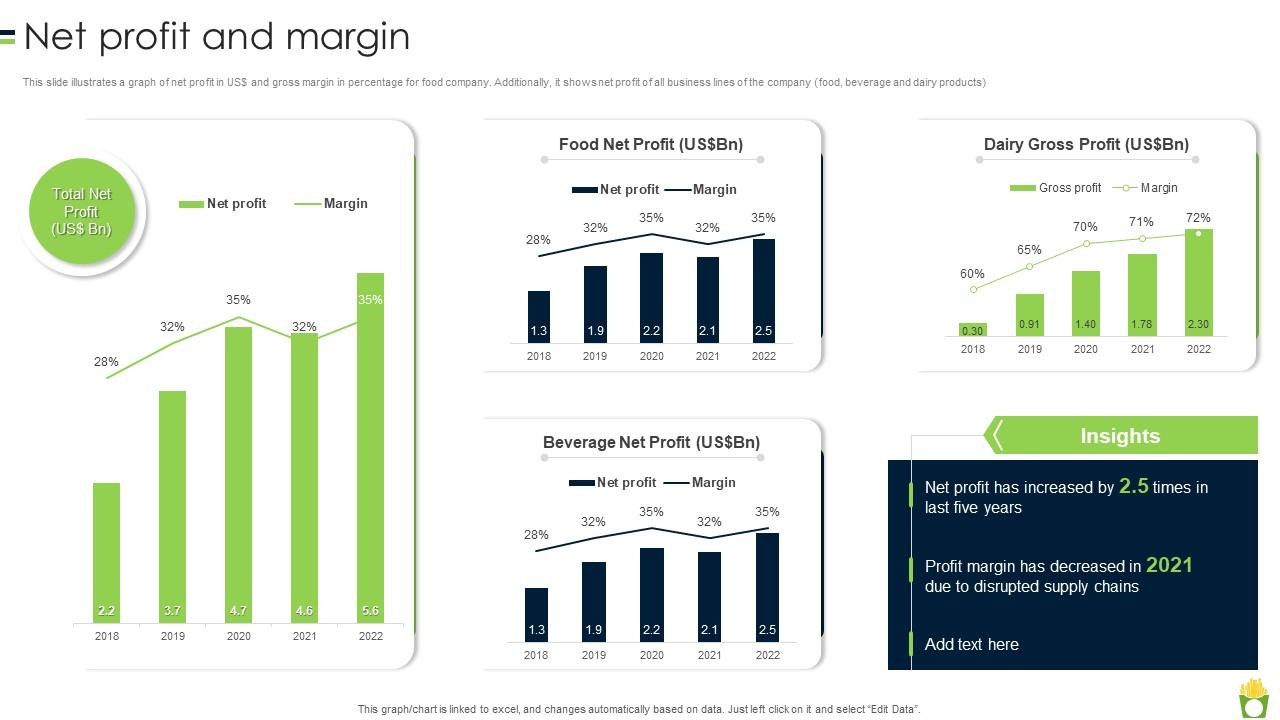
This slide illustrates a graph of net profit in US doller and gross margin in percentage for food company. Additionally, it shows net profit of all business lines of the company food, beverage and dairy products.
This slide illustrates a graph of net profit in US doller and gross margin in percentage for food company. Additionally, it..
- Google Slides is a new FREE Presentation software from Google.
- All our content is 100% compatible with Google Slides.
- Just download our designs, and upload them to Google Slides and they will work automatically.
- Amaze your audience with SlideTeam and Google Slides.
-
Want Changes to This PPT Slide? Check out our Presentation Design Services
- WideScreen Aspect ratio is becoming a very popular format. When you download this product, the downloaded ZIP will contain this product in both standard and widescreen format.
-

- Some older products that we have may only be in standard format, but they can easily be converted to widescreen.
- To do this, please open the SlideTeam product in Powerpoint, and go to
- Design ( On the top bar) -> Page Setup -> and select "On-screen Show (16:9)” in the drop down for "Slides Sized for".
- The slide or theme will change to widescreen, and all graphics will adjust automatically. You can similarly convert our content to any other desired screen aspect ratio.
Compatible With Google Slides

Get This In WideScreen
You must be logged in to download this presentation.
PowerPoint presentation slides
This slide illustrates a graph of net profit in US doller and gross margin in percentage for food company. Additionally, it shows net profit of all business lines of the company food, beverage and dairy products. Deliver an outstanding presentation on the topic using this Net Profit And Margin Processed Food Company Profile Ppt Summary. Dispense information and present a thorough explanation of Beverage Net Profit, Dairy Gross Profit, Profit And Margin using the slides given. This template can be altered and personalized to fit your needs. It is also available for immediate download. So grab it now.
People who downloaded this PowerPoint presentation also viewed the following :
Net Profit And Margin Processed Food Company Profile Ppt Summary with all 7 slides:
Use our Net Profit And Margin Processed Food Company Profile Ppt Summary to effectively help you save your valuable time. They are readymade to fit into any presentation structure.
-
Wide collection of templates available. SlideTeam has made it easier to create presentations in just a few minutes.
-
They guys always go the extra mile to meet the expectations of their customers. Almost a year has been associated with them.


