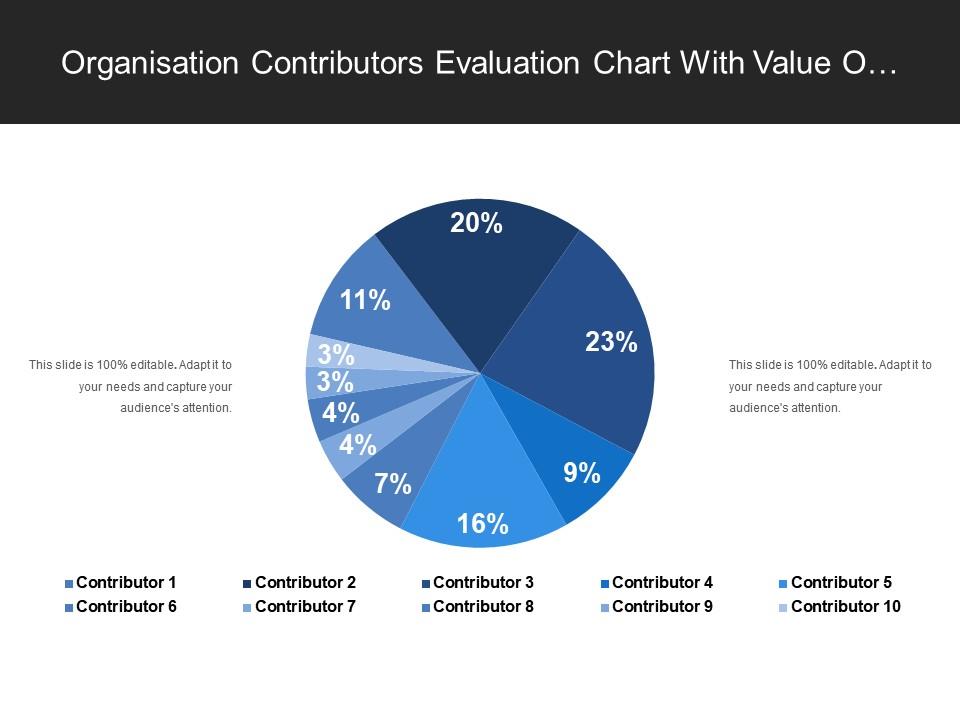
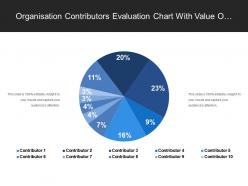
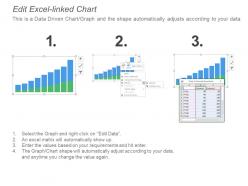
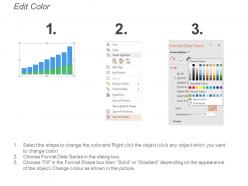
Organisation contributors evaluation chart with value of contribution in percent

Rating:
90%
Organisation contributors evaluation chart with value of contribution in percent
Slide 1 of 6
Favourites Favourites

Try Before you Buy Download Free Sample Product

Audience Impress Your
Audience
Editable 100%
Editable
Time Save Hours
of Time
The Biggest Sale is ending soon in
0
0
:
0
0
:
0
0
Rating:
90%
Presenting this set of slides with name - Organisation Contributors Evaluation Chart With Value Of Contribution In Percent. This is a ten stage process. The stages in this process are Contributor, Writer, Reporter.

People who downloaded this PowerPoint presentation also viewed the following :

FAQs for Organisation contributors evaluation chart with value of

A Contributor Evaluation Chart should include performance metrics, goal achievement rates, collaboration effectiveness, skill development progress, and innovation contributions. These comprehensive assessments enable organizations to streamline talent management by identifying high performers, addressing development gaps, and optimizing team dynamics, ultimately delivering enhanced productivity and strategic workforce planning across departments.

A Contributor Evaluation Chart enhances team collaboration by establishing clear performance metrics, identifying individual strengths and development areas, and creating transparent feedback mechanisms that align team members with shared objectives. Through systematic evaluation processes, organizations streamline communication, minimize role ambiguity, and enable targeted skill development, with many project-based teams finding that regular contributor assessments ultimately deliver improved accountability and measurably higher productivity outcomes.

Data reliability in Contributor Evaluation Charts depends on assessment consistency, objective measurement criteria, regular evaluation intervals, comprehensive performance indicators, and standardized scoring methodologies. These factors work together by minimizing subjective bias, ensuring accurate performance tracking, and maintaining evaluation transparency, with many organizations finding that systematic approaches ultimately deliver more credible contributor insights and strategic workforce decisions.

Visualization techniques enhance Contributor Evaluation Charts through interactive dashboards, color-coded performance indicators, trend graphs, heat maps, and comparative bar charts. These visual elements streamline data interpretation by highlighting top performers, identifying skill gaps, and tracking progress over time, with many organizations finding that visual analytics accelerate decision-making and improve team management outcomes.

A Contributor Evaluation Chart supports performance reviews by providing structured frameworks for assessing individual contributions, tracking goal achievement, measuring competency development, and identifying growth opportunities. Through standardized evaluation criteria, managers can deliver consistent, objective feedback while employees gain clear visibility into performance expectations and career advancement pathways, ultimately streamlining review processes and enhancing professional development conversations.

Best practices for designing Contributor Evaluation Charts include clear visual hierarchy, consistent color coding, balanced data representation, intuitive layout structure, and mobile-responsive formatting. These design elements enhance decision-making by streamlining performance assessments, improving stakeholder communication, and enabling quick identification of top contributors, with many HR departments finding that well-designed charts ultimately deliver faster evaluations and better talent management outcomes.

Organizations customize Contributor Evaluation Charts by adjusting performance metrics, weighting criteria, and evaluation timeframes to align with industry-specific requirements, regulatory standards, and operational priorities. For example, healthcare organizations emphasize patient safety metrics and compliance adherence, while tech companies focus on innovation outputs and project delivery speed, ultimately enabling more accurate performance assessments and strategic talent development.

**INPUT**: What tools or software are most effective for creating and maintaining Contributor Evaluation Charts? **OUTPUT**: Effective tools for Contributor Evaluation Charts include Microsoft Excel, Google Sheets, Tableau, Power BI, and specialized HR platforms like BambooHR and Workday. These solutions streamline data collection, automate scoring calculations, and enable real-time tracking, with many organizations finding that integrated dashboards enhance transparency, reduce administrative overhead, and ultimately deliver more consistent, objective contributor assessments.

Contributor Evaluation Charts should be updated quarterly to maintain relevance, with additional updates triggered by significant role changes, project completions, or organizational restructuring. This frequency enables organizations to capture evolving contributions, seasonal performance variations, and skill development accurately, while many companies find that quarterly reviews provide sufficient data points for meaningful trend analysis, ultimately delivering more strategic talent decisions and enhanced contributor engagement.

Qualitative feedback provides essential context and depth that quantitative metrics alone cannot capture, offering insights into collaboration skills, communication effectiveness, problem-solving approaches, and cultural alignment within teams. While quantitative data measures performance outputs like productivity and accuracy, qualitative assessments from peers, managers, and stakeholders reveal how contributors achieve results, ultimately delivering a comprehensive evaluation framework that enhances decision-making and professional development.

A Contributor Evaluation Chart helps identify skill gaps by systematically mapping individual competencies against required role responsibilities, project requirements, and team objectives. Through visual assessment matrices, managers can pinpoint specific technical deficiencies, communication weaknesses, and leadership development opportunities across their workforce, ultimately enabling targeted training investments and strategic resource allocation for enhanced team performance.

Potential biases include recency bias (overweighting recent performance), halo effect (letting one strength overshadow weaknesses), confirmation bias (favoring information supporting preconceptions), and availability bias (relying on easily recalled examples). These biases can skew evaluation accuracy across teams, with many organizations finding that structured rubrics, multiple evaluators, and regular calibration sessions help minimize subjective influences, ultimately delivering fairer assessments and better talent decisions.

Implementing a Contributor Evaluation Chart enhances employee morale by providing transparent performance visibility, clear recognition pathways, and structured feedback mechanisms that validate individual contributions. These visual tools streamline communication between managers and staff, eliminate ambiguity around expectations, and enable targeted development planning, with many organizations finding that employees demonstrate increased engagement and motivation when their efforts are systematically acknowledged and measured.

Healthcare, technology, consulting, and financial services organizations see significant benefits from Contributor Evaluation Charts because they manage diverse talent pools requiring objective performance assessment across multiple criteria. These industries leverage structured evaluation frameworks to streamline promotion decisions, enhance team transparency, and optimize resource allocation, with many finding that standardized contributor metrics ultimately deliver improved retention rates and competitive talent positioning.

Organizations utilize Contributor Evaluation Chart insights for strategic planning by identifying high-performing contributors, allocating resources effectively, and aligning team capabilities with business objectives. These assessments enable companies to optimize workforce deployment, enhance project outcomes, and develop targeted training programs, with many organizations finding that strategic contributor analysis ultimately delivers improved operational efficiency and competitive advantage in talent management.

Ratings and Reviews

90% of 100
Review Form
Write a review
Most Relevant Reviews
  1. 100%

    by Dwain Johnston

    Use of different colors is good. It's simple and attractive.
  2. 80%

    by Darnell Tucker

    Great product with effective design. Helped a lot in our corporate presentations. Easy to edit and stunning visuals.

2 Item(s)

per page: