Financials PowerPoint Templates, Financial Statement PPT Templates
- Sub Categories
-
- 30 60 90 Day Plan
- About Us Company Details
- Action Plan
- Agenda
- Annual Report
- Audit Reports
- Balance Scorecard
- Brand Equity
- Business Case Study
- Business Communication Skills
- Business Plan Development
- Business Problem Solving
- Business Review
- Capital Budgeting
- Career Planning
- Change Management
- Color Palettes
- Communication Process
- Company Location
- Company Vision
- Compare
- Competitive Analysis
- Corporate Governance
- Cost Reduction Strategies
- Custom Business Slides
- Customer Service
- Dashboard
- Data Management
- Decision Making
- Digital Marketing Strategy
- Digital Transformation
- Disaster Management
- Diversity
- Equity Investment
- Financial Analysis
- Financial Services
- Financials
- Growth Hacking Strategy
- Human Resource Management
- Innovation Management
- Interview Process
- Knowledge Management
- Leadership
- Lean Manufacturing
- Legal Law Order
- Management
- Market Segmentation
- Marketing
- Media and Communication
- Meeting Planner
- Mergers and Acquisitions
- Metaverse
- Newspapers
- Operations and Logistics
- Organizational Structure
- Our Goals
- Performance Management
- Pitch Decks
- Pricing Strategies
- Process Management
- Product Development
- Product Launch Ideas
- Product Portfolio
- Project Management
- Purchasing Process
- Quality Assurance
- Quotes and Testimonials
- Real Estate
- Risk Management
- Sales Performance Plan
- Sales Review
- SEO
- Service Offering
- Six Sigma
- Social Media and Network
- Software Development
- Solution Architecture
- Stock Portfolio
- Strategic Management
- Strategic Planning
- Supply Chain Management
- Swimlanes
- System Architecture
- Team Introduction
- Testing and Validation
- Thanks-FAQ
- Time Management
- Timelines Roadmaps
- Value Chain Analysis
- Value Stream Mapping
- Workplace Ethic
-
 Revenue Forecasting Powerpoint Presentation Slides
Presenting this set of slides with name - Revenue Forecasting Powerpoint Presentation Slides. This complete deck is oriented to make sure you do not lag in your presentations. Our creatively crafted slides come with apt research and planning. This exclusive deck with nineteen slides is here to help you to strategize, plan, analyze, or segment the topic with clear understanding and apprehension. Utilize ready to use presentation slides on Revenue Forecasting Powerpoint Presentation Slides with all sorts of editable templates, charts, and graphs. You can make changes to colors, data, and fonts if you need to. Download PowerPoint templates in both widescreen and standard screen. The presentation is fully supported by Google Slides. It can be easily converted into JPG or PDF format.
-
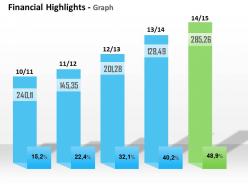 0414 annual growth of financial result
100% customizable Presentation designs, text, font, colors and layout, shading etc. Unaffected High resolution PPT slides , Compatible with the graphic software’s and Google slides, Convertible into various file formats like JPG or PDF, Easy to replace dummy PPT images data and can insert company name or logo also, smooth downloading process, Extensive approach of inscribing the significant topic which is quite beneficial for financial analysts, finance professionals from different sectors.
-
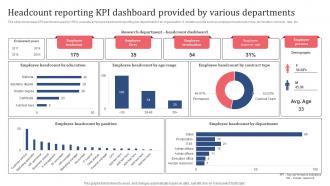 Headcount Reporting KPI Dashboard Provided By Various Departments
The slide showcases KPI dashboard used by HR to evaluate employee headcount reporting per department in an organization. It contains points such as employee headcount, hires, termination, turnover, rate, etc. Introducing our Headcount Reporting KPI Dashboard Provided By Various Departments set of slides. The topics discussed in these slides are Employee Headcount, Employee Termination, Employee Persona. This is an immediately available PowerPoint presentation that can be conveniently customized. Download it and convince your audience.
-
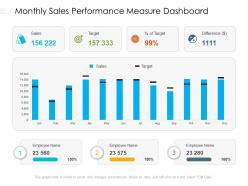 Monthly sales performance measure dashboard
Presenting this set of slides with name Monthly Sales Performance Measure Dashboard. The topics discussed in these slides are Sales, Target, Difference. This is a completely editable PowerPoint presentation and is available for immediate download. Download now and impress your audience.
-
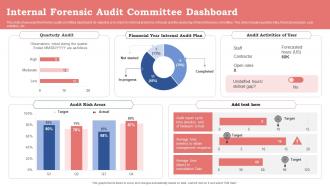 Internal Forensic Audit Committee Dashboard
This slide showcases the forensic audit committee dashboard. Its objective is to check for internal problems or frauds and the analysing of inernal forensic committee. This slide includes quarterly idea, financial year plan, user activities, etc. Introducing our Internal Forensic Audit Committee Dashboard set of slides. The topics discussed in these slides are Internal Forensic Audit, Committee Dashboard, Inernal Forensic Committee. This is an immediately available PowerPoint presentation that can be conveniently customized. Download it and convince your audience.
-
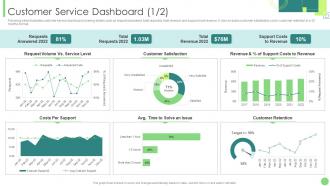 Customer Service Dashboard Snapshot Kpis To Assess Business Performance
Following slide illustrates customer service dashboard covering details such as request answered, total requests, total revenue and support cost revenue. It also includes customer satisfaction score, customer retention in a 12 months format. Deliver an outstanding presentation on the topic using this Customer Service Dashboard Snapshot Kpis To Assess Business Performance. Dispense information and present a thorough explanation of Customer, Service, Dashboard using the slides given. This template can be altered and personalized to fit your needs. It is also available for immediate download. So grab it now.
-
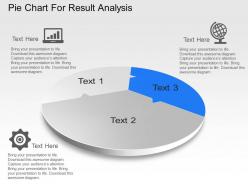 Pie chart for result analysis powerpoint template slide
Presentation slide runs jitter free on all software. Slides can be downloaded easily. More customization by inserting your company’s logo, trademark. No space constraints. PPT graphics never pixelate once projected on widescreen. Add/insert title and sub-title at your discretion. Slides compatible with Google slides. Convert to JPG/PDF formats rapidly. Useful for businesses, educational institutes, project management, financial organizations and NGO’s.
-
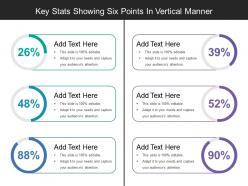 Key stats showing six points in vertical manner
Presenting this set of slides with name - Key Stats Showing Six Points In Vertical Manner. This is a six stage process. The stages in this process are Stats, Statistics, Data.
-
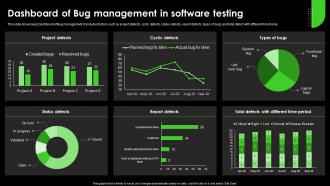 Dashboard Of Bug Management In Software Testing
This slide showcases Dashboard of Bug management. It includes factors such as project defects, cyclic defects, status defects, report defects, types of bugs and total defect with different time frame. Presenting our well structured Dashboard Of Bug Management In Software Testing The topics discussed in this slide are Project Defects, Cyclic Defects, Report Defects This is an instantly available PowerPoint presentation that can be edited conveniently. Download it right away and captivate your audience.
-
 Four quadrant with four different colors
Presenting this set of slides with name - Four Quadrant With Four Different Colors. This is a four stage process. The stages in this process are Four Quadrants, Four Axes, Plane Geometry.
-
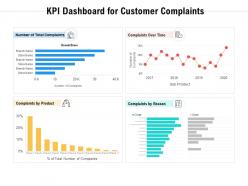 Kpi dashboard for customer complaints
Presenting this set of slides with name KPI Dashboard For Customer Complaints. The topics discussed in these slides are KPI Dashboard, For Customer Complaints. This is a completely editable PowerPoint presentation and is available for immediate download. Download now and impress your audience.
-
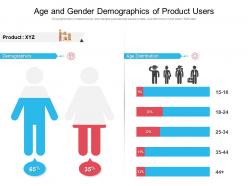 Age and gender demographics of product users
Presenting this set of slides with name Age And Gender Demographics Of Product Users. The topics discussed in these slide is Age And Gender Demographics Of Product Users. This is a completely editable PowerPoint presentation and is available for immediate download. Download now and impress your audience.
-
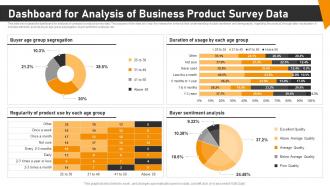 Dashboard For Analysis Of Business Product Survey Data
This slide showcases the dashboard for analysis of companys product survey data. The purpose of this slide is to help the researcher enhance their understanding of public sentiment and demography, regarding the product, through data visualization. It includes elements such as buyer age group segregation, buyer sentiment analysis, etc. Introducing our Dashboard For Analysis Of Business Product Survey Data set of slides. The topics discussed in these slides are Group Segregation, Regularity Product, Buyer Sentiment Analysis. This is an immediately available PowerPoint presentation that can be conveniently customized. Download it and convince your audience.
-
 Hospitality Management KPI And Dashboard Powerpoint Presentation Slides
This complete deck focuses on Hospitality Management KPI And Dashboard Powerpoint Presentation Slides and consists of professionally designed templates with suitable graphics and appropriate content. Our designers have created customizable templates for your convenience. You can make the required changes in the templates like color, text and font size. Other than this, content can be added or deleted from the slide as per the requirement. The templates are compatible with Google Slides so it can be easily accessible. It can be saved into various file formats like PDF, JPG. And PNG. It is available in both standard and widescreen formats.
-
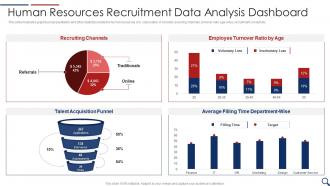 Human Resources Recruitment Data Analysis Dashboard Snapshot
This slide illustrates graphical representation and other statistics related to human resources of a corporation. It includes sourcing channels, turnover ratio age wise, recruitment conduit etc. Introducing our Human Resources Recruitment Data Analysis Dashboard Snapshot set of slides. The topics discussed in these slides are Resources, Recruitment, Analysis, Dashboard. This is an immediately available PowerPoint presentation that can be conveniently customized. Download it and convince your audience.
-
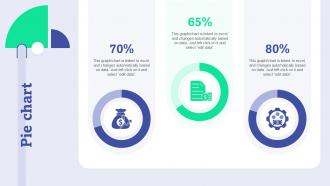 Pie Chart Enhance Brand Equity By Administering Product Corporate And Umbrella Branding
Present the topic in a bit more detail with this Pie Chart Enhance Brand Equity By Administering Product Corporate And Umbrella Branding. Use it as a tool for discussion and navigation on Pie Chart. This template is free to edit as deemed fit for your organization. Therefore download it now
-
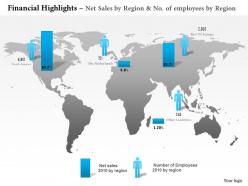 0314 global financial report design
Transform the presentation with business information i.e. sign and design. Pre-designed PPT slide assist you in saving both your time and effort. Choice to add or remove content in the design. Text and font can be easily altered as the PowerPoint template is absolutely editable. Presentation layout exhibit in both standard and widescreen slide. Adaptable as can be adapted in JPEG or PDF documents. Perfect for finance analyst, global financial planning experts, accounts management team etc.
-
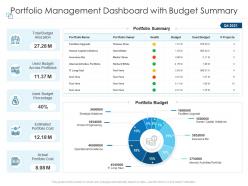 Portfolio management dashboard with budget summary
Introducing our Portfolio Management Dashboard With Budget Summary set of slides. The topics discussed in these slides are Budget Allocation, Portfolio, Portfolio Cost. This is an immediately available PowerPoint presentation that can be conveniently customized. Download it and convince your audience.
-
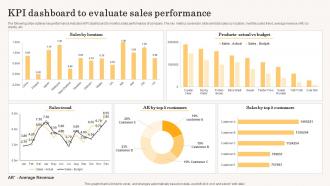 KPI Dashboard To Evaluate Sales Performance Accelerating Business Growth Top Strategy SS V
The following slide outlines key performance indicator KPI dashboard to monitor sales performance of company. The key metrics covered in slide are total sales by location, monthly sales trend, average revenue AR by clients, etc. Present the topic in a bit more detail with this KPI Dashboard To Evaluate Sales Performance Accelerating Business Growth Top Strategy SS V. Use it as a tool for discussion and navigation on Sales Trend, Sales By Location, Actual Vs Budget. This template is free to edit as deemed fit for your organization. Therefore download it now.
-
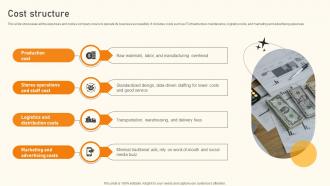 Cost Structure Clothing Store Business Model BMC SS V
This slide showcases all the expenses and costs a company incurs to operate its business successfully. It includes costs such as IT infrastructure maintenance, logistics costs, and marketing and advertising expenses. Increase audience engagement and knowledge by dispensing information using Cost Structure Clothing Store Business Model BMC SS V. This template helps you present information on four stages. You can also present information on Production Cost, Stores Operations And Staff Cost, Logistics And Distribution Costs using this PPT design. This layout is completely editable so personaize it now to meet your audiences expectations.
-
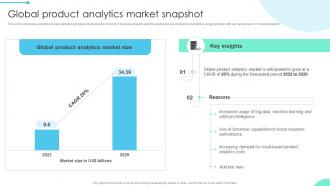 Global Product Enhancing Business Insights Implementing Product Data Analytics SS V
This slide showcase a graphical representation global product analytics market. It includes present and forecasted values of advanced analytics usage globally with key takeaways on market situation. Present the topic in a bit more detail with this Global Product Enhancing Business Insights Implementing Product Data Analytics SS V. Use it as a tool for discussion and navigation on Key Insights, Global Product Analytics, Reasons. This template is free to edit as deemed fit for your organization. Therefore download it now.
-
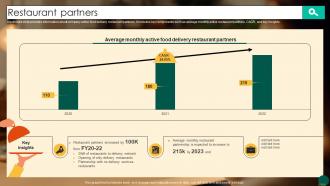 Restaurant Partners Food Ordering Website Company Profile CP SS V
Mentioned slide provides information about company active food delivery restaurant partners. It includes key components such as average monthly active restaurant partners, CAGR, and key insights. Present the topic in a bit more detail with this Restaurant Partners Food Ordering Website Company Profile CP SS V Use it as a tool for discussion and navigation on Restaurant Partners This template is free to edit as deemed fit for your organization. Therefore download it now.
-
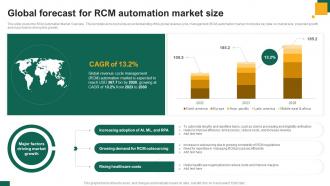 Global Forecast For RCM Automation Market Size
This slide covers the RCM Automation Market Overview. This template aims to provide an understanding of the global revenue cycle management RCM automation market. It includes key data on market size, projected growth and major factors driving this growth. Introducing our Global Forecast For RCM Automation Market Size set of slides. The topics discussed in these slides are Increasing Adoption, Growing Demand, Rising Healthcare Costs. This is an immediately available PowerPoint presentation that can be conveniently customized. Download it and convince your audience.
-
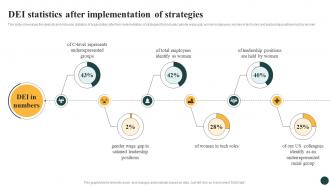 DEI Statistics Implementing Strategies To Enhance And Promote Workplace DTE SS
This slide showcases the diversity and inclusion statistics of organization after the implementation of strategies that includes gender wage gap, women employees, women in tech roles and leadership positions held by women. Deliver an outstanding presentation on the topic using this DEI Statistics Implementing Strategies To Enhance And Promote Workplace DTE SS. Dispense information and present a thorough explanation of Tech Roles, Racial Group, Leadership Positions using the slides given. This template can be altered and personalized to fit your needs. It is also available for immediate download. So grab it now.
-
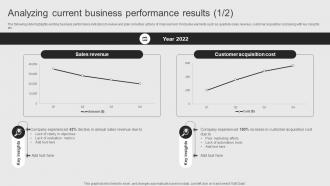 Analyzing Current Business Objectives Of Corporate Performance Management To Attain
The following slide highlights existing business performance indicators to review and plan corrective actions of improvement. It includes elements such as quarterly sales revenue, customer acquisition cost along with key insights etc. Deliver an outstanding presentation on the topic using this Analyzing Current Business Objectives Of Corporate Performance Management To Attain. Dispense information and present a thorough explanation of Sales Revenue, Customer Acquisition Cost, Evaluation Metrics using the slides given. This template can be altered and personalized to fit your needs. It is also available for immediate download. So grab it now.
-
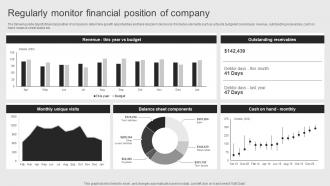 Regularly Monitor Financial Objectives Of Corporate Performance Management To Attain
The following slide depicts financial position of company to determine growth opportunities and take long term decisions. It includes elements such as actual and budgeted current year revenue, outstanding receivables, cash on hand, balance sheet status etc. Present the topic in a bit more detail with this Regularly Monitor Financial Objectives Of Corporate Performance Management To Attain. Use it as a tool for discussion and navigation on Unique Visits, Balance Sheet, Outstanding Receivables. This template is free to edit as deemed fit for your organization. Therefore download it now.
-
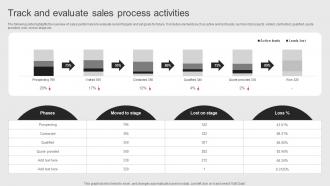 Track And Evaluate Sales Process Objectives Of Corporate Performance Management To Attain
The following slide highlights the overview of sales performance to evaluate current targets and set goals for future. It includes elements such as active and lost leads, number of prospects, visited, contracted, qualified, quote provided, won, lost on stage etc. Deliver an outstanding presentation on the topic using this Track And Evaluate Sales Process Objectives Of Corporate Performance Management To Attain. Dispense information and present a thorough explanation of Track And Evaluate, Sales Process Activities, Phases using the slides given. This template can be altered and personalized to fit your needs. It is also available for immediate download. So grab it now.
-
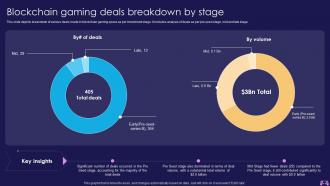 Blockchain Gaming Deals Breakdown By Stage Introduction To Blockchain Enabled Gaming BCT SS
This slide depicts breakdown of various deals made in blockchain gaming space as per investment stage. It includes analysis of deals as per pre seed stage, mid and late stage. Deliver an outstanding presentation on the topic using this Blockchain Gaming Deals Breakdown By Stage Introduction To Blockchain Enabled Gaming BCT SS. Dispense information and present a thorough explanation of Blockchain Gaming Deals, Breakdown By Stage using the slides given. This template can be altered and personalized to fit your needs. It is also available for immediate download. So grab it now.
-
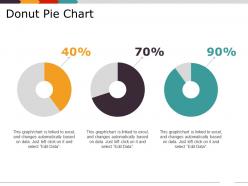 Donut pie chart presentation design
Presenting Donut Pie Chart Presentation Design PowerPoint slide. Easy to download PPT layout and can be saved in different formats like JPG, PDF and PNG. This PowerPoint slide is completely editable so you can modify, font type, font color, shape and image according to your requirements. This Google Slides compatible PPT is available in 4:3 and 16:9 aspect ratios.
-
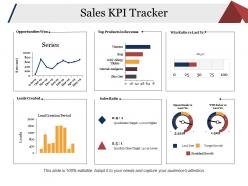 Sales kpi tracker presentation examples
Presenting this set of slides with name - Sales Kpi Tracker Presentation Examples. This is a six stage process. The stages in this process are Opportunities Won, Top Products In Revenue, Win Ratio Vs Last, Leads Created, Sales Ratio.
-
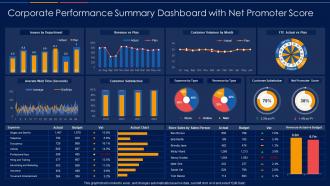 Corporate Performance Summary Dashboard Snapshot With Net Promoter Score
This graph or chart is linked to excel, and changes automatically based on data. Just left click on it and select Edit Data. Presenting our well structured Corporate Performance Summary Dashboard Snapshot With Net Promoter Score. The topics discussed in this slide are Issues By Department, Revenue Vs Plan, Customer Volumes By Month, FTE Actual Vs Plan, Customer Satisfaction, Customer Satisfaction. This is an instantly available PowerPoint presentation that can be edited conveniently. Download it right away and captivate your audience.
-
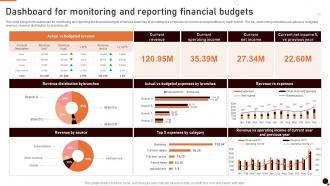 Dashboard For Monitoring And Reporting Financial Budgets
This slide brings forth dashboard for monitoring and reporting the financial budgets of various branches of an enterprise emphasis on income and expenditure by each branch. The key performing indicators are actual vs budgeted revenue, revenue distribution by branches etc. Introducing our Dashboard For Monitoring And Reporting Financial Budgets set of slides. The topics discussed in these slides are Current Revenue, Current Operating Income This is an immediately available PowerPoint presentation that can be conveniently customized. Download it and convince your audience.
-
 Capital Budget Plan Powerpoint Presentation Slides
Presenting Capital Budget Plan PowerPoint Presentation Slides. This PowerPoint presentation includes a set of 22 content ready slides. The deck is 100 percent editable in PowerPoint so that you can enter your text in the placeholders. PPT slides can be downloaded in both widescreen and standard screen. The templates are fully supported with Google Slides. It can be easily converted into JPG or PDF format.
-
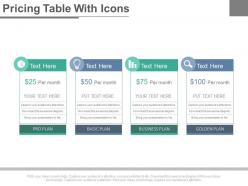 Four staged pricing table with icons powerpoint slides
The visuals bear a high-class image display with no error of pixilation. The option of unlimited customization stays with you to experiment with the colour scheme, orientation features, and size adjustment. Save the said template in various file formats with an easy download option. The templates are fully congruent to Google slides. Explore the feasible options to recast the slides with a complete guide that follows the Ppt.
-
 Reasonable Investigation Powerpoint Presentation Slides
Presenting reasonable investigation PowerPoint presentation slides. It consists of total of 76 PPT templates. This complete deck covers all the aspects of the topic. Our PowerPoint professionals have added all the necessary diagrams, layouts, templates in the presentation. This complete presentation deck also includes professional charts and graphs for the data visualization. All these slides are completely customizable. You can edit the colour, text and icon as per your need. They are high resolution PPT templates. Perfectly compatible with Google slides. Click the download below to get access to this content ready complete presentation on reasonable investigation to evaluate the company you are investing in.
-
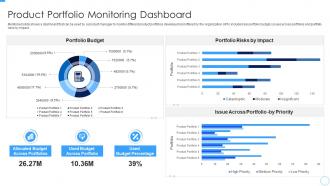 Product Portfolio Monitoring Dashboard Developing Managing Product Portfolio
Mentioned slide shows a dashboard that can be used by a product manager to monitor different product portfolios developed and offered by the organization. KPIs included are portfolio budget, issues across portfolios and portfolio risks by impact. Present the topic in a bit more detail with this Product Portfolio Monitoring Dashboard Developing Managing Product Portfolio. Use it as a tool for discussion and navigation on Product Portfolio Monitoring Dashboard. This template is free to edit as deemed fit for your organization. Therefore download it now.
-
 Detailed Investment Analysis Powerpoint Presentation Slides
Presenting this set of slides with name - Detailed Investment Analysis Powerpoint Presentation Slides. This PPT deck displays seventy-one slides with in-depth research. Our topic oriented Detailed Investment Analysis Powerpoint Presentation Slides presentation deck is a helpful tool to plan, prepare, document and analyse the topic with a clear approach. It showcases of all kind of editable templates. You can make changes to colors, data, and fonts if you need to. Download PowerPoint templates in both widescreen and standard screen. The presentation is fully supported by Google Slides. It can be easily converted into JPG or PDF format.
-
 Financial management kpi metrics dollars ppt powerpoint presentation styles
Presenting this set of slides with name Financial Management KPI Metrics Dollars Ppt Powerpoint Presentation Styles. This is a three stage process. The stages in this process are Financial Management, Gross Profit, Operating Profit, Net Profit, Donut. This is a completely editable PowerPoint presentation and is available for immediate download. Download now and impress your audience.
-
 Investment And Security Analysis Portfolio Management Powerpoint Presentation Slides
These templates can be easily downloaded. This graphic consists of more than 50 slides. These designs are fully editable. Compatible presentation layout. Our visuals can be easily converted to PDF and JPG formats. High-resolution template designs. Standardized position, color, and style. Our templates are 100% risk-free. Our slides can be used by investors, portfolio manager, security analyst, marketers, sales, finance analyst and many more.The stages in this process are equity capital, equity ownership co ownership etc.
-
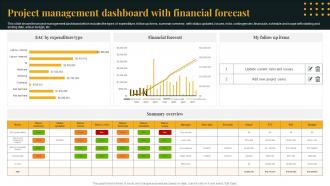 Project Management Dashboard With Financial Forecast
This slide shows the project management dashboard which includes the types of expenditure, follow up items, summary overview, with status updated, issues, risks, contingencies, financials, schedule and scope with starting and ending date, actual budget, etc. Presenting our well structured Project Management Dashboard With Financial Forecast. The topics discussed in this slide are Project Management, Dashboard With Financial Forecast. This is an instantly available PowerPoint presentation that can be edited conveniently. Download it right away and captivate your audience.
-
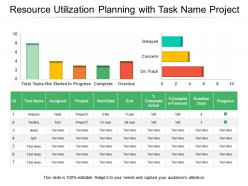 Resource utilization planning with task name project
Presenting this set of slides with name - Resource Utilization Planning With Task Name Project. This is a three stage process. The stages in this process are Resource Management, Resource Utilization, Resource Allocation.
-
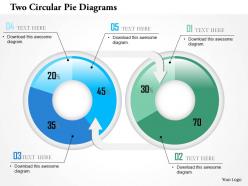 Two circular pie diagrams powerpoint template
We are proud to present our two circular pie diagrams powerpoint template. Graphic of two circular pie diagrams has been used to design this power point template diagram. This PPT diagram contains the concept of result analysis. Use this PPT diagram for business and finance related presentations.
-
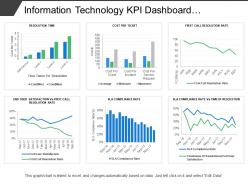 Information technology kpi dashboard showing cost per ticket sla compliance rate
Presenting this set of slides with name - Information Technology Kpi Dashboard Showing Cost Per Ticket Sla Compliance Rate. This is a six stage process. The stages in this process are Information Technology, It, Iot.
-
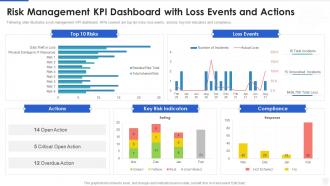 Cybersecurity and digital business risk management risk management kpi dashboard
Following slide illustrates a risk management KPI dashboard. KPIs covered are top ten risks, loss events, actions, key risk indicators and compliance. Deliver an outstanding presentation on the topic using this Cybersecurity And Digital Business Risk Management Risk Management Kpi Dashboard. Dispense information and present a thorough explanation of Risk Management KPI Dashboard With Loss Events And Actions using the slides given. This template can be altered and personalized to fit your needs. It is also available for immediate download. So grab it now.
-
 Talent Sourcing And Recruitment Metrics Dashboard
This slide illustrates graphical representation and other statistics related to talent acquisition. It includes sourcing channels, turnover ratio age-wise, recruitment conduit etc. Presenting our well-structured Talent Sourcing And Recruitment Metrics Dashboard. The topics discussed in this slide are Recruitment, Metrics, Dashboard, Sourcing. This is an instantly available PowerPoint presentation that can be edited conveniently. Download it right away and captivate your audience.
-
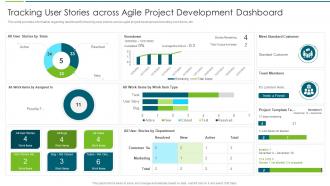 Agile Transformation Approach Playbook Stories Across Agile Project Development Dashboard
This slide provides information regarding dashboard for tracking user stories across agile project development including work items, etc. Present the topic in a bit more detail with this Agile Transformation Approach Playbook Stories Across Agile Project Development Dashboard. Use it as a tool for discussion and navigation on Agile Project, Development, Dashboard . This template is free to edit as deemed fit for your organization. Therefore download it now.
-
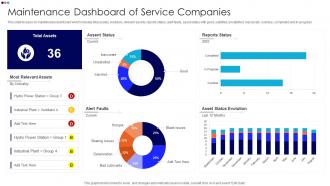 Maintenance Dashboard Snapshot Of Service Companies
This slide focuses on maintenance dashboard which includes total assets, evolution, relevant assets, reports status, alert faults, asset status with good, satisfied, unsatisfied, inaccurate , overdue, completed and in progress. Presenting our well structured Maintenance Dashboard Snapshot Of Service Companies. The topics discussed in this slide are Maintenance Dashboard Of Service Companies. This is an instantly available PowerPoint presentation that can be edited conveniently. Download it right away and captivate your audience.
-
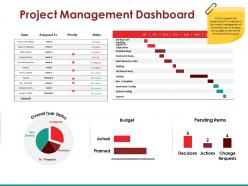 Project management dashboard powerpoint slide ideas
Presenting this set of slides with name - Project Management Dashboard Powerpoint Slide Ideas. This is a four stage process. The stages in this process are Overall Task Status, Budget, Pending Items, Decisions.
-
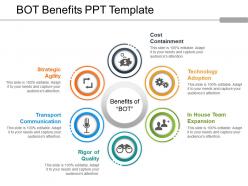 Bot benefits ppt template
Presenting Bot Benefits PPT Template. The slide supports both widescreen and standard screen sizes. Moreover, the template is also compatible with Google Slides. You can convert this template into various image or document formats such as JPEG, PNG or PDF with just the click of a button. High-quality graphics will ensure that quality is retained even when their size is increased.
-
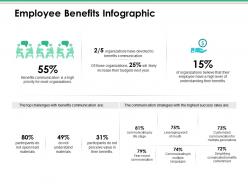 Employee benefits infographic ppt infographic template professional
Presenting this set of slides with name - Employee Benefits Infographic Ppt Infographic Template Professional. This is a two stage process. The stages in this process are Business, Management, Strategy, Analysis, Communication.
-
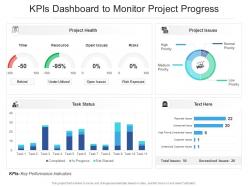 Kpis dashboard snapshot to monitor project progress
Introducing our KPIs Dashboard Snapshot To Monitor Project Progress set of slides. The topics discussed in these slides are KPIs Dashboard To Monitor Project Progress. This is an immediately available PowerPoint presentation that can be conveniently customized. Download it and convince your audience.
-
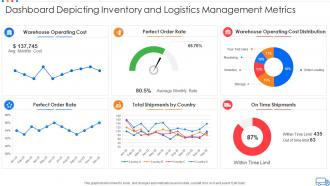 Dashboard depicting inventory and logistics management metrics
Introducing our Dashboard Depicting Inventory And Logistics Management Metrics set of slides. The topics discussed in these slides are Dashboard Depicting Inventory And Logistics Management Metrics. This is an immediately available PowerPoint presentation that can be conveniently customized. Download it and convince your audience.
-
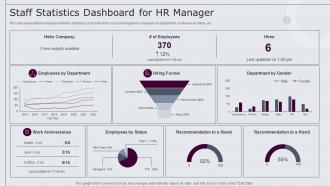 Staff Statistics Dashboard For Hr Manager
This slide represents the employee statistics dashboard. It includes KPIs such as hiring funnel, employees by department, employees by status, etc. Presenting our well structured Staff Statistics Dashboard For Hr Manager. The topics discussed in this slide are Statistics, Dashboard, Department. This is an instantly available PowerPoint presentation that can be edited conveniently. Download it right away and captivate your audience.
-
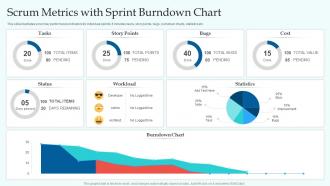 Scrum Metrics With Sprint Burndown Chart
This slide illustrates scrum key performance indicators for individual sprints. It includes tasks, story points, bugs, burndown charts, statistics etc. Presenting our well structured Scrum Metrics With Sprint Burndown Chart. The topics discussed in this slide are Story Points, Statistics, Workload, Burndown Chart. This is an instantly available PowerPoint presentation that can be edited conveniently. Download it right away and captivate your audience.
-
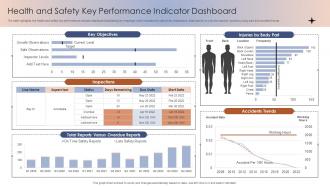 Health And Safety Key Performance Indicator Dashboard
The slide highlights the health and safety key performance indicator dashboard illustrating key headings which includes key objectives, inspections, total reports vs over due reports, injuries by body part and accident trends Introducing our Health And Safety Key Performance Indicator Dashboard set of slides. The topics discussed in these slides are Key Objectives, Inspections, Overdue Reports, Accidents Trends. This is an immediately available PowerPoint presentation that can be conveniently customized. Download it and convince your audience.
-
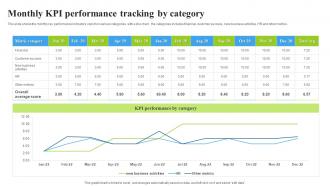 Monthly KPI Performance Tracking By Category
This slide shows the monthly key performance indicators report on various categories with a line chart. the categories includes financial, customer success, new business activities, HR and other metrics. Presenting our well structured Monthly KPI Performance Tracking By Category. The topics discussed in this slide are Performance Category, Tracking Category, Average Score. This is an instantly available PowerPoint presentation that can be edited conveniently. Download it right away and captivate your audience.
-
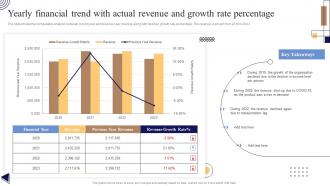 Yearly Financial Trend With Actual Revenue And Growth Rate Percentage
The slide shows the comparative analysis between current year and previous year revenue along with revenue growth rate percentage. The revenue is shown from 2019 to 2023. Introducing our Yearly Financial Trend With Actual Revenue And Growth Rate Percentage set of slides. The topics discussed in these slides are Yearly Financial Trend, Actual Revenue, Growth Rate Percentage. This is an immediately available PowerPoint presentation that can be conveniently customized. Download it and convince your audience.
-
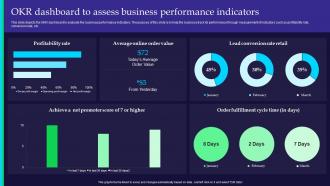 OKR Dashboard To Assess Business Performance Indicators
This slide depicts the OKR dashboard to evaluate the business performance indicators. The purpose of this slide is to help the business track its performance through measurement of indicators such as profitability rate, conversion rate, etc. Introducing our OKR Dashboard To Assess Business Performance Indicators set of slides. The topics discussed in these slides are Profitability Rate, Average Online, Conversion Rate Retail This is an immediately available PowerPoint presentation that can be conveniently customized. Download it and convince your audience.
-
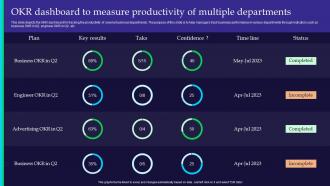 OKR Dashboard To Measure Productivity Of Multiple Departments
This slide depicts the OKR dashboard for tracking the productivity of several business departments. The purpose of this slide is to help managers track business performance in various departments through indicators such as business OKR in Q2, engineer OKR in Q2, etc. Introducing our OKR Dashboard To Measure Productivity Of Multiple Departments set of slides. The topics discussed in these slides are Business, Engineer, Advertising This is an immediately available PowerPoint presentation that can be conveniently customized. Download it and convince your audience.
-
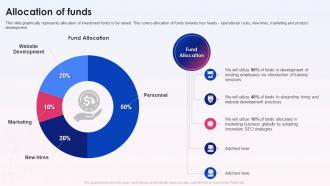 Allocation Of Funds RapidAPI Marketplace Investor Funding Elevator Pitch Deck
This slide graphically represents allocation of investment funds to be raised. This covers allocation of funds towards four heads operational costs, new hires, marketing and product development. Present the topic in a bit more detail with this Allocation Of Funds RapidAPI Marketplace Investor Funding Elevator Pitch Deck. Use it as a tool for discussion and navigation on Investment Funds, Operational Costs, Marketing And Product Development, Allocation Of Funds. This template is free to edit as deemed fit for your organization. Therefore download it now.


