Financials PowerPoint Templates, Financial Statement PPT Templates
- Sub Categories
-
- 30 60 90 Day Plan
- About Us Company Details
- Action Plan
- Agenda
- Annual Report
- Audit Reports
- Balance Scorecard
- Brand Equity
- Business Case Study
- Business Communication Skills
- Business Plan Development
- Business Problem Solving
- Business Review
- Capital Budgeting
- Career Planning
- Change Management
- Color Palettes
- Communication Process
- Company Location
- Company Vision
- Compare
- Competitive Analysis
- Corporate Governance
- Cost Reduction Strategies
- Custom Business Slides
- Customer Service
- Dashboard
- Data Management
- Decision Making
- Digital Marketing Strategy
- Digital Transformation
- Disaster Management
- Diversity
- Equity Investment
- Financial Analysis
- Financial Services
- Financials
- Growth Hacking Strategy
- Human Resource Management
- Innovation Management
- Interview Process
- Knowledge Management
- Leadership
- Lean Manufacturing
- Legal Law Order
- Management
- Market Segmentation
- Marketing
- Media and Communication
- Meeting Planner
- Mergers and Acquisitions
- Metaverse
- Newspapers
- Operations and Logistics
- Organizational Structure
- Our Goals
- Performance Management
- Pitch Decks
- Pricing Strategies
- Process Management
- Product Development
- Product Launch Ideas
- Product Portfolio
- Project Management
- Purchasing Process
- Quality Assurance
- Quotes and Testimonials
- Real Estate
- Risk Management
- Sales Performance Plan
- Sales Review
- SEO
- Service Offering
- Six Sigma
- Social Media and Network
- Software Development
- Solution Architecture
- Stock Portfolio
- Strategic Management
- Strategic Planning
- Supply Chain Management
- Swimlanes
- System Architecture
- Team Introduction
- Testing and Validation
- Thanks-FAQ
- Time Management
- Timelines Roadmaps
- Value Chain Analysis
- Value Stream Mapping
- Workplace Ethic
-
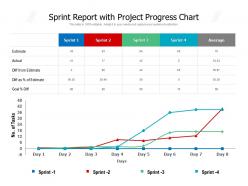 Sprint report with project progress chart
Presenting this set of slides with name Sprint Report With Project Progress Chart. The topics discussed in these slide is Sprint Report With Project Progress Chart. This is a completely editable PowerPoint presentation and is available for immediate download. Download now and impress your audience.
-
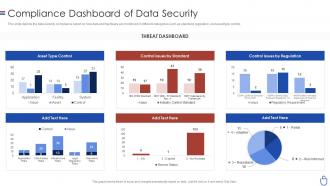 Data security it compliance dashboard snapshot of data security
This slide depicts the data security compliance report on how data and hardware are monitored in different categories such as standard, regulation, and asset type control. Present the topic in a bit more detail with this Data Security IT Compliance Dashboard Snapshot Of Data Security. Use it as a tool for discussion and navigation on Asset Type Control, Control Issues By Standard, Control Issues By Regulation, Threat Dashboard. This template is free to edit as deemed fit for your organization. Therefore download it now.
-
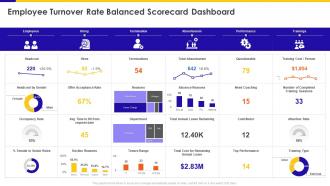 Employee Turnover Rate Balanced Scorecard Dashboard Ppt Demonstration
Present the topic in a bit more detail with this Employee Turnover Rate Balanced Scorecard Dashboard Ppt Demonstration. Use it as a tool for discussion and navigation on Annual Leave Remaining, Contributor, Occupancy Rate, Decline Reasons. This template is free to edit as deemed fit for your organization. Therefore download it now.
-
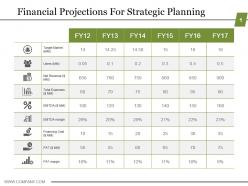 Financial projections for strategic planning powerpoint slide
Presenting financial projections for strategic planning powerpoint slide. This is a financial projections for strategic planning powerpoint slide. This is a six stage process. The stages in this process are business, finance, marketing, strategy, analysis, success.
-
 Accounting Ratio Powerpoint Presentation Slides
Edit these PowerPoint visuals to the way you prefer. 25 deeply researched slides with graphs, charts and dashboards. Download all slides with just a single click. View on standard as well as widescreen monitors. Google Slides compatibility. Can be utilized by businessmen, firms, accountants, etc. Premium customer support provided. This is a one stage process. The stages in this process are accounting ratio, financial statement, balance sheet.
-
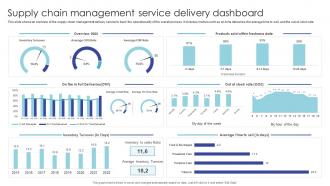 Supply Chain Management Service Delivery Dashboard
This slide shows an overview of the supply chain management delivery service to track the operationality of the overall process. It includes metrics such as on time deliveries, the average time to sell, and the out of stock rate. Presenting our well structured Supply Chain Management Service Delivery Dashboard. The topics discussed in this slide are Inventory Turnover, Products Sold, Freshness Date. This is an instantly available PowerPoint presentation that can be edited conveniently. Download it right away and captivate your audience.
-
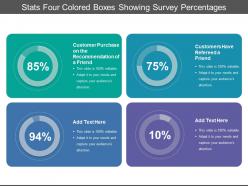 Stats four colored boxes showing survey percentages
Presenting this set of slides with name - Stats Four Colored Boxes Showing Survey Percentages. This is a four stage process. The stages in this process are Stats, Statistics, Data.
-
 Investment powerpoint presentation slides
Presenting investment PowerPoint deck. This complete presentation comprises of total of 44 PPT slides. This deck is completely apt for investment managers to create portfolios for the investors. It covers all the aspects of the topic and includes all the major elements such as graphs and charts to make the work easy. This presentation has been crafted with an extensive research done by the research experts. Our PowerPoint professionals have incorporated appropriate diagrams, layouts, templates and icons related to the topic. The best part is that these templates are completely customizable. Edit the colour, text and icon as per your need. Click the download button below to grab this complete PPT deck on investment portfolio management.
-
 Cost reduction program strategic opportunity assessment framework manufacturing
Deliver a credible and compelling presentation by deploying this Cost Reduction Program Strategic Opportunity Assessment Framework Manufacturing. Intensify your message with the right graphics, images, icons, etc. presented in this complete deck. This PPT template is a great starting point to convey your messages and build a good collaboration. The twelve slides added to this PowerPoint slideshow helps you present a thorough explanation of the topic. You can use it to study and present various kinds of information in the form of stats, figures, data charts, and many more. This Cost Reduction Program Strategic Opportunity Assessment Framework Manufacturing PPT slideshow is available for use in standard and widescreen aspects ratios. So, you can use it as per your convenience. Apart from this, it can be downloaded in PNG, JPG, and PDF formats, all completely editable and modifiable. The most profound feature of this PPT design is that it is fully compatible with Google Slides making it suitable for every industry and business domain.
-
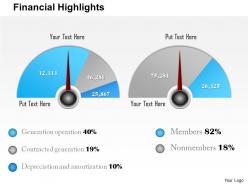 0414 financial range definer diagram
All images are 100% editable in the presentation design. Good quality images can be used to compliment message. Works well in Windows 7, 8, 10, XP, Vista and Citrix. Editing in presentation slide show can be done from anywhere by any device. Students, teachers, businessmen or industrial managers can put to use the PPT layout as per their requirement. PPT graphic offers font size which can be read from a distance.
-
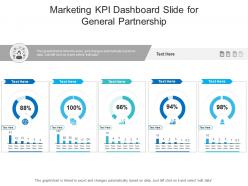 Marketing kpi dashboard slide for general partnership powerpoint template
This Marketing Kpi Dashboard Slide For General Partnership Powerpoint Template is designed using a data-driven approach to help you display important stats, figures, insights, and metrics related to the topic of your choice. You can also deploy this slide to present reports on a specific business project and strategy. It is tailor-made using a mix of KPIs that make the information easily understandable. Project managers, executives, or other department heads can grab this readily available PowerPoint presentation slide to present relevant information. It can be further used for monitoring and identifying various trends doing rounds in the industry of your choice. The biggest feature of this PowerPoint layout is that it is designed using vector-based and high-quality graphics that can be reproduced as PNGs, JPGs, and PDFs. It also works well with Google Slides and PowerPoint. Therefore, giving a lot of options to work with.
-
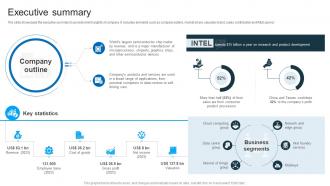 Executive Summary Intel Company Profile Ppt Structure CP SS
The slide showcases the executive summary to provide brief insights of company. It includes elements such as company outline, market share, valuable brand, sales contribution and RandD spend. Present the topic in a bit more detail with this Executive Summary Intel Company Profile Ppt Structure CP SS. Use it as a tool for discussion and navigation on Executive Summary. This template is free to edit as deemed fit for your organization. Therefore download it now.
-
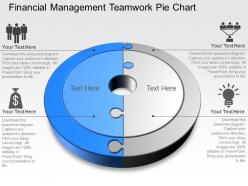 Financial management teamwork pie chart powerpoint template slide
Fully editable financial management teamwork pie chart PPT slideshow. Use of high-resolution images and the graphics. Ease to share the Presentation slide in standard and widescreen view. Valuable for the business presenters, management and the entrepreneurs. Compatible with Google slides as well. Replace the watermark with your company’s name or logo. Convertible into numerous format options like JPEG, JPG or PDF. User friendly structure of the slides. Access to edit the content, style, size and orientation of the PPT slides.
-
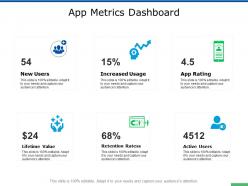 App metrics dashboard active users ppt powerpoint presentation outline visuals
Presenting this set of slides with name App Metrics Dashboard Active Users Ppt Powerpoint Presentation Outline Visuals. This is a six stage process. The stages in this process are Finance, Analysis, Business, Investment, Marketing. This is a completely editable PowerPoint presentation and is available for immediate download. Download now and impress your audience.
-
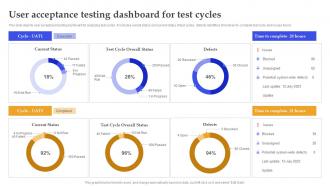 User Acceptance Testing Dashboard For Test Cycles
This slide depicts user acceptance testing dashboard for analyzing test cycles. It includes overall status and current status of test cycles, defects identified, time taken to complete test cycle and issues found. Introducing our User Acceptance Testing Dashboard For Test Cycles set of slides. The topics discussed in these slides are Test Cycles, User Acceptance Testing, Dashboard. This is an immediately available PowerPoint presentation that can be conveniently customized. Download it and convince your audience.
-
 Cement Producing Company Executive Summary Report
This slide showcase executive summary report of cement manufacturing company that provides house building solutions to builders and real state developers. It illustrates company overview, products, management team, shareholding structure, competitor analysis, awards and achievements Introducing our Cement Producing Company Executive Summary Report set of slides. The topics discussed in these slides are Overview, Products, Management Team. This is an immediately available PowerPoint presentation that can be conveniently customized. Download it and convince your audience.
-
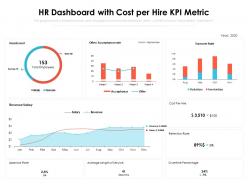 Hr dashboard with cost per hire kpi metric
Presenting this set of slides with name HR Dashboard With Cost Per Hire KPI Metric. The topics discussed in these slides are Retention Rate, Overtime Percentage, Cost Per Hire, Revenue, Salary. This is a completely editable PowerPoint presentation and is available for immediate download. Download now and impress your audience.
-
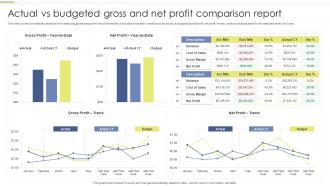 Actual Vs Budgeted Gross And Net Profit Comparison Report
This slide covers a profitability dashboard for analyzing gross margin and net profit metrics. It includes evaluation charts such as actual vs budgeted gross profit, net profit, trends, variance analysis table for the selected month and year. Introducing our Actual Vs Budgeted Gross And Net Profit Comparison Report set of slides. The topics discussed in these slides are Actual Vs Budgeted, Gross, Net Profit, Comparison Report. This is an immediately available PowerPoint presentation that can be conveniently customized. Download it and convince your audience.
-
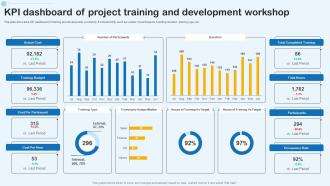 KPI Dashboard Of Project Training And Development Workshop
This slide shows the KPI dashboard of training and development workshop. It includes KPIs such as number of participants, training duration, training type, etc. Presenting our well structured KPI Dashboard Of Project Training And Development Workshop. The topics discussed in this slide are Actual Cost, Training Budget, Cost Per Participant. This is an instantly available PowerPoint presentation that can be edited conveniently. Download it right away and captivate your audience.
-
 Costing Structure Powerpoint Presentation Slides
Presenting Costing Structure PowerPoint Presentation Slides. The user can adapt to any scheme in colors, fonts and texts. This PowerPoint slideshow is supported by Google slides. Quick and easy downloadable and supports other formats like JPEG and PDF. Well suited for corporate, business, sales and marketing teams. Data entry of company name, logo and trademark is uncomplicated. Quality of image remains unaffected even when you see it in widescreen view.
-
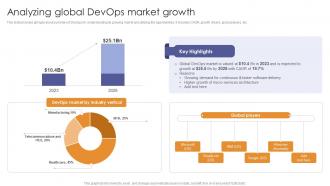 Analyzing Global Devops Market Growth Enabling Flexibility And Scalability
This slide provides glimpse about summary of DevOps for understanding its growing market and utilizing the opportunities. It includes CAGR, growth drivers, global players, etc. Present the topic in a bit more detail with this Analyzing Global Devops Market Growth Enabling Flexibility And Scalability. Use it as a tool for discussion and navigation on Analyzing Global Devops, Market Growth Enabling, Flexibility And Scalability. This template is free to edit as deemed fit for your organization. Therefore download it now.
-
 Credit Cards Overview Guide To Use And Manage Credit Cards Effectively Fin SS
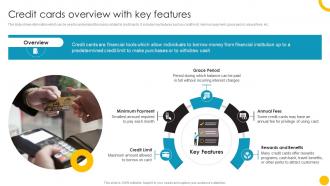
This slide shows information which can be used to understand the basics related to credit cards. It includes key features such as credit limit, minimum payment, grace period, annual fees, etc. Increase audience engagement and knowledge by dispensing information using Credit Cards Overview Guide To Use And Manage Credit Cards Effectively Fin SS. This template helps you present information on five stages. You can also present information on Overview, Grace Period, Rewards And Benefits using this PPT design. This layout is completely editable so personaize it now to meet your audiences expectations.
-
 Email marketing performance powerpoint slide graphics
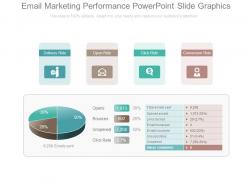
Presenting email marketing performance PowerPoint template. Access to convert the presentation design into JPG and PDF. Offer 100% access to change the size and style of the slides once downloaded and saved in the desired format. High quality charts, images and visuals used in the designing process. Choice to get presentation slide in standard or in widescreen view. Easy to convert in JPEG and PDF document. Compatible with Google slides. Easy and hassle free downloading process.
-
 Profit and loss waterfall with total income revenue
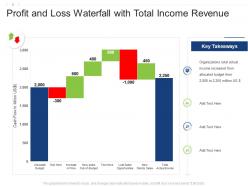
Introducing our Profit And Loss Waterfall With Total Income Revenue set of slides. The topics discussed in these slides are Organizations, Income, Budget. This is an immediately available PowerPoint presentation that can be conveniently customized. Download it and convince your audience.
-
 Financial reporting and analysis pie chart ppt slide
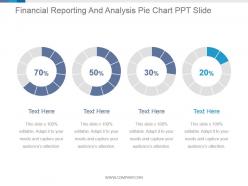
Presenting financial reporting and analysis pie chart ppt slide. This is a financial reporting and analysis pie chart ppt slide. This is a four stage process. The stages in this process are finance, marketing, percentage, process, success.
-
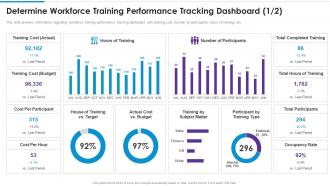 Training playbook template determine workforce training performance tracking dashboard
This slide provides information regarding workforce training performance tracking dashboard with training cost, number of participants, hours of training, etc. Present the topic in a bit more detail with this Training Playbook Template Determine Workforce Training Performance Tracking Dashboard. Use it as a tool for discussion and navigation on Training Cost, Cost Per Participant, Cost Per Hour, Hours Of Training, Number Of Participants. This template is free to edit as deemed fit for your organization. Therefore download it now.
-
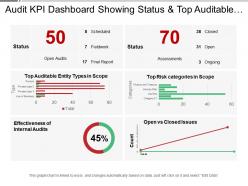 Audit kpi dashboard showing status and top auditable entity types
Presenting this set of slides with name - Audit Kpi Dashboard Showing Status And Top Auditable Entity Types. This is a six stage process. The stages in this process are Audit, Examine, Survey.
-
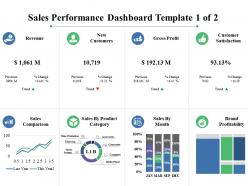 Sales performance dashboard revenue new customers
Providing sales performance dashboard revenue new customers PowerPoint template. PPT graphic can be shared in standard and widescreen view. High resolution picture quality ensures no pixel break up even when shared with large set of audience. Presentation slide is adaptable with Google slides. Magnificent to share business communication effectively. PPT slide is available with different nodes and stages. PowerPoint design can be edited as needed and change into JPG and PDF format.
-
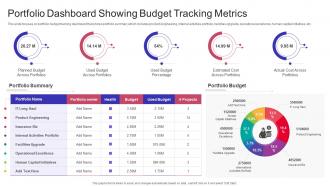 Portfolio Dashboard Showing Budget Tracking Metrics
This slide focuses on portfolio budget tracking dashboard that shows portfolio summary which includes product engineering, internal activities portfolio, facilities upgrade, operational excellence, human capital initiatives, etc. Presenting our well structured Portfolio Dashboard Showing Budget Tracking Metrics. The topics discussed in this slide are Portfolio Summary, Portfolio Budget, Portfolio Owner. This is an instantly available PowerPoint presentation that can be edited conveniently. Download it right away and captivate your audience.
-
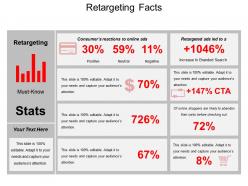 Retargeting facts powerpoint slide clipart
Presenting retargeting facts PowerPoint slide clipart PowerPoint template which is completely editable. The PPT is used by business analysts, business managers, sales managers etc. The PowerPoint presentation is compatible with multiple software and format options and with Google Slides also. Editing instructions are also provided for your kind assistance. The user can easily customize and personalize this slideshow as per his / her requirements. The visuals being of good quality do not pixelate when this PPT slide is projected on the wide screen.
-
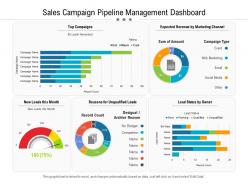 Sales campaign pipeline management dashboard
Presenting this set of slides with name Sales Campaign Pipeline Management Dashboard. The topics discussed in these slides are Campaigns, Revenue, Marketing. This is a completely editable PowerPoint presentation and is available for immediate download. Download now and impress your audience.
-
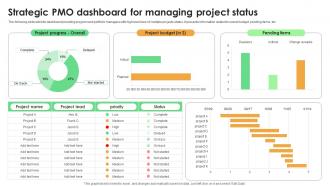 Strategic PMO Dashboard For Managing Project Status
The following slide exhibits dashboard providing program and portfolio managers with high level view of multiple projects status. It presents information related to overall budget, pending items, etc. Introducing our Strategic PMO Dashboard For Managing Project Status set of slides. The topics discussed in these slides are Project Progress, Project Budget, Pending Items. This is an immediately available PowerPoint presentation that can be conveniently customized. Download it and convince your audience.
-
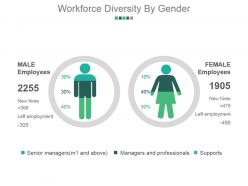 Workforce diversity by gender powerpoint slide design ideas
Presenting workforce diversity by gender powerpoint slide design ideas. This is a workforce diversity by gender powerpoint slide design ideas. This is a two stage process. The stages in this process are male employees, female employees, new hires, left employment.
-
 Venture Capital Powerpoint Presentation Slides
Presenting this set of slides with name - Venture Capital Powerpoint Presentation Slides. This is a one stage process. The stages in this process are Investment, Venture Capital, Funding, Private Equity.
-
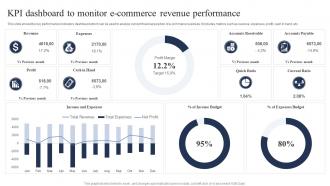 KPI Dashboard To Monitor E Commerce Revenue Performance
This slide shows the key performance indicators dashboard which can be used to analyze current financial position of e-commerce business. It includes metrics such as revenue, expenses, profit, cash in hand, etc. Presenting our well structured KPI Dashboard To Monitor E Commerce Revenue Performance. The topics discussed in this slide are Revenue, Expenses, Accounts Receivable. This is an instantly available PowerPoint presentation that can be edited conveniently. Download it right away and captivate your audience.
-
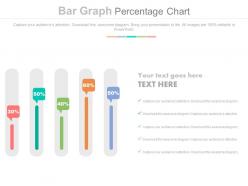 Five staged bar graph percentage chart powerpoint slides
Aesthetically designed and professionally equipped slides. High resolution. Impressive picture quality which do not pixelate when projected on wide screen. Compatible with multiple set of software available both online and offline. Compatible with team of format like JPEG, JPG and PDF. Modify the contents at your ease. 100 percent editable slide design. Execute the changes with the provided on slide assistance. Personalize the contents with your company name and logo.
-
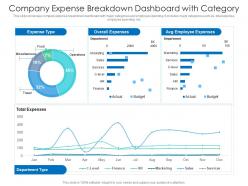 Company expense breakdown dashboard with category
This slide showcase company expense breakdown dashboard with major categories and employee spending. It includes major categories such as- total expense, employee spending etc. Presenting our well-structured Company Expense Breakdown Dashboard With Category. The topics discussed in this slide are Company Expense Breakdown Dashboard With Category. This is an instantly available PowerPoint presentation that can be edited conveniently. Download it right away and captivate your audience.
-
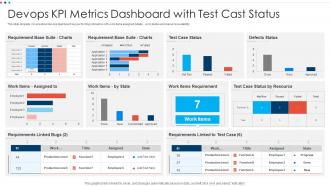 Devops KPI Metrics Dashboard With Test Cast Status
This slide template covers about devops dashboard key performing indicators with work items assigned details , work status and resource availability. Presenting our well structured Devops KPI Metrics Dashboard With Test Cast Status. The topics discussed in this slide are Devops KPI Metrics Dashboard with Test Cast Status. This is an instantly available PowerPoint presentation that can be edited conveniently. Download it right away and captivate your audience.
-
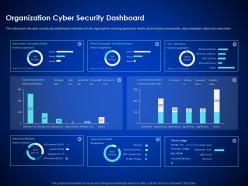 Organization cyber security dashboard snapshot enterprise cyber security ppt icons
This slide covers the cyber security key performance indicators for the organization including application health, device license consumption, data encryption status and many more Deliver an outstanding presentation on the topic using this Organization Cyber Security Dashboard Snapshot Enterprise Cyber Security Ppt Icons. Dispense information and present a thorough explanation of Organization Cyber Security Dashboard using the slides given. This template can be altered and personalized to fit your needs. It is also available for immediate download. So grab it now.
-
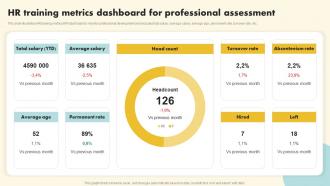 HR Training Metrics Dashboard For Professional Assessment
This slide illustrates HR training metrics KPI dashboard to monitor professional development and includes total salary, average salary, average age, permanent rate, turnover rate, etc. Presenting our well structured HR Training Metrics Dashboard For Professional Assessment The topics discussed in this slide are Total Salary, Average Salary, Head Count This is an instantly available PowerPoint presentation that can be edited conveniently. Download it right away and captivate your audience.
-
 Investor Personality Profile Powerpoint Presentation Slides
Slides are editable in PowerPoint. This presentation has 79 slides. Downloads are risk-free. This PPT is useful for the investment bankers and consultants. Slides are compatible with Google slides. Customers have Prime support. The Presentation works well in standard and widescreen. This is a one stage process. The stages in this process are product team, business model canvas, investment deals, investor scorecard, diversified global portfolio.
-
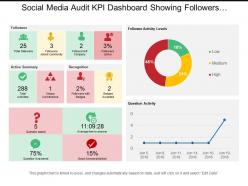 Social media audit kpi dashboard showing followers activity summary and activity leads
This PPT template is very useful for your business PowerPoint presentation. It is fully editable and has editable features like editable font, font size, font color, etc. There are many shapes to choose from like squares, triangles, circles, rectangles, pentagon and many more shapes in order to edit this presentation in PowerPoint. All the images in this PPT are 100% editable. The excel-linked charts in this PPT template can also be edited with ease. It can be viewed and saved in JPG or PDF format. It is fully compatible with Google slides as well.
-
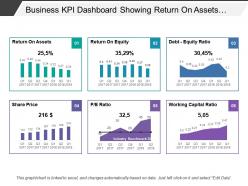 Business kpi dashboard showing return on assets debt-equity ratio
Presenting this set of slides with name - Business Kpi Dashboard Showing Return On Assets Debt-Equity Ratio. This is a six stage process. The stages in this process are Business Dashboard, Business Kpi, Business Performance.
-
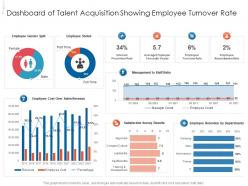 Dashboard of talent acquisition showing employee turnover rate
Presenting our well structured Dashboard Of Talent Acquisition Showing Employee Turnover Rate. The topics discussed in this slide are Sales, Revenue, Survey. This is an instantly available PowerPoint presentation that can be edited conveniently. Download it right away and captivate your audience.
-
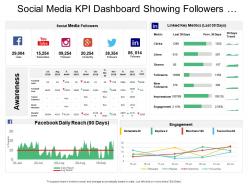 Social media kpi dashboard showing followers facebook daily reach
SlideTeam presents the Social media KPI dashboard showing followers Facebook daily reach This slideshow is modifiable according to your needs as you can make all the required changes to it whenever you feel like. You can edit the font size and font style. These slides are fully compatible with Google Slides. You can view the presentation on both 16:9 widescreen side as well as the 4:3 standard screen size. You can save them in either JPG or PDF format.
-
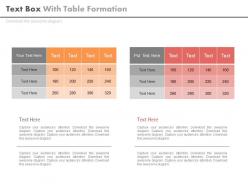 Two text boxes for table formation powerpoint slides
Presenting, two text boxes for table formation PowerPoint slides. Include your points and views into this spreadsheet. This is an appealing design for marketing and strategy focused PowerPoint presentation. This PPT template can be used by professionals from diverse background to present their ideas in a smart way. This slide is compatible with Google slides and after downloading you can use it in full version and add your company's logo for your best experience.
-
 Budget Vs Actual Variance Analysis Powerpoint Presentation Slides
Enhance your audience's knowledge with this well researched Budget Vs Actual Variance Analysis Powerpoint Presentation Slides. This deck comprises of a total of twenty slides with each slide explained in detail. Yes, these PPT slides are completely customizable. Edit the color, text, and font size. Add or delete the content from the slide. Download PowerPoint templates in both widescreen and standard screen. The presentation is fully supported by Google Slides. It can be easily converted into JPG or PDF format.
-
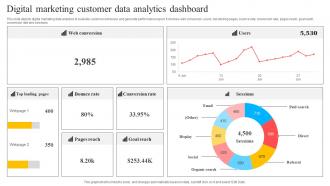 Digital Marketing Customer Data Analytics Dashboard
This slide depicts digital marketing data analytics to evaluate customer behaviour and generate performance report. It involves web conversion, users, top landing pages, bounce rate, conversion rate, pages reach, goal reach, conversion rate and sessions. Introducing our Digital Marketing Customer Data Analytics Dashboard set of slides. The topics discussed in these slides are Bounce Rate, Conversion Rate, Goal Reach. This is an immediately available PowerPoint presentation that can be conveniently customized. Download it and convince your audience.
-
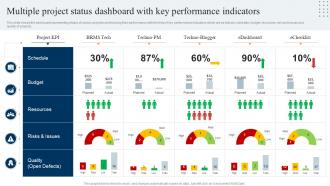 Multiple Project Status Dashboard Snapshot With Key Performance Indicators
This slide shows the dashboard representing status of various projects and tracking their performance with the help of key performance indicators which are as follows schedule, budget, resources, risk and issues and quality of projects. Introducing our Multiple Project Status Dashboard Snapshot With Key Performance Indicators set of slides. The topics discussed in these slides are Budget, Schedule, Resources. This is an immediately available PowerPoint presentation that can be conveniently customized. Download it and convince your audience.
-
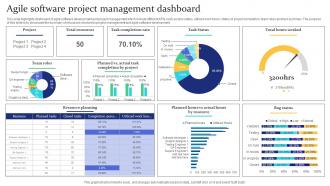 Agile Software Project Management Dashboard
This slide highlights dashboard of agile software development and project management which include different KPIs such as task status, utilized work hours, status of project completion, team roles and task summary. The purpose of this slide is to showcase the summary of resources involved in project management and agile software development. Introducing our Agile Software Project Management Dashboard set of slides. The topics discussed in these slides are Project, Task Completion Rate, Resource Planning. This is an immediately available PowerPoint presentation that can be conveniently customized. Download it and convince your audience.
-
 Financial internal controls and audit solutions powerpoint presentation slides
Enthrall your audience with this Financial Internal Controls And Audit Solutions Powerpoint Presentation Slides. Increase your presentation threshold by deploying this well-crafted template. It acts as a great communication tool due to its well-researched content. It also contains stylized icons, graphics, visuals etc, which make it an immediate attention-grabber. Comprising fourty five slides, this complete deck is all you need to get noticed. All the slides and their content can be altered to suit your unique business setting. Not only that, other components and graphics can also be modified to add personal touches to this prefabricated set.
-
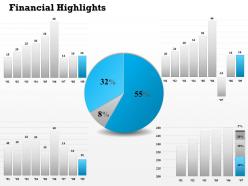 0414 financial pie and bar graph diagram
Pixel-rich quality of the images and the graphics in the slides. Visually appealing content and the slide graphics. Compatible with the Google Slides and other offline softwares. Easy to insert the company’s logo or brand name in the background while replacing the traditional watermark. Useful for the marketing and finance professionals. Allow instant downloading and saving of the slide design.
-
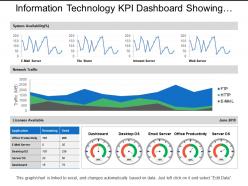 Information technology kpi dashboard showing network traffic system availability
Presenting information technology KPI dashboard showing network traffic system PowerPoint template. Choice to view PowerPoint design in standard and widescreen view. Fully editable Presentation dashboards that can be edited as needed. Easy to download and insert in the ongoing presentation. Convertible into Jpeg and Pdf document. Suitable for managers, leaders, sales and marketing people, analysts, etc. Slides are designed using latest management tools and techniques. The high-resolution view is altogether an experience with a brilliant impact.
-
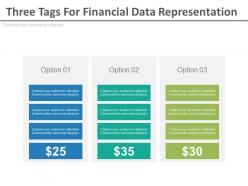 Three tags for financial data representation powerpoint slides
High resolution PPT example for business finance. Increase the level of personalization with your company logo and name. Compatible with all software and can be saved in any format. Useful tool for business analysts, sales people, sales managers and professionals of any industry. Precise and easy to comprehend information on PPT sample. Useful for finance and business related presentations. Wide screen projection does not affect the output adversely.
-
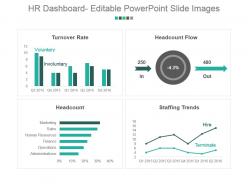 Hr dashboard editable powerpoint slide images
Stunning HR dashboard editable PPT slideshow. Loaded with incomparable benefits. Readymade PPT graphic helps in saving time and effort. Can be personalized by adding company trademark, logo, brand and symbols. Can be utilized for displaying both simple and complex information. Include or exclude slide content as per your individual need. Colors and text can be easily changed as the PPT slide is completely editable. Useful for every business leader and professional, project management team, business analysts, etc.
-
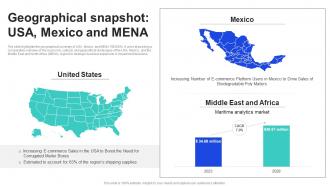 Geographical Snapshot USA Mexico And MENA Shipping Industry Report Market Size IR SS
The slide highlights the geographical summary of USA, Mexico and MENA REGION. It aims at poviding a comparative overview of the economic, cultural, and geopolitical landscapes of the USA, Mexico, and the Middle East and North Africa MENA region for strategic business expansion or investment decisions. Present the topic in a bit more detail with this Geographical Snapshot USA Mexico And MENA Shipping Industry Report Market Size IR SS. Use it as a tool for discussion and navigation on Geographical Snapshot, Usa Mexico And Mena. This template is free to edit as deemed fit for your organization. Therefore download it now.
-
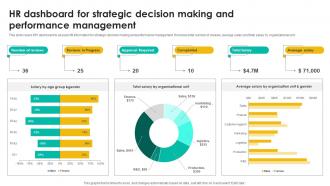 Hr Dashboard For Strategic Talent Management Tool Leveraging Technologies To Enhance Hr Services
This slide covers KPI dashboard to assess HR information for strategic decision making and performance management. It involves total number of reviews, average salary and total salary by organizational unit. Deliver an outstanding presentation on the topic using this Hr Dashboard For Strategic Talent Management Tool Leveraging Technologies To Enhance Hr Services. Dispense information and present a thorough explanation of Performance, Management, Strategic using the slides given. This template can be altered and personalized to fit your needs. It is also available for immediate download. So grab it now.
-
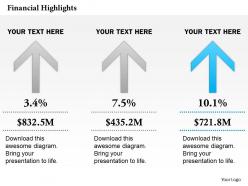 0414 three financial result arrows diagram
High resolution slide design visuals. No fear of image pixilation when projected on wide screen. Compatibility with numerous software options available both online and offline. Compatible with numerous format options. Ease of customization and personalization. Ease of editing in color and orientation of the slide visual. Freedom to add the company logo, name and trademark as part of personalization.
-
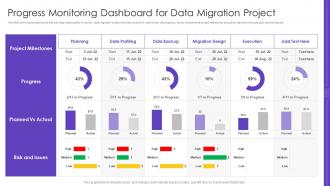 Progress Monitoring Dashboard For Data Migration Project
This slide showcases dashboard that can help organization to monitor data migration project and take actions in case of any discrepancy. Its key components project milestones progress, planned vs actual plus risk and issues. Presenting our well structured Progress Monitoring Dashboard For Data Migration Project. The topics discussed in this slide are Project Milestones, Risk And Issues, Data Profiling. This is an instantly available PowerPoint presentation that can be edited conveniently. Download it right away and captivate your audience.
-
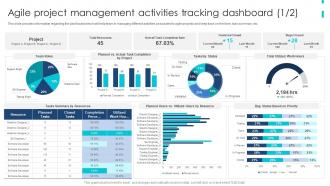 Agile Product Development Playbook Agile Project Management Activities Tracking Dashboard
This slide provides information regarding the dashboard which will help team in managing different activities associated to agile projects and keep track on the time, task summary, etc. Present the topic in a bit more detail with this Agile Product Development Playbook Agile Project Management Activities Tracking Dashboard. Use it as a tool for discussion and navigation on Project, Total Resources, Features Closed, Bugs Closed. This template is free to edit as deemed fit for your organization. Therefore download it now.


