Financials PowerPoint Templates, Financial Statement PPT Templates
- Sub Categories
-
- 30 60 90 Day Plan
- About Us Company Details
- Action Plan
- Agenda
- Annual Report
- Audit Reports
- Balance Scorecard
- Brand Equity
- Business Case Study
- Business Communication Skills
- Business Plan Development
- Business Problem Solving
- Business Review
- Capital Budgeting
- Career Planning
- Change Management
- Color Palettes
- Communication Process
- Company Location
- Company Vision
- Compare
- Competitive Analysis
- Corporate Governance
- Cost Reduction Strategies
- Custom Business Slides
- Customer Service
- Dashboard
- Data Management
- Decision Making
- Digital Marketing Strategy
- Digital Transformation
- Disaster Management
- Diversity
- Equity Investment
- Financial Analysis
- Financial Services
- Financials
- Growth Hacking Strategy
- Human Resource Management
- Innovation Management
- Interview Process
- Knowledge Management
- Leadership
- Lean Manufacturing
- Legal Law Order
- Management
- Market Segmentation
- Marketing
- Media and Communication
- Meeting Planner
- Mergers and Acquisitions
- Metaverse
- Newspapers
- Operations and Logistics
- Organizational Structure
- Our Goals
- Performance Management
- Pitch Decks
- Pricing Strategies
- Process Management
- Product Development
- Product Launch Ideas
- Product Portfolio
- Project Management
- Purchasing Process
- Quality Assurance
- Quotes and Testimonials
- Real Estate
- Risk Management
- Sales Performance Plan
- Sales Review
- SEO
- Service Offering
- Six Sigma
- Social Media and Network
- Software Development
- Solution Architecture
- Stock Portfolio
- Strategic Management
- Strategic Planning
- Supply Chain Management
- Swimlanes
- System Architecture
- Team Introduction
- Testing and Validation
- Thanks-FAQ
- Time Management
- Timelines Roadmaps
- Value Chain Analysis
- Value Stream Mapping
- Workplace Ethic
-
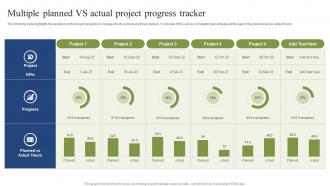 Multiple Planned VS Actual Project Progress Tracker
The following slide highlights the variations in the project progress to manage the its and ensure timely delivery. It includes KPIs such as completion percentage and the gap in the planned versus actual hours. Presenting our well structured Multiple Planned VS Actual Project Progress Tracker. The topics discussed in this slide are Project, KPIs Progress, Planned Vs Actual Hours. This is an instantly available PowerPoint presentation that can be edited conveniently. Download it right away and captivate your audience.
-
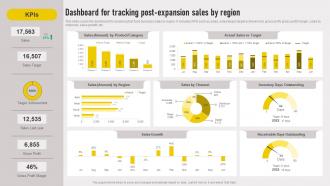 Cross Border Approach Dashboard For Tracking Post Expansion Sales By Region Strategy SS V
This slide covers the dashboard for analyzing fast food business sales by region.It includes KPIs such as sales, sales target, target achievement, gross profit, gross profit margin, sales by channels, sales growth, etc. Deliver an outstanding presentation on the topic using this Cross Border Approach Dashboard For Tracking Post Expansion Sales By Region Strategy SS V Dispense information and present a thorough explanation of Sales By Channel, Inventory Days Outstanding using the slides given. This template can be altered and personalized to fit your needs. It is also available for immediate download. So grab it now.
-
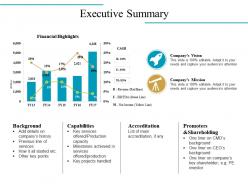 Executive summary powerpoint slides design
Presenting this set of slides with name - Executive Summary Powerpoint Slides Design. This is a two stage process. The stages in this process are Background, Capabilities, Accreditation, Promoters And Shareholding, Financial Highlights.
-
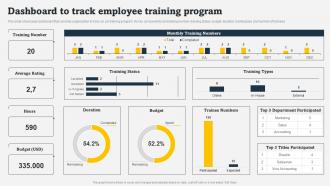 Dashboard To Track Employee Training Program On Job Employee Training Program For Skills
This slide showcases dashboard that can help organization to track on job training program. Its key components are training number, training status, budget, duration, training type and number of trainees. Present the topic in a bit more detail with this Dashboard To Track Employee Training Program On Job Employee Training Program For Skills. Use it as a tool for discussion and navigation on Dashboard, Track Employee, Training Program. This template is free to edit as deemed fit for your organization. Therefore download it now.
-
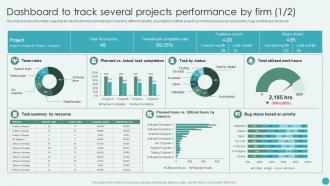 Dashboard To Track Several Projects Performance By Firm Revamping Corporate Strategy
This slide provides information regarding the dashboard which will help team in tracking different activities associated to multiple projects by monitoring resources, tasks status, bugs and features closed, etc. Deliver an outstanding presentation on the topic using this Dashboard To Track Several Projects Performance By Firm Revamping Corporate Strategy. Dispense information and present a thorough explanation of Dashboard, Track Several, Projects Performance using the slides given. This template can be altered and personalized to fit your needs. It is also available for immediate download. So grab it now.
-
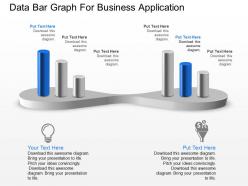 Data bar graph for business application powerpoint template slide
Presenting, data bar graph for business application PowerPoint template slide. Modifiable PPT Slide, edit the bar colors shown and personalize the text with your data. Convertible into various format options like JPEG, JPG or PDF. Display option available such as standard and widescreen view, available in 4:3 standard and full screen version 16:9. Liberty to customize it with company name and logo. Helpful for business professionals, students, teachers, business analysts and strategists. Compatible with google slides as well.
-
 Capital Expenditure Powerpoint Presentation Slides
Presenting Capital Expenditure PowerPoint Presentation Slides. This presentation contains 41 visually appealing PPT slides. These PowerPoint templates are 100 % editable. Users can edit the fonts, colors, and slide background as per their need. Download the presentation templates in both widescreen and standard screen. The presentation is compatible with Google Slides. It can be easily converted into JPG or PDF format.
-
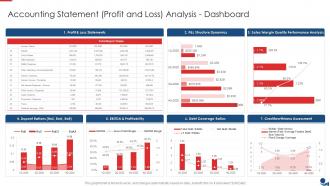 Finance And Accounting Accounting Statement Profit And Loss Analysis Dashboard
This graph or chart is linked to excel, and changes automatically based on data. Just left click on it and select Edit Data. Deliver an outstanding presentation on the topic using this Finance And Accounting Accounting Statement Profit And Loss Analysis Dashboard. Dispense information and present a thorough explanation of Profit And Loss Statements, P And L Structure Dynamics, Sales, Margin Quality Performance Analysis, Dupont Rations using the slides given. This template can be altered and personalized to fit your needs. It is also available for immediate download. So grab it now.
-
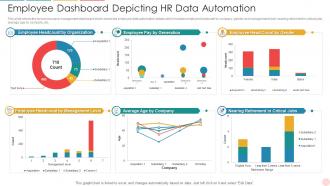 Employee Dashboard Snapshot Depicting HR Data Automation
This slide shows the human resource management dashboard which shows the employee data automation details which includes employee headcount by company, gender and management level, nearing retirement in critical jobs, average age by company, etc. Introducing our Employee Dashboard Snapshot Depicting HR Data Automation set of slides. The topics discussed in these slides are Employee Headcount By Organization, Employee Pay By Generation, Employee Head Count By Gender, Employee Headcount By Management Level. This is an immediately available PowerPoint presentation that can be conveniently customized. Download it and convince your audience.
-
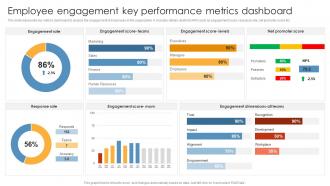 Employee Engagement Key Performance Metrics Dashboard HR Analytics Tools Application
This slide represents key metrics dashboard to analyze the engagement of employees in the organization. It includes details related to KPIs such as engagement score, response rate, net promoter score etc.Deliver an outstanding presentation on the topic using this Employee Engagement Key Performance Metrics Dashboard HR Analytics Tools Application. Dispense information and present a thorough explanation of Identifying Various, Staging Cleansing, Dashboarding Reporting using the slides given. This template can be altered and personalized to fit your needs. It is also available for immediate download. So grab it now.
-
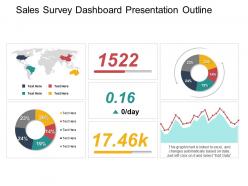 Sales survey dashboard snapshot presentation outline
Presenting sales survey dashboard snapshot presentation outline. The slideshow is fully flexible. You can incorporate them into any PowerPoint without worrying about compatibilities. It is fully compatible with Google Slides and Microsoft PowerPoint. Except this, you will get full versatility. PPT can be downloaded into JPEG and PDF formats. You can modify and personalize the design the way you want. All the design elements are 100% editable.
-
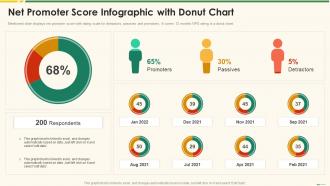 Net Promoter Score Infographic With Donut Chart Marketing Best Practice Tools And Templates
Mentioned slide displays net promoter score with rating scale for detractors, passives and promoters, It covers 12 months NPS rating in a donut chart. Deliver an outstanding presentation on the topic using this Net Promoter Score Infographic With Donut Chart Marketing Best Practice Tools And Templates. Dispense information and present a thorough explanation of Promoters, Passives, Detractors using the slides given. This template can be altered and personalized to fit your needs. It is also available for immediate download. So grab it now.
-
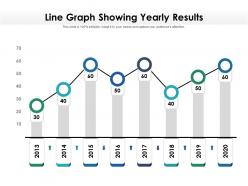 Line graph showing yearly results
Presenting this set of slides with name Line Graph Showing Yearly Results. The topics discussed in these slides is Line Graph Showing Yearly Results. This is a completely editable PowerPoint presentation and is available for immediate download. Download now and impress your audience.
-
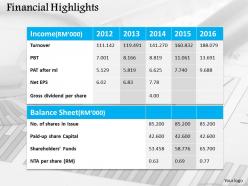 0314 financial reports and presentations
PowerPoint visual exhibited in both standard and widescreen display view options. Totally modifiable PPT template as editing allowed with fonts, text and color. Presentation slides are easy-going with Google slides. Similar designs accessible with different nodes and stages. Accessibility to convert the presentation graphic by accumulating business emblem and picture. Smooth download and adapt into JPEG and PDF document.
-
 Risk Management Dashboard For Information Risk Assessment And Management Plan For Information Security
This slide showcases dashboard that can help organization to track the major information security risks and resolve them in timely manner. Its key components are risk rating breakdown, heat map, action plan and top 5 vulnerabilities Deliver an outstanding presentation on the topic using this Risk Management Dashboard For Information Risk Assessment And Management Plan For Information Security. Dispense information and present a thorough explanation of Management, Dashboard, Information using the slides given. This template can be altered and personalized to fit your needs. It is also available for immediate download. So grab it now.
-
 Change Management Budgeting Powerpoint Presentation Slides
Presenting this set of slides with name - Change Management Budgeting Powerpoint Presentation Slides. The stages in this process are Change Management Budgeting, Change Management Cost, Change Management Financial Plan.
-
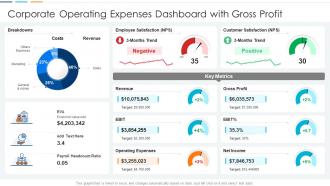 Corporate Operating Expenses Dashboard Snapshot With Gross Profit
This graph or chart is linked to excel, and changes automatically based on data. Just left click on it and select edit data. Introducing our Corporate Operating Expenses Dashboard With Gross Profit set of slides. The topics discussed in these slides are Breakdowns, Employee Satisfaction Nps, Customer Satisfaction Nps, Revenue, Gross Profit. This is an immediately available PowerPoint presentation that can be conveniently customized. Download it and convince your audience.
-
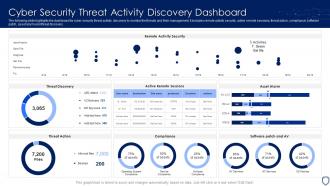 Cyber Security Threat Activity Discovery Dashboard
The following slide highlights the dashboard for cyber security threat activity discovery to monitor the threats and their management, it includes remote activity security, active remote sessions, threat action, compliance, software patch, asset alarm and threat discovery. Presenting our well structured Cyber Security Threat Activity Discovery Dashboard. The topics discussed in this slide are Cyber Security, Threat Activity, Discovery Dashboard. This is an instantly available PowerPoint presentation that can be edited conveniently. Download it right away and captivate your audience.
-
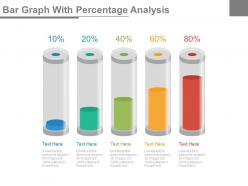 Bar graph with percentage analysis powerpoint slides
Presenting bar graph with percentage analysis powerpoint slides. This is a bar graph with percentage analysis powerpoint slides. This is a five stage process. The stages in this process are financials.
-
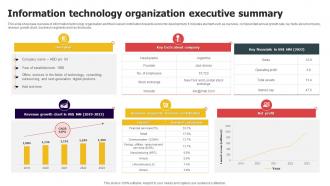 Information Technology Organization Executive Summary
This slide showcase overview of information technology organization and their overall contribution towards economic development. It includes element such as overview, compounded annual growth rate, key facts about company, revenue growth chart, business segments and key financials. Presenting our well structured Information Technology Organization Executive Summary. The topics discussed in this slide are Overview, Net Profit Company, Key Facts. This is an instantly available PowerPoint presentation that can be edited conveniently. Download it right away and captivate your audience.
-
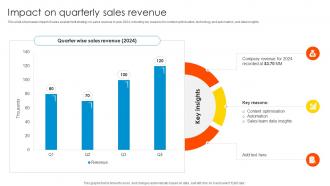 Impact On Quarterly Sales Revenue Sales Enablement Strategy To Boost Productivity And Drive SA SS
This slide showcases impact of sales enablement strategy on sales revenue in year 2024, including key reasons for content optimisation, technology and automation, and data insights. Present the topic in a bit more detail with this Impact On Quarterly Sales Revenue Sales Enablement Strategy To Boost Productivity And Drive SA SS. Use it as a tool for discussion and navigation on Sales Revenue, Company Revenue, Content Optimization. This template is free to edit as deemed fit for your organization. Therefore download it now.
-
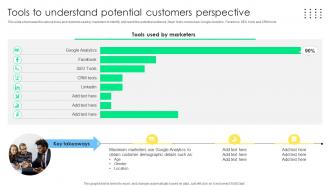 Tools To Understand Potential Sales Management Optimization Best Practices To Close SA SS
This slide showcases the various tools and channels used by marketers to identify and reach the potential audience. Major tools covered are Google Analytics, Facebook, SEO tools and CRM tools. Deliver an outstanding presentation on the topic using this Tools To Understand Potential Sales Management Optimization Best Practices To Close SA SS. Dispense information and present a thorough explanation of Understand Potential, Customers Perspective, Customer Demographic using the slides given. This template can be altered and personalized to fit your needs. It is also available for immediate download. So grab it now.
-
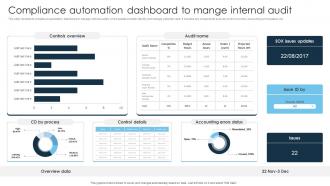 Compliance Automation Dashboard To Mange Internal Audit
This slide represents compliance automation dashboard to manage internal audits which assists to better identify and manage potential risks. It includes key components such as control overview, accounting errors status, etc. Introducing our Compliance Automation Dashboard To Mange Internal Audit set of slides. The topics discussed in these slides are Compliance Automation Dashboard, Mange Internal Audit, Accounting Errors Status. This is an immediately available PowerPoint presentation that can be conveniently customized. Download it and convince your audience.
-
 Financial data table for analysis powerpoint slides
Presenting financial data table for analysis powerpoint slides. This Power Point template slide has been crafted with graphic of data table. This PPT slide contains the concept of financial data analysis. Use this PPT slide for business and finance related presentations.
-
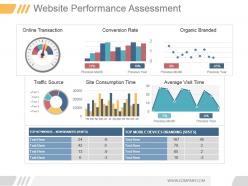 Website performance assessment powerpoint ideas
Presenting website performance assessment powerpoint ideas. This is a website performance assessment powerpoint ideas. This is a three stage process. The stages in this process are online transaction, conversion rate, organic branded, traffic, source, site consumption time, average visit time, previous month, previous year, top keywords non branded visits, top mobile devices branding visits.
-
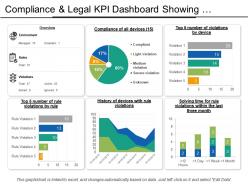 Compliance and legal kpi dashboard showing violations by devices
Presenting this set of slides with name - Compliance And Legal Kpi Dashboard Showing Violations By Devices. This is a six stage process. The stages in this process are Compliance And Legal, Legal Governance, Risk Management.
-
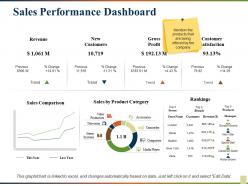 Sales performance dashboard
Presenting this set of slides with name - Sales Performance Dashboard. This is a seven stage process. The stages in this process are Revenue, New Customers, Gross Profit, Customer Satisfaction, Rankings .
-
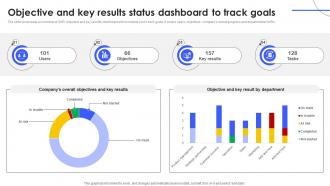 Objective And Key Results Status Dashboard To Track Goals
The slide showcases an overview of OKR objective and key results dashboard which enables you to track goals. It covers users, objectives , companys overall progress and departmental OKRs. Presenting our well structured Objective And Key Results Status Dashboard To Track Goals. The topics discussed in this slide are Overall Objectives, Result By Department, Dashboard To Track Goals. This is an instantly available PowerPoint presentation that can be edited conveniently. Download it right away and captivate your audience.
-
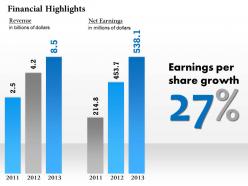 0414 financial result display bar graph diagram
All images are 100% editable in the presentation design. Good quality images can be used to compliment message. Works well in Windows 7, 8, 10, XP, Vista and Citrix. Editing in presentation slide show can be done from anywhere by any device. Students, teachers, businessmen or industrial managers can put to use the PPT layout as per their requirement. Compatibility with Google slides.
-
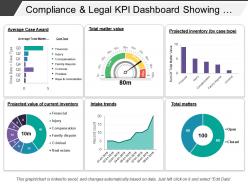 Compliance and legal kpi dashboard showing total matter value
Presenting this set of slides with name - Compliance And Legal Kpi Dashboard Showing Total Matter Value. This is a six stage process. The stages in this process are Compliance And Legal, Legal Governance, Risk Management.
-
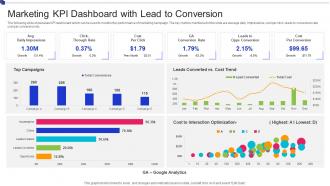 Marketing KPI Dashboard Snapshot With Lead To Conversion
The following slide showcases KPI dashboard snapshot which can be used to monitor the performance of marketing campaign. The key metrics mentioned in the slide are average daily impressions, cost per click, leads to conversion rate, cost per conversion etc. Introducing our Marketing KPI Dashboard With Lead To Conversion set of slides. The topics discussed in these slides are Avg Daily Impressions, Click Through Rate, Cost Per Click, GA Conversion Rate, Leads To Opps Conversion, Cost Per Conversion. This is an immediately available PowerPoint presentation that can be conveniently customized. Download it and convince your audience.
-
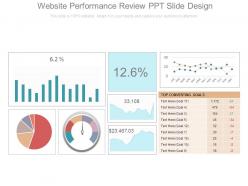 Website performance review ppt slide design
Presenting website performance review ppt slide design. This is a website performance review ppt slide design. This is a four stage process. The stages in this process are business, strategy, finance, management, marketing.
-
 Investor presentation to raise private equity funds powerpoint presentation slides
Enthrall your audience with this Investor Presentation To Raise Private Equity Funds Powerpoint Presentation Slides. Increase your presentation threshold by deploying this well crafted template. It acts as a great communication tool due to its well researched content. It also contains stylized icons, graphics, visuals etc, which make it an immediate attention grabber. Comprising fourty seven slides, this complete deck is all you need to get noticed. All the slides and their content can be altered to suit your unique business setting. Not only that, other components and graphics can also be modified to add personal touches to this prefabricated set.
-
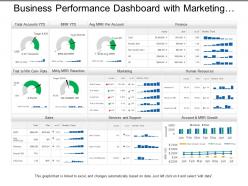 Business performance dashboard with marketing human resource and sales
Presenting, business performance dashboard with marketing human resource and sales PPT deck. This PPT deck focuses on one of the aspects of business marketing with content broadly researched by our business research team. Quickly editable color combinations, layout, text boxes, and font. Alluring graphs for illustration with relatable images to explain the concept. Transform into PDF and JPG format at ease. Predesigned content is adaptable and can be projected to widescreen for business meetings.
-
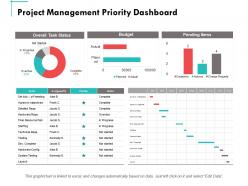 Project management priority dashboard ppt powerpoint presentation summary slide download
Presenting this set of slides with name - Project Management Priority Dashboard Ppt Powerpoint Presentation Summary Slide Download. This is a two stages process. The stages in this process are Finance, Marketing, Management, Investment, Analysis.
-
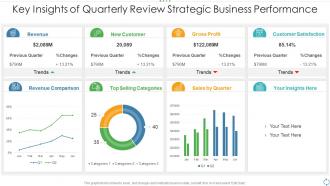 Key insights of quarterly review strategic business performance
Introducing our Key Insights Of Quarterly Review Strategic Business Performance set of slides. The topics discussed in these slides are Revenue, Customer Satisfaction, Gross Profit. This is an immediately available PowerPoint presentation that can be conveniently customized. Download it and convince your audience.
-
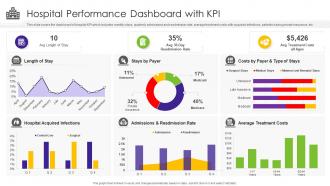 Hospital Performance Dashboard With KPI
This slide covers the dashboard of hospital KPI which includes monthly stays, quarterly admissions and readmission rate, average treatment costs with acquired infections, patients having private insurance, etc. Presenting our well structured Hospital Performance Dashboard With KPI. The topics discussed in this slide are Avg Length Of Stay, Avg Treatment Costs All Ages, Stays By Payer, Average Treatment Costs, Admissions And Readmission Rate, Hospital Acquired Infections, Length Of Stay. This is an instantly available PowerPoint presentation that can be edited conveniently. Download it right away and captivate your audience.
-
 Project Management Dashboard Budget By Employee
Presenting this set of slides with name - Project Management Dashboard Budget By Employee. This is a one stage process. The stages in this process are Percentage, Product, Marketing, Management, Business.
-
 Income Model Powerpoint Presentation Slides
Presenting this set of slides with name - Income Model Powerpoint Presentation Slides. This is a one stage process. The stages in this process are Income Model, Income Framework, Earning Model.
-
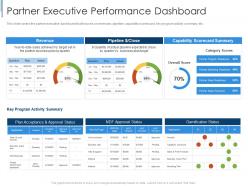 Partner executive performance dashboard effective partnership management customers
This slide covers the partner executive dashboard that focuses on revenues, pipeline, capability scoreboard, key program activity summary, etc.Deliver an outstanding presentation on the topic using this Partner Executive Performance Dashboard Effective Partnership Management Customers. Dispense information and present a thorough explanation of Capability Scorecard Summary, Plan Acceptance And Approval, Activity Summary using the slides given. This template can be altered and personalized to fit your needs. It is also available for immediate download. So grab it now.
-
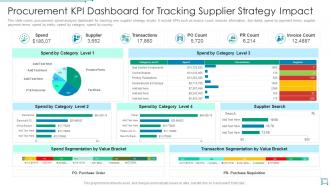 Procurement kpi dashboard for tracking supplier strategy impact
This slide covers procurement spend analysis dashboard for tracking new supplier strategy results. It include KPIs such as invoice count, invoices information, due dates, spend by payment terms, supplier payment terms, spend by entity, spend by category, spend by country. Introducing our Procurement KPI Dashboard For Tracking Supplier Strategy Impact set of slides. The topics discussed in these slides are Transactions, Supplier, Purchase Order. This is an immediately available PowerPoint presentation that can be conveniently customized. Download it and convince your audience.
-
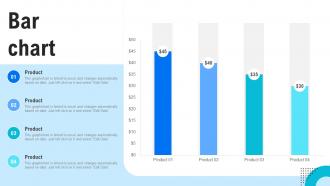 Bar Chart Human Resource Retention Strategies For Business Owners
Present the topic in a bit more detail with this Bar Chart Human Resource Retention Strategies For Business Owners. Use it as a tool for discussion and navigation on Bar Chart. This template is free to edit as deemed fit for your organization. Therefore download it now.
-
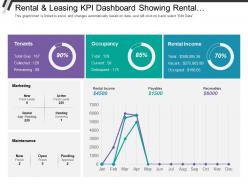 Rental and leasing kpi dashboard showing rental income occupancy tenants
As this PPT presentation is fully editable you change the size, orientation and color of the various graphical illustrations used in the pre-designed slides. You can edit the font size, font color and even the font style of the text used here. After you download the slideshow you can view it in standard size display ratio of 4:3 or widescreen display ratio of 16:9 conveniently. Any changes that you need to make can be made following instructions given in the sample slides.
-
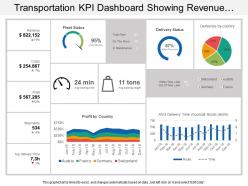 Transportation kpi dashboard snapshot showing revenue costs profit fleet status
Presenting KPI dashboard snapshot showing revenue costs profit fleet status slideshow. Change PowerPoint structure, font, text, color and design as per your requirements. Easy to input data with excel linked charts, just right to click to input data. This presentation theme is totally attuned with Google slides. Easy conversion to other software’s like JPG and PDF formats. Image quality of these PPT diagram remains the unchanged even when you resize the image or portray on large screens.
-
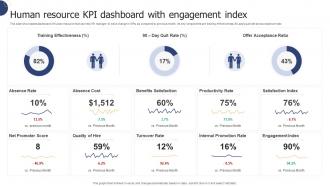 Human Resource KPI Dashboard With Engagement Index
This slide showcases dashboard of human resource that can help HR manager to track change in KPIs as compared to previous month. Its key components are training effectiveness, 90 days quit rate and acceptance ratio. Introducing our Human Resource KPI Dashboard With Engagement Index set of slides. The topics discussed in these slides are Benefits Satisfaction, Productivity Rate, Training Effectiveness. This is an immediately available PowerPoint presentation that can be conveniently customized. Download it and convince your audience.
-
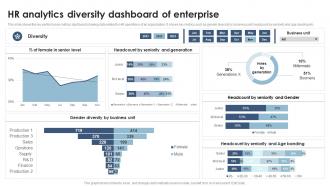 Hr Analytics Diversity Dashboard Of Enterprise Analyzing And Implementing HR Analytics In Enterprise
This slide shows the key performance metrics dashboard showing data related to HR operations of an organization. It shows key metrics such as gender diversity by business unit, headcount by seniority and age banding etc. Present the topic in a bit more detail with this Hr Analytics Diversity Dashboard Of Enterprise Analyzing And Implementing HR Analytics In Enterprise. Use it as a tool for discussion and navigation on Analytics Diversity, Dashboard Of Enterprise, Business Unit. This template is free to edit as deemed fit for your organization. Therefore download it now.
-
 Financial Ratios Powerpoint Presentation Slides
Our slides are completely editable. Quickly downloadable template. This design consists of 27 slides. High-resolution template. Compatible presentation layout. Easily convertible into PDF and JPG formats. Standardized position, color, and style. 100% risk-free graphics. These stock photos can be used by investors, promoters, manager, potential shareholder, finance creditors, budget analyst, finance professionals, marketers, and sales.The stages in this process are accounting ratio, financial statement, financial ratios.
-
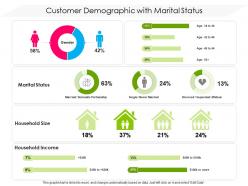 Customer demographic with marital status
Presenting this set of slides with name Customer Demographic With Marital Status. The topics discussed in these slides are Marital Status, Household Size, Household Income. This is a completely editable PowerPoint presentation and is available for immediate download. Download now and impress your audience.
-
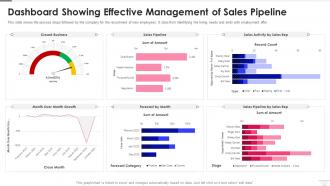 Dashboard Snapshot Showing Effective Management Of Sales Pipeline Sales Pipeline Management
This slide shows the process steps followed by the company for the recruitment of new employees. It stars from Identifying the hiring needs and ends with employment offer Present the topic in a bit more detail with this Dashboard snapshot Showing Effective Management Of Sales Pipeline Sales Pipeline Management. Use it as a tool for discussion and navigation on Management, Pipeline, Dashboard. This template is free to edit as deemed fit for your organization. Therefore download it now.
-
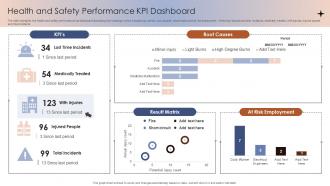 Health And Safety Performance KPI Dashboard
The slide highlights the health and safety performance kpi dashboard illustrating key headings which includes kpi, period, root causes, result matrix and at risk employment. Where kpi depicts lost time incidents, medically treated, with injuries, injured people and total incidents Presenting our well-structured Health And Safety Performance KPI Dashboard. The topics discussed in this slide are Root Causes, Result Matrix, At Risk Employment. This is an instantly available PowerPoint presentation that can be edited conveniently. Download it right away and captivate your audience.
-
 Incident Management Performance Dashboard Metrics
This slide depicts incident management service level agreement dashboard which helps to keep track of compliance data and address within specified time limit. It includes elements such as incident management, incident response, high response, critical response and incident priority. Introducing our Incident Management Performance Dashboard Metrics set of slides. The topics discussed in these slides are Performance, Management, Metrics. This is an immediately available PowerPoint presentation that can be conveniently customized. Download it and convince your audience.
-
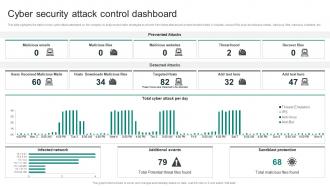 Cyber Security Attack Control Dashboard
This slide highlights the data to track cyber attack attempted on the company to analyze and make strategies to prevent from these attacks and protect sensitive data. It includes various KPIs such as malicious emails, malicious files, malicious websites, etc. Introducing our Cyber Security Attack Control Dashboard set of slides. The topics discussed in these slides are Malicious Emails, Malicious Files, Malicious Websites This is an immediately available PowerPoint presentation that can be conveniently customized. Download it and convince your audience.
-
 Relocation Allowance To Reduce Financial Stress Icon
Presenting our set of slides with Relocation Allowance To Reduce Financial Stress Icon This exhibits information on three stages of the process. This is an easy to edit and innovatively designed PowerPoint template. So download immediately and highlight information on Relocation Allowance, Reduce Financial Stress Icon
-
 Revenue Stream Cisco Investor Funding Elevator Pitch Deck
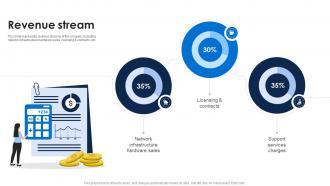
This slide represents revenue streams of the company including network infrastructure hardware sales, licensing and contracts, etc. Present the topic in a bit more detail with this Revenue Stream Cisco Investor Funding Elevator Pitch Deck Use it as a tool for discussion and navigation on Network Infrastructure, Sales, Licensing This template is free to edit as deemed fit for your organization. Therefore download it now.
-
 Budget Allocation For Product And Market Development Strategy Implementing Product Strategy SS
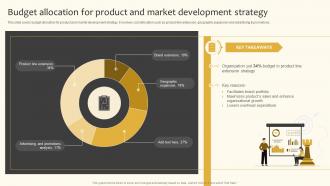
This slide covers budget allocation for product and market development strategy. It involves cost allocation such as product line extension, geographic expansion and advertising and promotions. Present the topic in a bit more detail with this Budget Allocation For Product And Market Development Strategy Implementing Product Strategy SS Use it as a tool for discussion and navigation on Strategy, Organization, Budget This template is free to edit as deemed fit for your organization. Therefore download it now.
-
 Raise seed funding angel investors key revenue streams of the company ppt designs
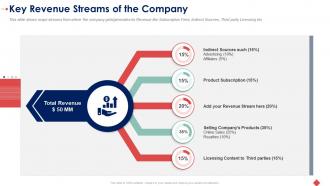
This slide shows major streams from where the company gets or generates its Revenue like Subscription Fees, Indirect Sources, Third party Licensing etc. Present the topic in a bit more detail with this Raise Seed Funding Angel Investors Key Revenue Streams Of The Company Ppt Designs. Use it as a tool for discussion and navigation on Advertising, Sources, Revenue, Products, Sales. This template is free to edit as deemed fit for your organization. Therefore download it now.
-
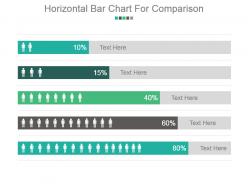 Horizontal bar chart for comparison powerpoint slide ideas
Presenting horizontal bar chart for comparison PPT slide. This presentation graph chart is fully editable in PowerPoint. You can customize the font type, font size, colors of the chart and background color as per your requirement. The slide is fully compatible with Google slides and can be saved in JPG or PDF format without any hassle. High quality graphics and icons ensure that there is no deteriorating in quality on enlarging their size. Have the tendency to boost the overall impression of your presentation.
-
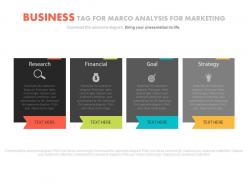 Four business tags for macro analysis for marketing powerpoint slides
This excellent PPT slide can be used for business and financial plans representation by professionals. Engaging visual used in the template can be altered and you can choose them thousands of options we have for you, also you can change their color and resize them. These PowerPoint slides are also compatible with Google slides.
-
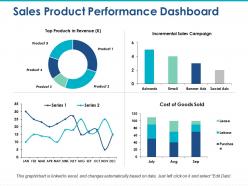 Sales product performance dashboard incremental sales campaign
Providing sales product performance dashboard incremental sales campaign presentation template with editing preference as images, icons, colors, text and layout can be edit as required. PowerPoint design can be downloaded and save into JPG and PDF format. High resolution ensures no pixel break. PPT diagram downloadable in standard and widescreen view. Fully adjustable slide as works well with Google slides. Easy to adjust and present when required. Quick to share message effectively.


