Financials PowerPoint Templates, Financial Statement PPT Templates
- Sub Categories
-
- 30 60 90 Day Plan
- About Us Company Details
- Action Plan
- Agenda
- Annual Report
- Audit Reports
- Balance Scorecard
- Brand Equity
- Business Case Study
- Business Communication Skills
- Business Plan Development
- Business Problem Solving
- Business Review
- Capital Budgeting
- Career Planning
- Change Management
- Color Palettes
- Communication Process
- Company Location
- Company Vision
- Compare
- Competitive Analysis
- Corporate Governance
- Cost Reduction Strategies
- Custom Business Slides
- Customer Service
- Dashboard
- Data Management
- Decision Making
- Digital Marketing Strategy
- Digital Transformation
- Disaster Management
- Diversity
- Equity Investment
- Financial Analysis
- Financial Services
- Financials
- Growth Hacking Strategy
- Human Resource Management
- Innovation Management
- Interview Process
- Knowledge Management
- Leadership
- Lean Manufacturing
- Legal Law Order
- Management
- Market Segmentation
- Marketing
- Media and Communication
- Meeting Planner
- Mergers and Acquisitions
- Metaverse
- Newspapers
- Operations and Logistics
- Organizational Structure
- Our Goals
- Performance Management
- Pitch Decks
- Pricing Strategies
- Process Management
- Product Development
- Product Launch Ideas
- Product Portfolio
- Project Management
- Purchasing Process
- Quality Assurance
- Quotes and Testimonials
- Real Estate
- Risk Management
- Sales Performance Plan
- Sales Review
- SEO
- Service Offering
- Six Sigma
- Social Media and Network
- Software Development
- Solution Architecture
- Stock Portfolio
- Strategic Management
- Strategic Planning
- Supply Chain Management
- Swimlanes
- System Architecture
- Team Introduction
- Testing and Validation
- Thanks-FAQ
- Time Management
- Timelines Roadmaps
- Value Chain Analysis
- Value Stream Mapping
- Workplace Ethic
-
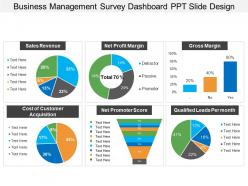 Business management survey dashboard snapshot ppt slide design
Presenting business management survey dashboard snapshot PPT slide design PowerPoint diagram which is 100% editable. This PPT template is data driven i.e. excel linked and is easy to customize and enables you to personalize it as per your own criteria. The presentation slide is fully compatible with Google slides, multiple format and software options. In case of any assistance, kindly take instructions from our presentation design services and it is easy to download in a very short span of time. The images, layouts, designs are of high quality and ensures quality in widescreen.
-
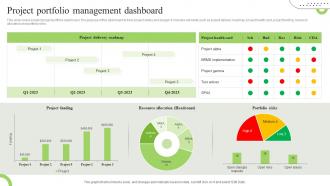 Project Portfolio Management Dashboard
This slide covers product project portfolio dashboard. The purpose of this dashboard to track project status and budget. It includes elements such as project delivery roadmap, project health card, project funding, resource allocation and portfolio risks. Presenting our well structured Project Portfolio Management Dashboard. The topics discussed in this slide are Project, Delivery, Portfolio Risks. This is an instantly available PowerPoint presentation that can be edited conveniently. Download it right away and captivate your audience.
-
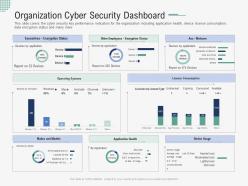 Organization cyber security dashboard implementing security awareness program ppt clipart
This slide covers the cyber security key performance indicators for the organization including application health, device license consumption, data encryption status and many more. Present the topic in a bit more detail with this Organization Cyber Security Dashboard Implementing Security Awareness Program Ppt Clipart. Use it as a tool for discussion and navigation on Organization Cyber Security Dashboard. This template is free to edit as deemed fit for your organization. Therefore download it now.
-
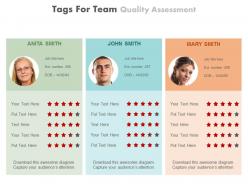 Three tags for team quality assessment powerpoint slides
This powerpoint slide can be used by professionals from diverse business backgrounds for representing their Team Quality Assessment Powerpoint Slides. You can change the images used here and can easily edit the text area to write a brief about your sales targets and conclusions. This PPT slide is also compatible with google slides.
-
 Business kpi dashboard showing marketing spend and return on investment
Presenting this set of slides with name - Business Kpi Dashboard Showing Marketing Spend And Return On Investment. This is a three stage process. The stages in this process are Business Dashboard, Business Kpi, Business Performance.
-
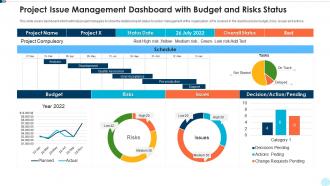 Project issue management dashboard with budget and risks status
Presenting our well structured Project Issue Management Dashboard With Budget And Risks Status. The topics discussed in this slide are MSP Framework For Risk And Issue Management. This is an instantly available PowerPoint presentation that can be edited conveniently. Download it right away and captivate your audience.
-
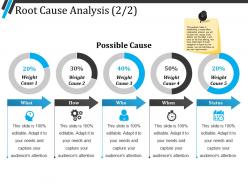 Root cause analysis ppt summary
Presenting Root Cause Analysis PPT Summary which is designed professionally for your convenience. You can change the color, fonts, font size, and font types of the template as per the requirements. The slide is readily available in both 4:3 and 16:9 aspect ratio. It is adaptable with Google Slides which makes it accessible at once. Can be converted into formats like PDF, JPG, and PNG.
-
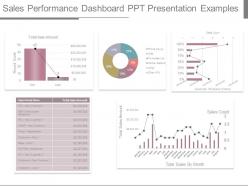 Sales performance dashboard ppt presentation examples
Presenting sales performance dashboard ppt presentation examples. This is a sales performance dashboard ppt presentation examples. This is a five stage process. The stages in this process are total sale amount, total sales amount, sales count, total sales by month, record count.
-
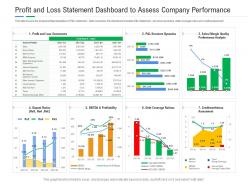 Profit and loss statement dashboard to assess company performance powerpoint template
This slide Covers the Graphical Representation of P and L statement. Data covered in this dashboard includes P and L Statement, structure dynamics, debt coverage ratios and credit assessment. This is a Profit And Loss Statement Dashboard To Assess Company Performance Powerpoint Template drafted with a diverse set of graphics, that can be reformulated and edited as per your needs and requirements. Just download it in your system and make use of it in PowerPoint or Google Slides, depending upon your presentation preferences.
-
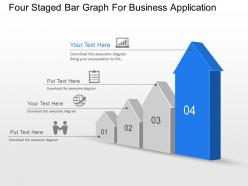 Four staged bar graph for business application powerpoint template slide
We are proud to present our four staged bar graph for business application powerpoint template slide. This power point template diagram has been crafted with graphic of four staged bar graph. This PPT diagram contains the concept of business application. Use this PPT diagram for business and finance related presentations.
-
 Business Budgeting Powerpoint Presentation Slides
Utilize ready to use presentation slides on Business Budgeting Powerpoint Presentation Slides with all sorts of editable templates, charts and graphs, overviews, analysis templates. This exclusive deck with twenty slides is here to help you to strategize, plan, analyze, or segment the topic. We have created customizable templates keeping your convenience in mind. Edit the color, text, font style at your ease. Add or delete content if needed. Download PowerPoint templates in both widescreen and standard screen. The presentation is fully supported by Google Slides. It can be easily converted into JPG or PDF format
-
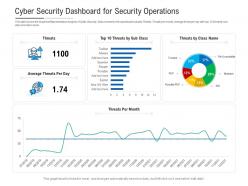 Cyber security dashboard snapshot for security operations powerpoint template
This slide Covers the Graphical Representation Analysis of Cyber Security. Data covered in this dashboard snapshot includes Threats, Threats per month, Average threat per day with top 10 threat by sub class and class name. This is a Cyber Security Dashboard Snapshot For Security Operations Powerpoint Template drafted with a diverse set of graphics, that can be reformulated and edited as per your needs and requirements. Just download it in your system and make use of it in PowerPoint or Google Slides, depending upon your presentation preferences.
-
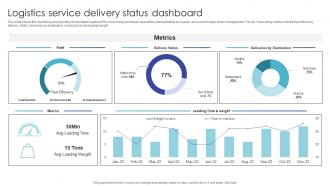 Logistics Service Delivery Status Dashboard
This slide shows the monitoring and reporting of important logistics KPIs concerning warehouse operations, transportation processes, and overall supply chain management. The key measuring metrics include fleet efficiency, delivery status, deliveries by destination, loading time and loading weight. Introducing our Logistics Service Delivery Status Dashboard set of slides. The topics discussed in these slides are Delivery Status, Deliveries By Destination, Loading Time. This is an immediately available PowerPoint presentation that can be conveniently customized. Download it and convince your audience.
-
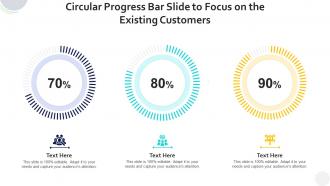 Circular progress bar slide to focus on the existing customers infographic template
Deploy our Circular Progress Bar Slide To Focus On The Existing Customers Infographic Template to present high quality presentations. It is designed in PowerPoint and is available for immediate download in standard and widescreen sizes. Not only this, but this layout is also 100 percent editable, giving you full control over its applications.
-
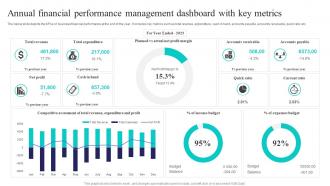 Annual Financial Performance Management Dashboard With Key Metrics
The below slide depicts the KPAs of business financial performance at the end of the year. It includes key metrics such as total revenue, expenditure, cash in hand, accounts payable, accounts receivable, quick ratio etc. Introducing our Annual Financial Performance Management Dashboard With Key Metrics set of slides. The topics discussed in these slides are Annual Financial, Performance Management, Dashboard, Key Metrics. This is an immediately available PowerPoint presentation that can be conveniently customized. Download it and convince your audience.
-
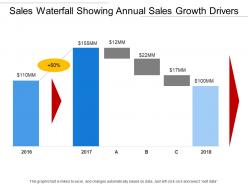 Sales waterfall showing annual sales growth drivers
Presenting the Sales Waterfall Showing Annual Sales Growth Drivers PowerPoint presentation slide. You can edit this template in PowerPoint and use it in Google slides also. The PPT layout is totally editable. You can add relevant content in the text holders provided. The image has a high resolution so that it does not blur on being enlarged. The slide is available in both standard and wide screen formats. So, click, edit and present.
-
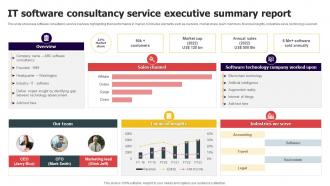 It Software Consultancy Service Executive Summary Report
This slide showcase software consultancy service overview highlighting their performance in market. It includes elements such as overview, market share, team members, financial insights, industries serve, technology used etc. Introducing our It Software Consultancy Service Executive Summary Report set of slides. The topics discussed in these slides are Overview, Sales Channel, Our Team. This is an immediately available PowerPoint presentation that can be conveniently customized. Download it and convince your audience.
-
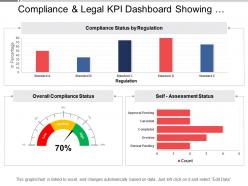 Compliance and legal kpi dashboard showing overall compliance status
Presenting this set of slides with name - Compliance And Legal Kpi Dashboard Showing Overall Compliance Status. This is a three stage process. The stages in this process are Compliance And Legal, Legal Governance, Risk Management.
-
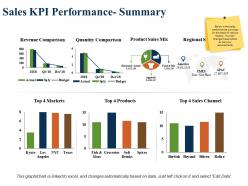 Sales kpi performance summary revenue comparison product sales mix
Presenting this set of slides with name - Sales Kpi Performance Summary Revenue Comparison Product Sales Mix. This is a three stage process. The stages in this process are Revenue Comparison, Quantity Comparison, Product Sales Mix, Regional Sales Mix, Top Sales Channel.
-
 Budget report powerpoint topics
Presenting budget report powerpoint topics. This is a budget report powerpoint topics. This is four stage process. The stages in this process are budget, incurred, planned, forecasted, project, incurred, future scheduled, remaining, amount, expenses, time and fees, total.
-
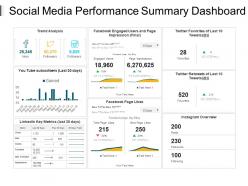 Social media performance summary dashboard presentation pictures
Presenting Social Media Performance Summary Dashboard Presentation Pictures PPT slide. This presentation design has been professionally designed, is fully editable in PowerPoint and is compatible with Google slides as well. You can customize the font type, font size, colors of the diagram, background color and add the company logo. High quality graphs, charts, tables and icons ensure that there is no deteriorating in quality on enlarging their size. Fast download at click of a button.
-
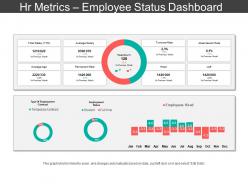 Hr metrics employee status dashboard snapshot ppt slide templates
Presenting HR Metrics Employee Status Dashboard Snapshot PPT Slide Templates which is designed professionally for your convenience. Change the color, font, font size, and font type of the slides as per your requirements. The template is compatible with Google Slides which makes it easily accessible at once. Open and save your presentation in various formats like PDF, JPG, and PNG. Freely access your template in both 4:3 and 16:9 aspect ratio.
-
 Marketing kpi dashboard showing visits traffic sources and bounce rate
Presenting this set of slides with name - Marketing Kpi Dashboard Showing Visits Traffic Sources And Bounce Rate. This is a three stage process. The stages in this process are Marketing, Branding, Promoting.
-
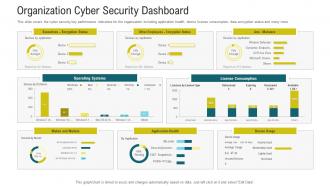 Cybersecurity awareness training organization cyber security dashboard ppt model graphics
This slide covers the cyber security key performance indicators for the organization including application health, device license consumption, data encryption status and many more. Deliver an outstanding presentation on the topic using this Cybersecurity Awareness Training Organization Cyber Security Dashboard Ppt Model Graphics. Dispense information and present a thorough explanation of Executives, License Consumption, Operating Systems using the slides given. This template can be altered and personalized to fit your needs. It is also available for immediate download. So grab it now.
-
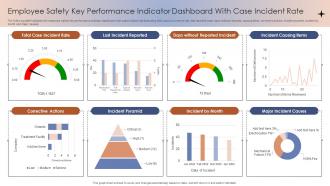 Employee Safety Key Performance Indicator Dashboard With Case Incident Rate
The following slide highlights the employee safety key performance indicator dashboard with case incident rate illustrating total case occurrence rate, last reported case, days without reported, causing items, corrective actions, incident pyramid, incident by month and major causes Presenting our well-structured Employee Safety Key Performance Indicator Dashboard With Case Incident Rate. The topics discussed in this slide are Major Incident Causes, Incident Pyramid, Corrective Actions. This is an instantly available PowerPoint presentation that can be edited conveniently. Download it right away and captivate your audience.
-
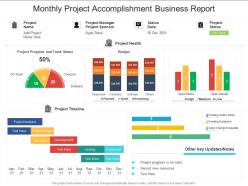 Monthly project accomplishment business report
Introducing our Monthly Project Accomplishment Business Report set of slides. The topics discussed in these slides are Project Progress, Project Timeline, Project Analysis. This is an immediately available PowerPoint presentation that can be conveniently customized. Download it and convince your audience.
-
 Private Equity Powerpoint Presentation Slides
This PPT slide can be used by anyone looking forward for representing private equity, venture capital, and angel investor, related study. These slides allow you to easily ungroup the elements shown in the diagram in a Powerpoint software and adjust the colors of the elements or alter their forms according to your fondness after downloading. Choose the icons from countless options available. Compatible with Google slides, it is completely editable.
-
 Revenue Framework Powerpoint Presentation Slides
Presenting revenue framework presentation slides. This deck has a total of 32 professionally designed slides. Our PowerPoint experts have conducted their thorough research before making it into a complete presentation. Each slide consists of professional visuals with an appropriate content. Not just this, every PPT slide comprises of diagrams, graphics, icons, charts and graphs. This deck is completely customizable. You can edit the colour, text, icon, and font size as per your need. Easy to download. Compatible with all screen types and monitors. Supports Google Slides. Premium Customer Support available. Grab this professionally designed revenue framework PPT and manage your company’s finances.
-
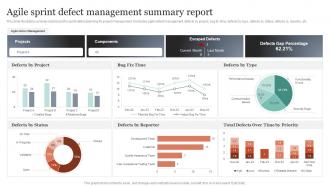 Agile Sprint Defect Management Summary Report
This slide illustrates summary dashboard for sprint defect planning for project management. It includes agile defect management, defects by project, bug fix time, defects by type, defects by status, defects by reporter, etc. Introducing our Agile Sprint Defect Management Summary Report set of slides. The topics discussed in these slides are Defects By Project, Defects By Status, Projects. This is an immediately available PowerPoint presentation that can be conveniently customized. Download it and convince your audience.
-
 Financial Scheme Powerpoint Presentation Slides
Presenting financial scheme PowerPoint presentation slides. Consisting of 69 PPT slides. This financial scheme PPT complete deck comprises of professional templates with appropriate graphics. Each template is well crafted and designed by our PowerPoint experts. Our designers have included all the necessary PowerPoint layouts in this deck such as charts, graphs, icons, shapes, and more. The best part is that these templates are easily customizable. Edit the color, text, font size, add or delete the content as per the requirement. Download this deck now.
-
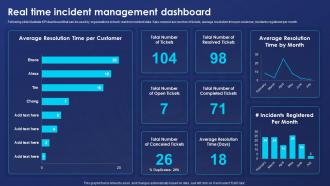 Incident Response Playbook Real Time Incident Management Dashboard
Following slide illustrate KPI dashboard that can be used by organizations to track real time incident data. Kpis covered are number of tickets, average resolution time per customer, incidents registered per month. Deliver an outstanding presentation on the topic using this Incident Response Playbook Real Time Incident Management Dashboard. Dispense information and present a thorough explanation of Real Time Incident Management, Dashboard using the slides given. This template can be altered and personalized to fit your needs. It is also available for immediate download. So grab it now.
-
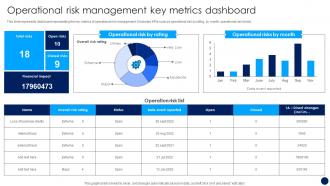 Operational Risk Management Key Metrics Dashboard Risk Management And Mitigation Strategy
This slide represents dashboard representing the key metrics of operational risk management. It includes KPIs such as operational risk by rating, by month, operational risk list etc. Present the topic in a bit more detail with this Operational Risk Management Key Metrics Dashboard Risk Management And Mitigation Strategy. Use it as a tool for discussion and navigation on Metrics Dashboard, Operational Risk, Total Risks. This template is free to edit as deemed fit for your organization. Therefore download it now.
-
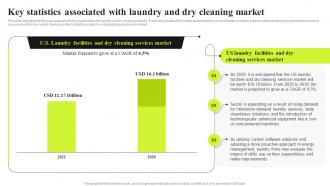 Commercial Laundry Business Plan Key Statistics Associated With Laundry And Dry Cleaning Market BP SS
This slide highlights the thorough assessment of a market within the laundry and dry-cleaning industry. It will help get valuable insights and project the success that the company expects while introducing its brand and services to consumers within the market. It will also reflect statistics related to on-demand laundry service market. Deliver an outstanding presentation on the topic using this Commercial Laundry Business Plan Key Statistics Associated With Laundry And Dry Cleaning Market BP SS. Dispense information and present a thorough explanation of Laundry And Dry Cleaning Industry, Brand And Services To Consumers, Demand Laundry Service Market, Key Statistics Associated using the slides given. This template can be altered and personalized to fit your needs. It is also available for immediate download. So grab it now.
-
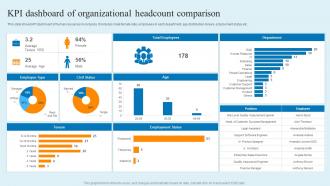 KPI Dashboard Of Organizational Headcount Comparison
This slide shows KPI dashboard of human resources in company. It includes male female ratio, employees in each department, age distribution, tenure, employment status etc. Introducing our KPI Dashboard Of Organizational Headcount Comparison set of slides. The topics discussed in these slides are KPI Dashboard, Organizational Headcount Comparison. This is an immediately available PowerPoint presentation that can be conveniently customized. Download it and convince your audience.
-
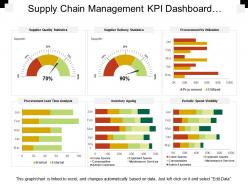 Supply chain management kpi dashboard showing procurement vs utilization
Presenting this set of slides with name - Supply Chain Management Kpi Dashboard Showing Procurement Vs Utilization. This is a six stage process. The stages in this process are Demand Forecasting, Predicting Future Demand, Supply Chain Management.
-
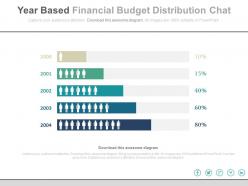 Year based financial budget distribution chart powerpoint slides
Completely modifiable slide for financial budget distribution chart. Editable images, colors and text. Presentable and easy to comprehend info graphic format. The presentation template can be downloaded and saved in any desired format. Privilege of insertion of logo and trademarks for more personalization. Adaptable to wide screen view without the problem of pixilation. Beneficial and productive insight for industry professionals, teachers, students, strategists and management planners. Can be used with google slides.
-
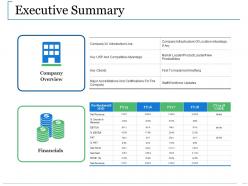 Executive summary ppt visuals
Presenting this set of slides with name - Executive Summary Ppt Visuals. This is a two stage process. The stages in this process are Company, Overview, Financials, Business, Marketing, Planning.
-
 Program status report for single project
Presenting this set of slides with name Program Status Report For Single Project. The topics discussed in these slides are Actions, Department, Analysis. This is a completely editable PowerPoint presentation and is available for immediate download. Download now and impress your audience.
-
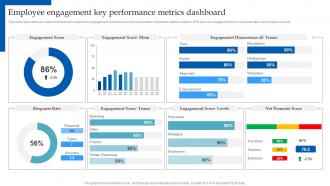 HR Analytics Implementation Employee Engagement Key Performance Metrics Dashboard
This slide represents key metrics dashboard to analyze the engagement of employees in the organization. It includes details related to KPIs such as engagement score, response rate, net promoter score etc. Present the topic in a bit more detail with this HR Analytics Implementation Employee Engagement Key Performance Metrics Dashboard. Use it as a tool for discussion and navigation on Engagement Score, Response Rate, Marketing. This template is free to edit as deemed fit for your organization. Therefore download it now.
-
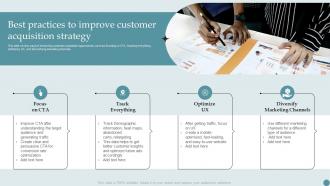 Best Practices To Improve Customer Acquisition Strategy Consumer Acquisition Techniques With CAC
This slide covers ways of enhancing customer acquisition approaches, such as focusing on CTA, tracking everything, optimizing UX, and diversifying marketing channels. Introducing Best Practices To Improve Customer Acquisition Strategy Consumer Acquisition Techniques With CAC to increase your presentation threshold. Encompassed with four stages, this template is a great option to educate and entice your audience. Dispence information on Focus CTA, Track Everything, Optimize UX, Diversify Marketing Channels, using this template. Grab it now to reap its full benefits.
-
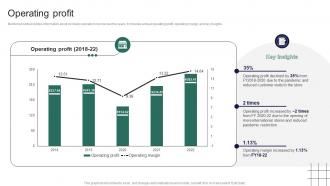 Operating Profit Retail Store Company Profile Ppt Ideas Layouts CP SS V
Mentioned slide provides information about company operation income over the years. It includes annual operating profit, operating margin, and key insights. Deliver an outstanding presentation on the topic using this Operating Profit Retail Store Company Profile Ppt Ideas Layouts CP SS V Dispense information and present a thorough explanation of Profit, Customer, Stores using the slides given. This template can be altered and personalized to fit your needs. It is also available for immediate download. So grab it now.
-
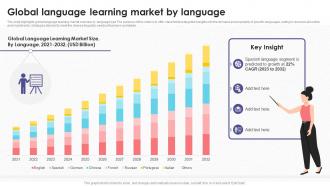 Global Language Learning Market By Tutoring Business Plan BP SS
The slide highlights global language learning market overview by language type The purpose of this slide is to offer stakeholders targeted insights into the demand and popularity of specific languages, aiding in resource allocation and market entry strategies tailored to meet the diverse linguistic needs of learners worldwide. Present the topic in a bit more detail with this Global Language Learning Market By Tutoring Business Plan BP SS. Use it as a tool for discussion and navigation on Global Language, Learning Market, Language. This template is free to edit as deemed fit for your organization. Therefore download it now.
-
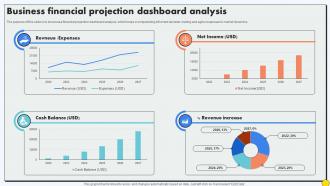 Business Financial Projection Dashboard Analysis
The purpose of this slide is to showcase financial projection dashboard analysis, which helps in empowering informed decision making and agile responses to market dynamics. Presenting our well structured Business Financial Projection Dashboard Analysis The topics discussed in this slide are Revneue Expenses, Cash Balance, Net Income This is an instantly available PowerPoint presentation that can be edited conveniently. Download it right away and captivate your audience.
-
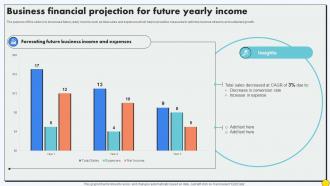 Business Financial Projection For Future Yearly Income
The purpose of this slide is to showcase future yearly income such as total sales and expenses which help in proactive measures to optimize revenue streams and sustained growth. Introducing our Business Financial Projection For Future Yearly Income set of slides. The topics discussed in these slides are Forecating Future Business, Income And Expenses This is an immediately available PowerPoint presentation that can be conveniently customized. Download it and convince your audience.
-
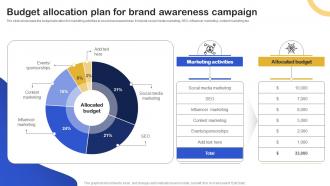 Budget Allocation Plan For Brand Awareness Campaign Storyboard SS
The slide showcases the budget allocation for marketing activities to boost brand awareness. It include social media marketing, SEO, influencer marketing, content marketing tec. Introducing our Budget Allocation Plan For Brand Awareness Campaign Storyboard SS set of slides. The topics discussed in these slides are Marketing Activities, Allocated Budget, Social Media Marketing This is an immediately available PowerPoint presentation that can be conveniently customized. Download it and convince your audience.
-
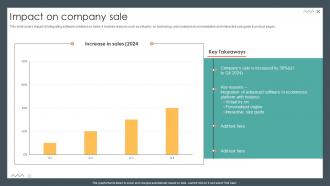 Impact On Company Sale Storyboard SS
This slide covers impact of integrating software solutions on sales. It involves reasons such as virtual try on technology, personalized recommendation and interactive size guide and product pages. Introducing our Impact On Company Sale Storyboard SS set of slides. The topics discussed in these slides are Impact Company Sale, Ecommerce This is an immediately available PowerPoint presentation that can be conveniently customized. Download it and convince your audience.
-
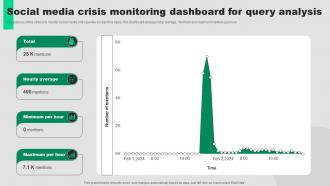 Social Media Crisis Monitoring Dashboard For Query Analysis
The purpose of this slide is to monitor social media crisis queries on real time basis. This dashboard analyzes total, average, minimum and maximum mentions per hour. Introducing our Social Media Crisis Monitoring Dashboard For Query Analysis set of slides. The topics discussed in these slides are Total, Hourly Average, Minimum Per Hour This is an immediately available PowerPoint presentation that can be conveniently customized. Download it and convince your audience.
-
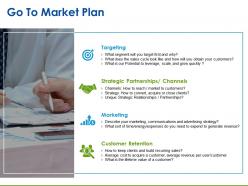 Go to market plan presentation pictures
Presenting go to market plan presentation pictures. This is a go to market plan presentation pictures. This is a four stage process. The stages in this process are targeting, strategic partnerships channels, marketing, customer retention.
-
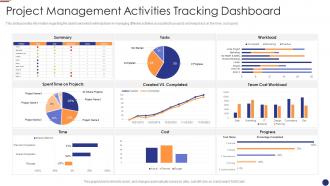 Project dashboard agile project management for software development it
This slide provides information regarding the dashboard which will help team in managing different activities associated to projects and keep track on the time, cost spent.Deliver an outstanding presentation on the topic using this Project Dashboard Agile Project Management For Software Development IT . Dispense information and present a thorough explanation of Project Management Activities Tracking Dashboard using the slides given. This template can be altered and personalized to fit your needs. It is also available for immediate download. So grab it now.
-
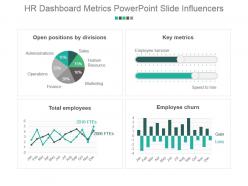 Hr dashboard snapshot metrics powerpoint slide influencers
Presenting hr dashboard snapshot metrics powerpoint slide influencers. This is a hr dashboard metrics powerpoint slide influencers. This is a four stage process. The stages in this process are open positions by divisions, key metrics, total employees, employee churn.
-
 2 years company performance scenario comparison
Presenting our well structured 2 Years Company Performance Scenario Comparison. The topics discussed in this slide are Cycle Production Time, Task Efficiency, Employee Productivity. This is an instantly available PowerPoint presentation that can be edited conveniently. Download it right away and captivate your audience.
-
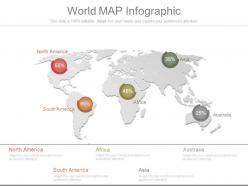 Unique world map infographic
High resolution PPT example. Easy to edit and customize PPT graphics. Compatible with all software and can be saved in any format (JPEG/JPG/PDF). Useful tool for students, business analysts and professionals of any and every industry. Precise and easy to comprehend information on PPT sample. Freedom to personalize the content with company name and logo. Hassle free addition and deletion of content as per need. The stages in this process are north america, south america, africa, australia, asia.
-
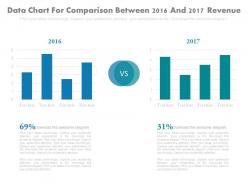 Data chart for comparison between 2016 and 2017 revenue powerpoint slides
PPT slides are simple to download. Highly compatible with Google slides and PowerPoint versions. High quality PowerPoint template illustrations. Customizable layout content, pictures, textual style shading and font. Convertible into PDF or JPG groups. Highly impactful PowerPoint template. Simply include organization logo, trademark or name in any PowerPoint slide. Perfect for business, innovation, ventures, experts, IT organizations, advertisers and so forth. The stages in this process are financials.
-
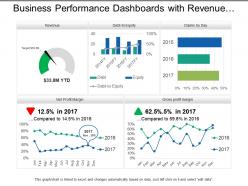 Business performance dashboards with revenue and ratios
Presenting, our business performance dashboards with revenue and ratios PPT deck. Pre-designed chart sheet directed PowerPoint Presentation template. Administration of high-resolution images, graphs, and comparison diagrams. Filled with methods and effects to create an impact. Can be quickly converted into JPEG/JPG or PDF formats as per the requirements. Congenial with Google Slides for ease. Project to widescreen without cringing about pixelating, after downloading explore these characteristics.
-
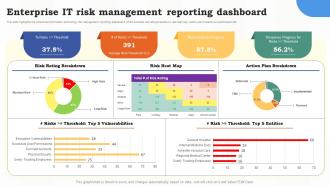 Enterprise It Risk Management Reporting Dashboard Risk Assessment Of It Systems
This slide highlights the enterprise information technology risk management reporting dashboard which includes risk rating breakdown risk heat map, action plan breakdown and thresholds. Present the topic in a bit more detail with this Enterprise It Risk Management Reporting Dashboard Risk Assessment Of It Systems. Use it as a tool for discussion and navigation on Management Reporting, Dashboard, Enterprise. This template is free to edit as deemed fit for your organization. Therefore download it now.
-
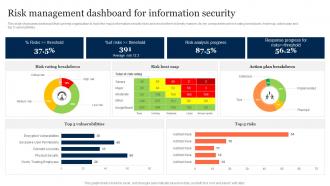 Risk Management Dashboard For Information Security Information Security Risk Management
This slide showcases dashboard that can help organization to track the major information security risks and resolve them in timely manner. Its key components are risk rating breakdown, heat map, action plan and top 5 vulnerabilities. Present the topic in a bit more detail with this Risk Management Dashboard For Information Security Information Security Risk Management. Use it as a tool for discussion and navigation on Risk Management, Dashboard, Information Security. This template is free to edit as deemed fit for your organization. Therefore download it now
-
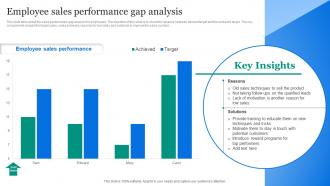 Employee Sales Performance Gap Analysis
This slide talks about the sales performance gap analysis for employees. The objective of this slide is to show the variance between desired target and the achieved target. The key components include the target sales, sales achieved, reasons for low sales and solutions to improve the sales number. Presenting our well structured Employee Sales Performance Gap Analysis. The topics discussed in this slide are Employee Sales, Performance Gap Analysis. This is an instantly available PowerPoint presentation that can be edited conveniently. Download it right away and captivate your audience.
-
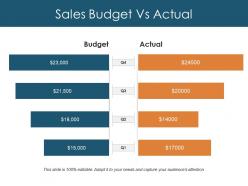 Sales budget vs actual ppt design templates
Presenting this set of slides with name - Sales Budget Vs Actual Ppt Design Templates. This is a four stage process. The stages in this process are Business, Budget, Actual, Marketing, Graph.
-
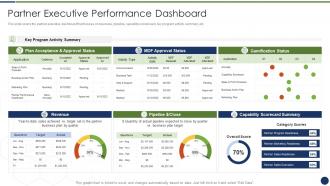 Partner executive performance dashboard improve management complex business
This slide covers the partner executive dashboard that focuses on revenues, pipeline, capability scoreboard, key program activity summary, etc. Present the topic in a bit more detail with this Partner Executive Performance Dashboard Improve Management Complex Business. Use it as a tool for discussion and navigation on Revenue, Pipeline Dollar, Capability Scorecard Summary, Target. This template is free to edit as deemed fit for your organization. Therefore download it now.
-
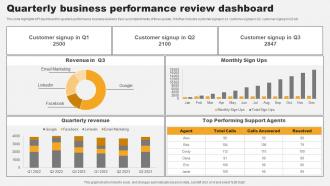 Quarterly Business Performance Review Dashboard
This slide highlights KPI dashboard for quarterly performance business review to track accomplishments of three quarter. It further includes customer signup in q1, customer signup in Q2, customer signup in Q3 etc. Introducing our Quarterly Business Performance Review Dashboard set of slides. The topics discussed in these slides are Business, Performance, Review. This is an immediately available PowerPoint presentation that can be conveniently customized. Download it and convince your audience.


