Finance PowerPoint Templates, Presentation Slide Diagrams & PPT Graphics
- Sub Categories
-
- 30 60 90 Day Plan
- Advertising
- Agile Development
- Aims and Objectives
- Arrows
- Before and After
- Blockchain Bitcoin
- Boxes
- Business
- Calender
- Case Study
- Celebrations
- Certificates
- Challenges Opportunities
- Channel Distribution
- Children
- Communication
- Competitive Landscape
- Computer
- Concepts
- Construction Management
- Corporate
- Crowdfunding
- Current State Future State
- Custom PowerPoint Diagrams
- Digital Transformation
- Dos and Donts
- Economics
- Education
- Environment
- Events
- Festival
- Finance
- Financials
- Food
- Game
- Gap Analysis
- Generic
- Geographical
- Health
- Heatmaps
- Holidays
- Icons
- Input Process Output
- Internet
- Key Messages
- Key Wins
- Ladder
- Leadership
- Lists
- Lucky Draw
- Management
- Marketing
- Measuring
- Medical
- Music
- News
- Next Steps
- People Process Technology
- Pillars
- Planning
- Post-it-Notes
- Problem Statement
- Process
- Proposal Management
- Pros and Cons
- Puzzle
- Puzzles
- Recruitment Strategy
- Religion
- Research and Development
- Risk Mitigation Strategies
- Roadmap
- Selling
- Shapes
- Short Term Long Term
- Social
- Stairs
- Start Stop Continue
- Strategy
- Symbol
- Technology
- Thesis Defense Dissertation
- Timelines
- Traffic
- Transition Plan
- Transportation
- Vehicles
- Venture Capital Funding
- Warning
- Winners
- Word Cloud
-
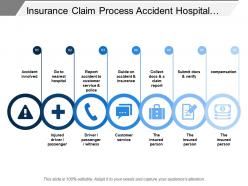 Insurance claim process accident hospital customer service document
Presenting this set of slides with name - Insurance Claim Process Accident Hospital Customer Service Document. This is a seven stage process. The stages in this process are Insurance Claim Process, Insurance Claim Steps, Insurance Claim Procedure.
-
 Financial management policies procedures standardized efficiency control
Presenting this set of slides with name - Financial Management Policies Procedures Standardized Efficiency Control. This is a six stage process. The stages in this process are Financial State, Financial Management, Economy.
-
 Stock market risk management strategies having two bulls
Presenting this set of slides with name - Stock Market Risk Management Strategies Having Two Bulls. This is a two stage process. The stages in this process are Bull Market, Financial Market, Stock Market.
-
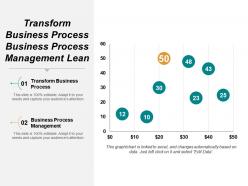 Transform business process business process management lean management process cpb
This is an editable two stages graphic that deals with topics like Transform Business Process, Business Process Management, Lean Management Process to help convey your message better graphically. This product is a premium product available for immediate download, and is 100 percent editable in Powerpoint. Download this now and use it in your presentations to impress your audience.
-
 Stock Pitch For Online Vehicle Auction Powerpoint Presentation Slides
Our Stock Pitch For Online Vehicle Auction Powerpoint Presentation Slides is the perfect way to pitch your stock. We have researched thousands of stock pitches and designed the most impactful way to convince your investors to invest in your equity.
-
 Operational process improvement to optimize business performance
Introducing our premium set of slides with Operational Process Improvement To Optimize Business Performance. Elucidate the three stages and present information using this PPT slide. This is a completely adaptable PowerPoint template design that can be used to interpret topics like Operational Process Improvement To Optimize Business Performance. So download instantly and tailor it with your information.
-
 Income calculation icon with dollar sign
Introducing our premium set of slides with Income Calculation Icon With Dollar Sign. Ellicudate the three stages and present information using this PPT slide. This is a completely adaptable PowerPoint template design that can be used to interpret topics like Income Calculation Icon With Dollar Sign. So download instantly and tailor it with your information.
-
 Product management kpi service metrics product channel segmentation ppt ideas
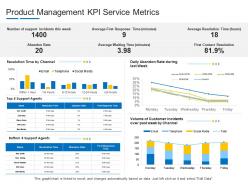
Present the topic in a bit more detail with this Product Management KPI Service Metrics Product Channel Segmentation Ppt Ideas. Use it as a tool for discussion and navigation on Product Management KPI Service Metrics. This template is free to edit as deemed fit for your organization. Therefore download it now.
-
 Stock performance chart financial market pitch deck ppt structure
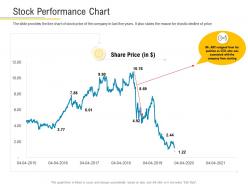
The slide provides the line chart of stock price of the company in last five years. It also states the reason for drastic decline of price. Present the topic in a bit more detail with this Stock Performance Chart Financial Market Pitch Deck Ppt Structure. Use it as a tool for discussion and navigation on Stock Performance Chart. This template is free to edit as deemed fit for your organization. Therefore download it now.
-
 Agile report with revenue trend and task analysis
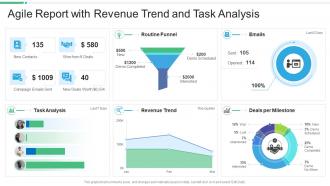
Introducing our Agile Report With Revenue Trend And Task Analysis set of slides. The topics discussed in these slides are Agile Report With Revenue Trend And Task Analysis. This is an immediately available PowerPoint presentation that can be conveniently customized. Download it and convince your audience.
-
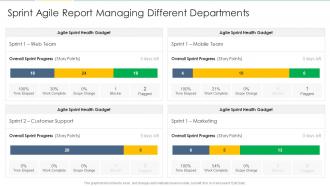 Sprint agile report managing different departments
Presenting our well-structured Sprint Agile Report Managing Different Departments. The topics discussed in this slide are Sprint Agile Report Managing Different Departments. This is an instantly available PowerPoint presentation that can be edited conveniently. Download it right away and captivate your audience.
-
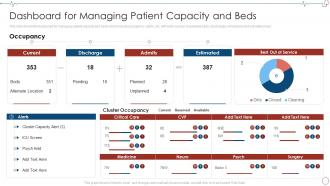 Dashboard For Managing Patient Capacity Database Management Healthcare Organizations
This slide shows the dashboard for managing patient capacity and beds which includes occupancy, alerts, etc, with total number of available beds, discharges, admissions and estimated ones. Deliver an outstanding presentation on the topic using this Dashboard For Managing Patient Capacity Database Management Healthcare Organizations. Dispense information and present a thorough explanation of Dashboard, Managing Patient, Capacity using the slides given. This template can be altered and personalized to fit your needs. It is also available for immediate download. So grab it now.
-
 Communicating Business Loan Process To Customers Icon
Introducing our premium set of slides with Communicating Business Loan Process To Customers Icon. Elucidate the three stages and present information using this PPT slide. This is a completely adaptable PowerPoint template design that can be used to interpret topics like Communicating Business, Process, Customers Icon. So download instantly and tailor it with your information.
-
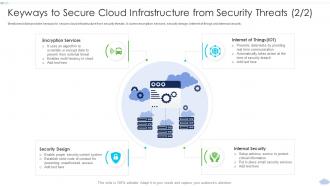 Keyways To Secure Cloud Infrastructure Strategies To Implement Cloud Computing Infrastructure
Mentioned slide provides keyways to secure cloud infrastructure from security threats. It covers encryption services, security design, internet of things and internal security. Introducing Keyways To Secure Cloud Infrastructure Strategies To Implement Cloud Computing Infrastructure to increase your presentation threshold. Encompassed with four stages, this template is a great option to educate and entice your audience. Dispence information on Encryption Services, Internal Security, Security Design, using this template. Grab it now to reap its full benefits.
-
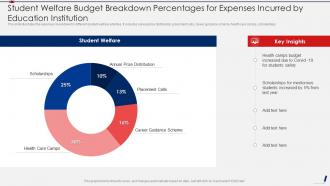 Student Welfare Budget Breakdown Percentages For Expenses Incurred By Education Institution
This slide illustrates the expenses breakdown for different student welfare activities. It includes annual price distribution, placement cells, career guidance scheme, health care camps, scholarships. Introducing our Student Welfare Budget Breakdown Percentages For Expenses Incurred By Education Institution set of slides. The topics discussed in these slides are Budget Breakdown, Percentages, Expenses Incurred. This is an immediately available PowerPoint presentation that can be conveniently customized. Download it and convince your audience.
-
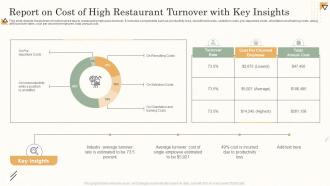 Report On Cost Of High Restaurant Turnover With Key Insights
This slide depicts breakdown of cost incurred due to restaurant employees turnover. It includes components such as productivity loss, recruitment costs, selection costs, pre departure costs, orientation and training costs, along with turnover rates, cost per churned employee, total annual cost. Introducing our Report On Cost Of High Restaurant Turnover With Key Insights set of slides. The topics discussed in these slides are Report On Cost Of High, Restaurant Turnover, With Key Insights. This is an immediately available PowerPoint presentation that can be conveniently customized. Download it and convince your audience.
-
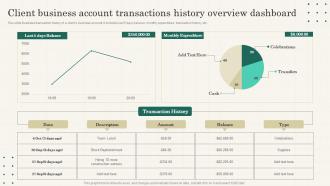 Client Business Account Transactions History Overview Dashboard
This slide illustrates transaction history of a clients business account. It includes last 5 days balance, monthly expenditure, transaction history, etc. Presenting our well-structured Client Business Account Transactions History Overview Dashboard. The topics discussed in this slide are Client Business, Account Transactions History, Overview Dashboard. This is an instantly available PowerPoint presentation that can be edited conveniently. Download it right away and captivate your audience.
-
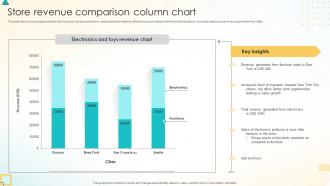 Store Revenue Comparison Column Chart
This slide shows revenue generated by electronic and furniture products in various stores to examine differences in purchases at different store locations. It includes parts such as revenue generated and cities. Presenting our well-structured Store Revenue Comparison Column Chart. The topics discussed in this slide are Store Revenue Comparison, Column Chart. This is an instantly available PowerPoint presentation that can be edited conveniently. Download it right away and captivate your audience.
-
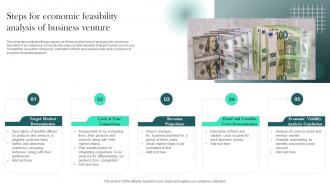 Steps For Economic Feasibility Analysis Of Business Venture
This slide demonstrates the process to be followed at the time of analyzing the economic feasibility of an enterprise. It includes five steps of determination of target market, look at your competition, projection of revenue, estimation of fixed and variable costs and conclusion of economic feasibility analysis. Presenting our set of slides with name Steps For Economic Feasibility Analysis Of Business Venture. This exhibits information on five stages of the process. This is an easy to edit and innovatively designed PowerPoint template. So download immediately and highlight information on Target Market Determination, Revenue Projections, Economic Viability, Analysis Conclusion.
-
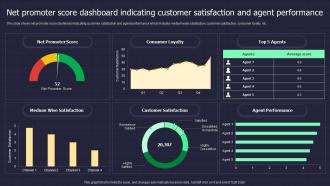 Net Promoter Score Dashboard Indicating Customer Satisfaction And Agent Performance
This slide shows net promoter score dashboard indicating customer satisfaction and agent performance which includes medium wise satisfaction, customer satisfaction, consumer loyalty, etc. Presenting our well structured Net Promoter Score Dashboard Indicating Customer Satisfaction And Agent Performance. The topics discussed in this slide are Net Promoter, Score Dashboard, Indicating Customer, Satisfaction And Agent. This is an instantly available PowerPoint presentation that can be edited conveniently. Download it right away and captivate your audience.
-
 Account Based Marketing Engagement Dashboard For Sales
This slide covers account based marketing engagement dashboard for sales. It involves details such as total number of targeted accounts, open opportunity amount, close opportunity amount etc. Presenting our well-structured Account Based Marketing Engagement Dashboard For Sales. The topics discussed in this slide are Account Based Marketing, Engagement Dashboard, Sales. This is an instantly available PowerPoint presentation that can be edited conveniently. Download it right away and captivate your audience.
-
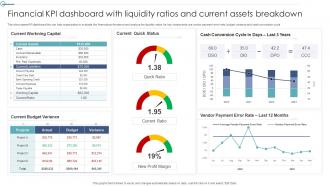 Financial KPI Dashboard With Liquidity Ratios And Current Assets Breakdown
This showcases KPI dashboard the can help organization to evaluate the financial performance and analyze the liquidity ratios. Its key components are vendor payment error rate, budget variance and cash conversion cycle Introducing our Financial KPI Dashboard With Liquidity Ratios And Current Assets Breakdown set of slides. The topics discussed in these slides are Quick Ratio, Current Ratio, New Profit Margin. This is an immediately available PowerPoint presentation that can be conveniently customized. Download it and convince your audience.
-
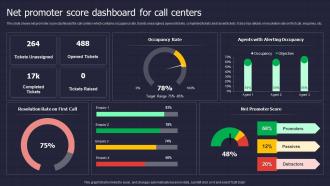 Net Promoter Score Dashboard For Call Centers
This slide shows net promoter score dashboard for call centers which contains occupancy rate, tickets unassigned, opened tickets, completed tickets and raised tickets. It also has details on resolution rate on first call, enquiries, etc. Introducing our Net Promoter Score Dashboard For Call Centers set of slides. The topics discussed in these slides are Net Promoter, Score Dashboard, Call Centers. This is an immediately available PowerPoint presentation that can be conveniently customized. Download it and convince your audience.
-
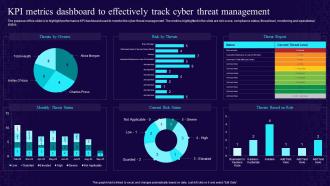 Developing Cyber Security Awareness KPI Metrics Dashboard To Effectively Track Cyber Threat Management
The purpose of this slide is to highlight performance KPI dashboard used to monitor the cyber threat management. The metrics highlighted in the slide are risk score, compliance status, threat level, monitoring and operational status. Present the topic in a bit more detail with this Developing Cyber Security Awareness KPI Metrics Dashboard To Effectively Track Cyber Threat Management. Use it as a tool for discussion and navigation on KPI Metrics Dashboard, Effectively Track Cyber, Threat Management. This template is free to edit as deemed fit for your organization. Therefore download it now.
-
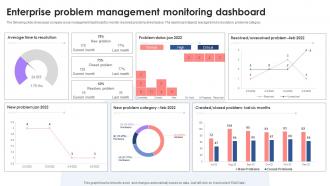 Enterprise Problem Management Monitoring Dashboard
The following slide showcases company issue management dashboard to monitor resolved problems at workplace. The dashboard depicts average time to resolution, problems category. Presenting our well structured Enterprise Problem Management Monitoring Dashboard. The topics discussed in this slide are Enterprise Problem, Management, Monitoring Dashboard. This is an instantly available PowerPoint presentation that can be edited conveniently. Download it right away and captivate your audience.
-
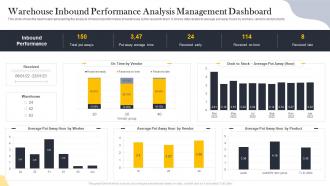 Warehouse Inbound Performance Analysis Management Dashboard
This slide shows the dashboard representing the analysis of inbound performance of warehouse by the research team. It shows data related to average put away hours by workers, vendors and products. Introducing our Warehouse Inbound Performance Analysis Management Dashboard set of slides. The topics discussed in these slides are Warehouse Inbound, Performance Analysis, Management Dashboard. This is an immediately available PowerPoint presentation that can be conveniently customized. Download it and convince your audience.
-
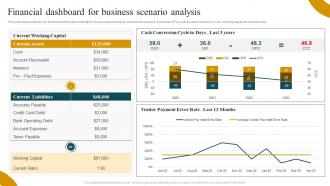 Financial Dashboard Snapshot For Business Scenario Analysis
This slide represents the key financial performance indicators of a business to analyze and plan its scenario. It includes KPIs such as cash conversion cycle, working capital and current ratio. Presenting our well structured Financial Dashboard For Business Scenario Analysis. The topics discussed in this slide are Current Assets, Current Liabilities, Financial Dashboard. This is an instantly available PowerPoint presentation that can be edited conveniently. Download it right away and captivate your audience.
-
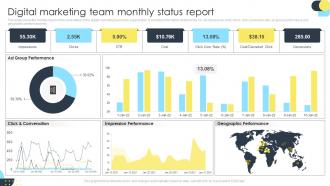 Digital Marketing Team Monthly Status Report
This slide shows the monthly report of the work status of the digital marketing team of an organization. It includes information related to the no. of impressions build, clicks, click conversion rate, ad group performance and geographic performance etc. Introducing our Digital Marketing Team Monthly Status Report set of slides. The topics discussed in these slides are Group Performance, Impression Performance, Digital Marketing. This is an immediately available PowerPoint presentation that can be conveniently customized. Download it and convince your audience.
-
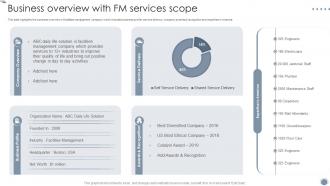 Business Overview With Fm Services Scope Global Facility Management Services
This slide highlights the business overview of facilities management company which includes business profile, service delivery, company awards and recognition and expertise in America. Deliver an outstanding presentation on the topic using this Business Overview With Fm Services Scope Global Facility Management Services. Dispense information and present a thorough explanation of Company Overview, Service Delivery, Awards And Recognition using the slides given. This template can be altered and personalized to fit your needs. It is also available for immediate download. So grab it now.
-
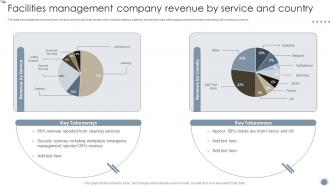 Facilities Management Company Revenue By Service And Country Global Facility Management
This slide showcases the revenue by service and country in pie chart format which includes cleaning, catering, security services, office support and technical services along with revenue by country. Deliver an outstanding presentation on the topic using this Facilities Management Company Revenue By Service And Country Global Facility Management. Dispense information and present a thorough explanation of Facilities Management, Company Revenue, Service And Country using the slides given. This template can be altered and personalized to fit your needs. It is also available for immediate download. So grab it now.
-
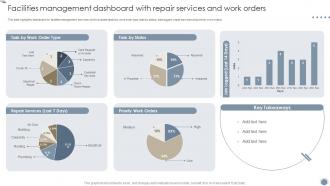 Facilities Management Dashboard With Repair Services And Work Orders Global Facility Management
This slide highlights dashboard for facilities management services which includes tasks by work order type, task by status, lobs logged, repair services and priority work orders. Deliver an outstanding presentation on the topic using this Facilities Management Dashboard With Repair Services And Work Orders Global Facility Management. Dispense information and present a thorough explanation of Facilities Management, Dashboard With Repair, Services And Work Orders using the slides given. This template can be altered and personalized to fit your needs. It is also available for immediate download. So grab it now.
-
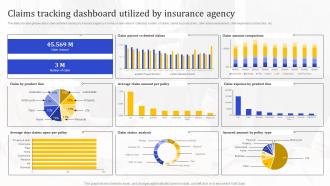 Claims Tracking Dashboard Utilized Insurance Agency Business Plan Overview
This slide provides glimpse about claim activities tracking by insurance agency in terms of claim amount collected, number of claims, claims by product line, claim status assessment, claim expense by product line, etc. Present the topic in a bit more detail with this Claims Tracking Dashboard Utilized Insurance Agency Business Plan Overview. Use it as a tool for discussion and navigation on Claim Payout, Claim Amount Comparison. This template is free to edit as deemed fit for your organization. Therefore download it now.
-
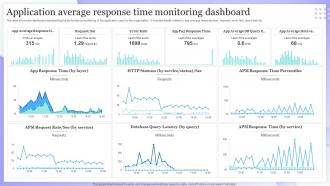 Application Average Response Time Monitoring Dashboard
This slide shows the dashboard representing the performance monitoring of the application used by the organization. It includes details related to app average response time, requests, error rate, query time etc. Introducing our Application Average Response Time Monitoring Dashboard set of slides. The topics discussed in these slides are App Response Time, Database Query Latency. This is an immediately available PowerPoint presentation that can be conveniently customized. Download it and convince your audience.
-
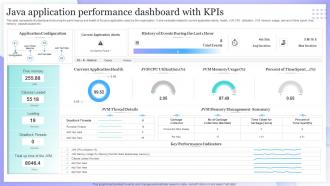 Java Application Performance Dashboard With Kpis
This slide represents the dashboard showing the performance and health of the java application used by the organization. It shows details related to current application alerts, health, JVM CPU utilization, JVM memory usage, percent of time spent, free memory, classes loaded etc. Introducing our Java Application Performance Dashboard With Kpis set of slides. The topics discussed in these slides are Current Application Health, Jvm Cpu Utilization. This is an immediately available PowerPoint presentation that can be conveniently customized. Download it and convince your audience.
-
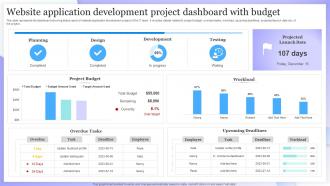 Website Application Development Project Dashboard With Budget
This slide represents the dashboard showing status report of website application development project of the IT team. It includes details related to project budget, overdue tasks, workload, upcoming deadlines, projected launch date etc. of the project. Presenting our well structured Website Application Development Project Dashboard With Budget. The topics discussed in this slide are Project Budget, Upcoming Deadlines. This is an instantly available PowerPoint presentation that can be edited conveniently. Download it right away and captivate your audience.
-
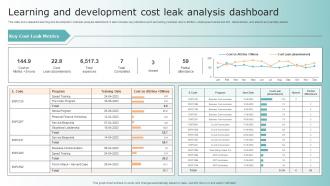 Learning And Development Cost Leak Analysis Dashboard
This slide showcases the learning and development cost leak analysis dashboard. It also includes key indicators such as training cost leak due to attrition, employees trained and left, absenteeism, and absent and partially absent. Introducing our Learning And Development Cost Leak Analysis Dashboard set of slides. The topics discussed in these slides are Speed Training, Nexus Program. This is an immediately available PowerPoint presentation that can be conveniently customized. Download it and convince your audience.
-
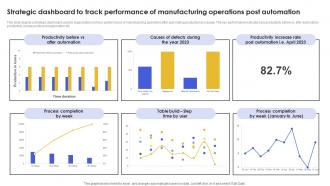 Strategic Dashboard To Track Performance Of Manufacturing Operations Post Automation
This slide depicts a strategic dashboard used by organizations to track performance of manufacturing operations after automating production processes. The key performance indicators are productivity before vs after automation, productivity increase rate post automation etc. Introducing our Strategic Dashboard To Track Performance Of Manufacturing Operations Post Automation set of slides. The topics discussed in these slides are Strategic, Performance, Automation. This is an immediately available PowerPoint presentation that can be conveniently customized. Download it and convince your audience.
-
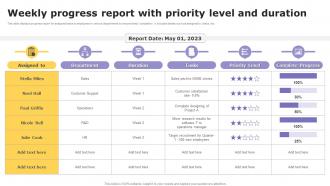 Weekly Progress Report With Priority Level And Duration
This slide displays progress report for assigned tasks to employees in various departments to ensure timely completion. It includes details such as assigned to, tasks, etc. Introducing our Weekly Progress Report With Priority Level And Duration set of slides. The topics discussed in these slides are Progress, Report, Priority. This is an immediately available PowerPoint presentation that can be conveniently customized. Download it and convince your audience.
-
 Determine B2b Account Management Dashboard Managing B2b Demand Generation
This slide provides information regarding B2B account management dashboard catering KPIs related to pipeline deals, landing page completion, email engagement, etc. Deliver an outstanding presentation on the topic using this Determine B2b Account Management Dashboard Managing B2b Demand Generation. Dispense information and present a thorough explanation of Marketing Pipeline Health, Revenue Campaign using the slides given. This template can be altered and personalized to fit your needs. It is also available for immediate download. So grab it now.
-
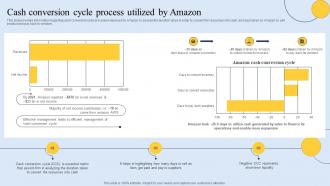 Cash Conversion Cycle Process Utilized By Amazon How Amazon Is Improving Revenues Strategy SS
This slide provides information regarding cash conversion cycle procedure deployed by Amazon to assess the duration taken in order to convert the resources into cash, and days taken by Amazon to sell product and pay back to vendors. Deliver an outstanding presentation on the topic using this Cash Conversion Cycle Process Utilized By Amazon How Amazon Is Improving Revenues Strategy SS. Dispense information and present a thorough explanation of Conversion, Process, Conversion using the slides given. This template can be altered and personalized to fit your needs. It is also available for immediate download. So grab it now.
-
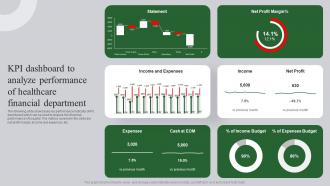 Kpi Dashboard To Analyze Performance Ultimate Guide To Healthcare Administration
The following slide showcases key performance indicator KPI dashboard which can be used to analyze the financial performance of hospital. The metrics covered in the slide are net profit margin, income and expenses, etc. Present the topic in a bit more detail with this Kpi Dashboard To Analyze Performance Ultimate Guide To Healthcare Administration. Use it as a tool for discussion and navigation on Statement, Net Profit Margin, Income Budget. This template is free to edit as deemed fit for your organization. Therefore download it now.
-
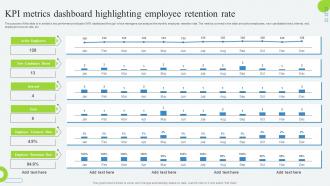 KPI Metrics Dashboard Highlighting Employee Retention Developing Employee Retention Program
The purpose of this slide is to exhibit a key performance indicator KPI dashboard through which managers can analyze the monthly employee retention rate. The metrics covered in the slide are active employees, new candidates hired, internal, exit, employee turnover rate, etc. Present the topic in a bit more detail with this KPI Metrics Dashboard Highlighting Employee Retention Developing Employee Retention Program. Use it as a tool for discussion and navigation on New Candidates Hired, Active Employees, Internal. This template is free to edit as deemed fit for your organization. Therefore download it now.
-
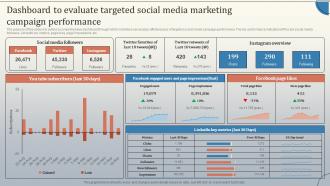 Dashboard To Evaluate Targeted Social Media Database Marketing Strategies MKT SS V
The purpose of this slide is to outline a comprehensive dashboard through which marketers can analyze effectiveness of targeted social media campaign performance. The key performance indicators KPIs are social media followers, LinkedIn key metrics, page likes, page impressions, etc. Present the topic in a bit more detail with this Dashboard To Evaluate Targeted Social Media Database Marketing Strategies MKT SS V. Use it as a tool for discussion and navigation on Social Media Followers, Instagram Overview. This template is free to edit as deemed fit for your organization. Therefore download it now.
-
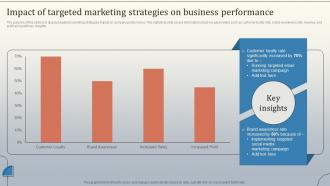 Impact Of Targeted Marketing Strategies On Database Marketing Strategies MKT SS V
The purpose of this slide is to display targeted marketing strategies impact on company performance. This statistical slide covers information about key parameters such as customer loyalty rate, brand awareness rate, revenue, and profit along with key insights. Deliver an outstanding presentation on the topic using this Impact Of Targeted Marketing Strategies On Database Marketing Strategies MKT SS V. Dispense information and present a thorough explanation of Customer Loyalty Rate, Brand Awareness Rate using the slides given. This template can be altered and personalized to fit your needs. It is also available for immediate download. So grab it now.
-
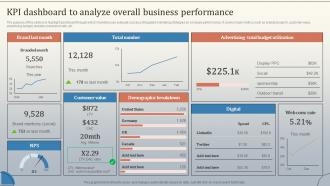 Kpi Dashboard To Analyze Overall Business Database Marketing Strategies MKT SS V
The purpose of this slide is to highlight dashboard through which marketers can evaluate success of targeted marketing strategies on company performance. It covers major metrics such as branded search, customer value, advertising budget, website conversion rate, etc. Present the topic in a bit more detail with this Kpi Dashboard To Analyze Overall Business Database Marketing Strategies MKT SS V. Use it as a tool for discussion and navigation on Brand Last Month, Total Number. This template is free to edit as deemed fit for your organization. Therefore download it now.
-
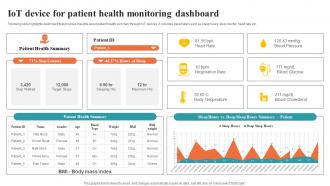 Iot Device For Patient Health Monitoring Dashboard Asset Tracking And Management IoT SS
Following slide highlights dashboard that provides insights about patient health summary through IoT devices. It includes parameters such as sleep hours, step counter, heart rate etc. Present the topic in a bit more detail with this Iot Device For Patient Health Monitoring Dashboard Asset Tracking And Management IoT SS. Use it as a tool for discussion and navigation on Patient Health Summary, Step Walked. This template is free to edit as deemed fit for your organization. Therefore download it now.
-
 Smart Attendance Tracking Systems Dashboard Asset Tracking And Management IoT SS
Following slide highlights dashboard to monitor and track student attendance by using Io enabled asset tracking devices. It includes indicators such as overtime, statistics, source, exceptions, pending requests, etc. Present the topic in a bit more detail with this Smart Attendance Tracking Systems Dashboard Asset Tracking And Management IoT SS. Use it as a tool for discussion and navigation on On Time Check In, Pending Requests. This template is free to edit as deemed fit for your organization. Therefore download it now.
-
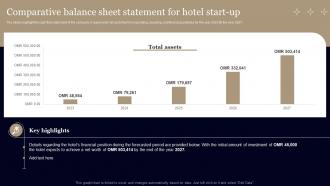 Business Plan For Hotel Comparative Balance Sheet Statement For Hotel Start Up BP SS
The slides highlight the cash flow statement of the company. It represents net cash flow from operating, investing, and financing activities for the year 2023 till the year 2027. Deliver an outstanding presentation on the topic using this Business Plan For Hotel Comparative Balance Sheet Statement For Hotel Start Up BP SS. Dispense information and present a thorough explanation of Great Travel Destination, Ideal Business Location, Gathering And Analyzing Data, Feasibility, Economy And Future Sustainability using the slides given. This template can be altered and personalized to fit your needs. It is also available for immediate download. So grab it now.
-
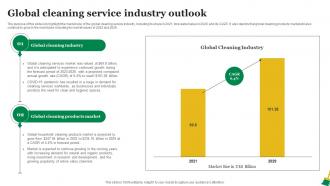 Residential Cleaning Business Plan Global Cleaning Service Industry Outlook BP SS
The purpose of this slide is to highlight the market size of the global cleaning service industry, including its share in 2021, forecasted value in 2029, and its CAGR. It also depicts that global cleaning products market will also continue to grow in the near future including its market values of 2022 and 2029. Present the topic in a bit more detail with this Residential Cleaning Business Plan Global Cleaning Service Industry Outlook BP SS. Use it as a tool for discussion and navigation on Global Cleaning Service Industry, Online Sales Channels, Clean And Hygienic Spaces. This template is free to edit as deemed fit for your organization. Therefore download it now.
-
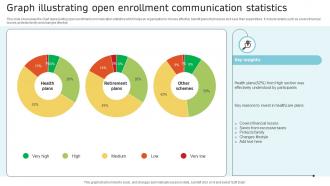 Graph Illustrating Open Enrollment Communication Statistics
This slide showcases the chart representing open enrollment communication statistics which helps an organization to choose effective benefit plans that reduce and save their expenditure. It include details such as covers financial losses, protects family and changes lifestyle. Presenting our well structured Graph Illustrating Open Enrollment Communication Statistics. The topics discussed in this slide are Health Plans, Retirement Plans. This is an instantly available PowerPoint presentation that can be edited conveniently. Download it right away and captivate your audience.
-
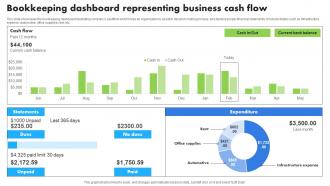 Bookkeeping Dashboard Representing Business Cash Flow
This slide showcases the bookkeeping dashboard illustrating companys cashflow which helps an organization to assist in decision making process and develop proper financial statements. It include details such as infrastructure expense, automotive, office supplies, rent, etc. Presenting our well structured Bookkeeping Dashboard Representing Business Cash Flow. The topics discussed in this slide are Expenditure. This is an instantly available PowerPoint presentation that can be edited conveniently. Download it right away and captivate your audience.
-
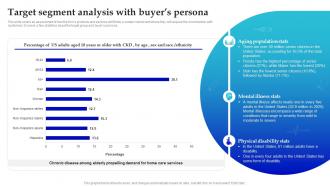 In Home Care Business Plan Target Segment Analysis With Buyers Persona BP SS
This slide covers an assessment of how the firms products and services will fit into a certain market and where they will acquire the most traction with customers. It covers a few statistics about the target group and buyers persona. Present the topic in a bit more detail with this In Home Care Business Plan Target Segment Analysis With Buyers Persona BP SS. Use it as a tool for discussion and navigation on Aging Population Stats, Mental Illness Stats, Physical Disability Stats, Target Segment Analysis. This template is free to edit as deemed fit for your organization. Therefore download it now.
-
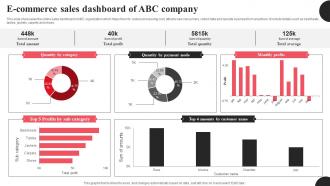 E Commerce Sales Dashboard Of ABC Company
This slide showcases the online sales dashboard of ABC organization which helps them to reduce processing cost, attracts new consumers, collect data and operate business from anywhere. It include details such as bedsheets, tables, jackets, carpets and shoes. Presenting our well structured E Commerce Sales Dashboard Of ABC Company. The topics discussed in this slide are Amount, Total, Quantity. This is an instantly available PowerPoint presentation that can be edited conveniently. Download it right away and captivate your audience.
-
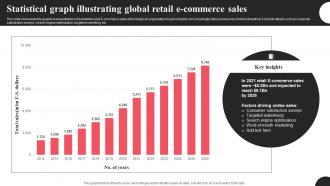 Statistical Graph Illustrating Global Retail E Commerce Sales
This slide showcases the graphical presentations of worldwide retail E commerce sales which helps an organization to gain insights over meaningful data and ensures minimal downtime. It include details such as consumer satisfaction surveys, search engine optimization, targeted marketing, etc. Presenting our well structured Statistical Graph Illustrating Global Retail E Commerce Sales. The topics discussed in this slide are Expected, Satisfaction, Marketing. This is an instantly available PowerPoint presentation that can be edited conveniently. Download it right away and captivate your audience.
-
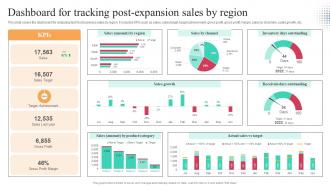 Dashboard For Tracking Post Expansion Sales By Region Worldwide Approach Strategy SS V
This slide covers the dashboard for analyzing fast food business sales by region. It includes KPIs such as sales, sales target, target achievement, gross profit, gross profit margin, sales by channels, sales growth, etc. Present the topic in a bit more detail with this Dashboard For Tracking Post Expansion Sales By Region Worldwide Approach Strategy SS V. Use it as a tool for discussion and navigation on Sales By Channel, Actual Sales Vs Target. This template is free to edit as deemed fit for your organization. Therefore download it now.
-
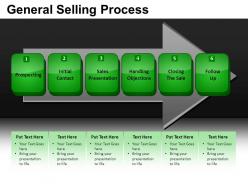 General selling process powerpoint presentation slides db
These high quality, editable pre-designed powerpoint slides and powerpoint templates have been carefully created by our professional team to help you impress your audience. Each graphic in every powerpoint slide is vector based and is 100% editable in powerpoint. Each and every property of any slide - color, size, shading etc can be modified to build an effective powerpoint presentation. Use these slides to convey complex business concepts in a simplified manner. Any text can be entered at any point in the powerpoint slide. Simply DOWNLOAD, TYPE and PRESENT!
-
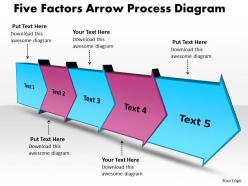 Ppt five factors arrow process swim lane diagram powerpoint template business templates 5 stages
Present processes and work flows in terms of PowerPoint arrow diagram. Use this Arrow slide for an effective illustration of trends and tendencies in your presentation.
-
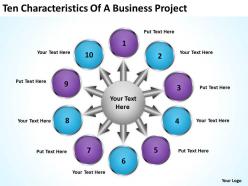 Business powerpoint presentations project cycle process diagram templates
This diagram can be used to show the relationship to a central idea in a cyclical progression. This slide helps you to give your team an overview of your capability and insight into the minute details of the overall picture highlighting the interdependence at every operational level.
-
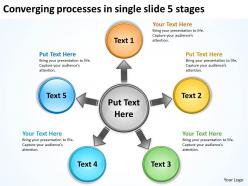 Converging processes single slide 5 stages cycle powerpoint slides
This is an excellent slide to detail and highlight your thought process, your views and your positive expectations. This diagram provides trainers a tool to teach the procedure in a highly visual, engaging way.
-
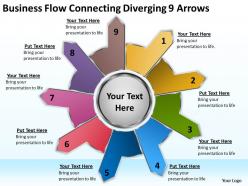 Powerpoint presentations flow connecting diverging 9 arrows charts and diagrams slides
This PowerPoint Diagram shows the connected pieces to describe the part of the process in circular Flow. It signifies Round, circular, beeline, continuous, even, horizontal, linear, nonstop, point-blank, right, shortest, though, true, unbroken etc.


