Finance PowerPoint Templates, Presentation Slide Diagrams & PPT Graphics
- Sub Categories
-
- 30 60 90 Day Plan
- Advertising
- Agile Development
- Aims and Objectives
- Arrows
- Before and After
- Blockchain Bitcoin
- Boxes
- Business
- Calender
- Case Study
- Celebrations
- Certificates
- Challenges Opportunities
- Channel Distribution
- Children
- Communication
- Competitive Landscape
- Computer
- Concepts
- Construction Management
- Corporate
- Crowdfunding
- Current State Future State
- Custom PowerPoint Diagrams
- Digital Transformation
- Dos and Donts
- Economics
- Education
- Environment
- Events
- Festival
- Finance
- Financials
- Food
- Game
- Gap Analysis
- Generic
- Geographical
- Health
- Heatmaps
- Holidays
- Icons
- Input Process Output
- Internet
- Key Messages
- Key Wins
- Ladder
- Leadership
- Lists
- Lucky Draw
- Management
- Marketing
- Measuring
- Medical
- Music
- News
- Next Steps
- People Process Technology
- Pillars
- Planning
- Post-it-Notes
- Problem Statement
- Process
- Proposal Management
- Pros and Cons
- Puzzle
- Puzzles
- Recruitment Strategy
- Religion
- Research and Development
- Risk Mitigation Strategies
- Roadmap
- Selling
- Shapes
- Short Term Long Term
- Social
- Stairs
- Start Stop Continue
- Strategy
- Symbol
- Technology
- Thesis Defense Dissertation
- Timelines
- Traffic
- Transition Plan
- Transportation
- Vehicles
- Venture Capital Funding
- Warning
- Winners
- Word Cloud
-
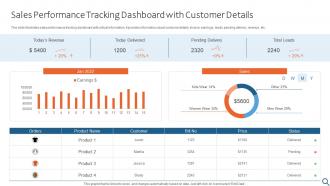 Sales Performance Tracking Dashboard With Customer Details
This slide illustrates sales performance tracking dashboard with critical information. It provides information about customer details, invoice, earnings, leads, pending delivery, revenue, etc. Presenting our well-structured Sales Performance Tracking Dashboard With Customer Details. The topics discussed in this slide are Sales Performance, Tracking Dashboard, Customer Details. This is an instantly available PowerPoint presentation that can be edited conveniently. Download it right away and captivate your audience.
-
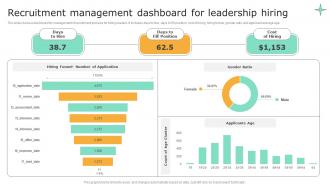 Recruitment Management Dashboard For Leadership Hiring
The slide shows a dashboard for management of recruitment process for hiring leaders. It includes days to hire, days to fill position, cost of hiring, hiring funnel, gender ratio and applicant average age. Introducing our Recruitment Management Dashboard For Leadership Hiring set of slides. The topics discussed in these slides are Recruitment Management Dashboard, Leadership Hiring. This is an immediately available PowerPoint presentation that can be conveniently customized. Download it and convince your audience.
-
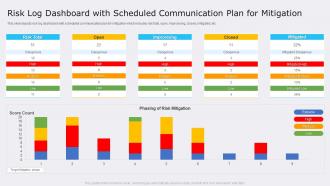 Risk Log Dashboard With Scheduled Communication Plan For Mitigation
This slide depicts risk log dashboard with scheduled communication plan for mitigation which includes risk total, open, improvising, closed, mitigated, etc. Introducing our Risk Log Dashboard With Scheduled Communication Plan For Mitigation set of slides. The topics discussed in these slides are Risk Log Dashboard, Scheduled Communication Plan, Mitigation. This is an immediately available PowerPoint presentation that can be conveniently customized. Download it and convince your audience.
-
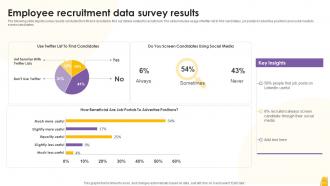 Employee Recruitment Data Survey Results
The following slide depicts survey results conducted for HR and recruited to find out details related to recruitment. The slide includes usage of twitter list to find candidates, job portals to advertise positions and social media to screen candidates. Introducing our Employee Recruitment Data Survey Results set of slides. The topics discussed in these slides are Employee Recruitment, Data Survey Results. This is an immediately available PowerPoint presentation that can be conveniently customized. Download it and convince your audience.
-
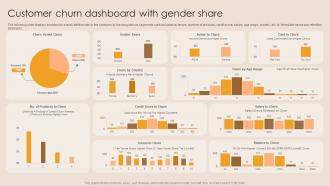 Customer Churn Dashboard With Gender Share
The following slide displays analytics for overall attrition rate in the company by tracking various segments such as balance, tenure, number of products, credit score, salary, age range, country, etc. to formulate necessary retention strategies. Presenting our well-structured Customer Churn Dashboard With Gender Share. The topics discussed in this slide are Customer Churn Dashboard, Gender Share . This is an instantly available PowerPoint presentation that can be edited conveniently. Download it right away and captivate your audience.
-
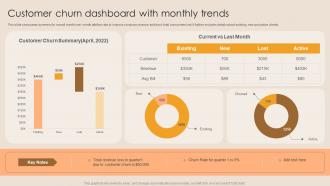 Customer Churn Dashboard Snapshot With Monthly Trends
This slide showcases summery for overall month over month attrition rate to improve company revenue and track total consumers lost. It further includes details about existing, new and active clients. Introducing our Customer Churn Dashboard Snapshot With Monthly Trends set of slides. The topics discussed in these slides are Customer Churn Dashboard, Monthly Trends. This is an immediately available PowerPoint presentation that can be conveniently customized. Download it and convince your audience.
-
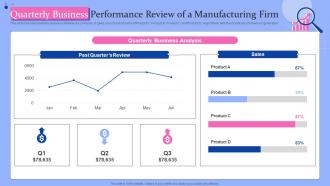 Quarterly Business Performance Review Of A Manufacturing Firm
This slide includes Quarterly Business Review of a company. It gives an account of sales of Product A, Product B, Product C and Product D, respectively with trend analysis of revenues generated. Introducing our Quarterly Business Performance Review Of A Manufacturing Firm set of slides. The topics discussed in these slides are Quarterly, Business Performance Review, Manufacturing Firm. This is an immediately available PowerPoint presentation that can be conveniently customized. Download it and convince your audience.
-
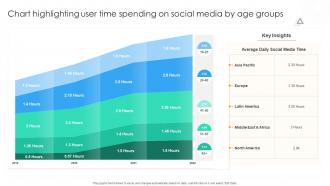 Chart Highlighting User Time Spending On Social Media By Age Groups
Introducing our Chart Highlighting User Time Spending On Social Media By Age Groups set of slides. The topics discussed in these slides are Chart Highlighting User, Time Spending, Social Media, By Age Groups. This is an immediately available PowerPoint presentation that can be conveniently customized. Download it and convince your audience.
-
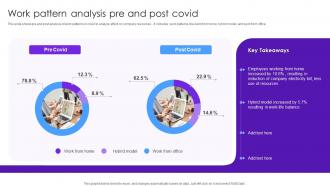 Work Pattern Analysis Pre And Post Covid
This slide shows pre and post analysis of work patterns in covid to analyze effect on company resources. It includes work patterns like work from home, hybrid model, and work from office. Introducing our Work Pattern Analysis Pre And Post Covid set of slides. The topics discussed in these slides are Pre Covid, Post Covid. This is an immediately available PowerPoint presentation that can be conveniently customized. Download it and convince your audience.
-
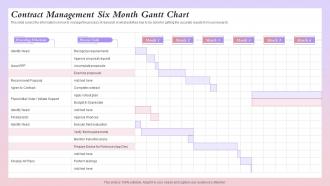 Contract Management Six Month Gantt Chart
This slide covers the information on how to manage the process of research or what activities has to be done for getting the accurate results form our research. Introducing our Contract Management Six Month Gantt Chart that is designed to showcase some of the vital components that will help you create timelines, roadmaps, and project plans. In addition, also communicate your project durations, milestones, tasks, subtasks, dependencies, and other attributes using this well-structured Contract Management Six Month Gantt Chart template. You can also exhibit preeminence against time by deploying this easily adaptable slide to your business presentation. Our experts have designed this template in such a way that it is sure to impress your audience. Thus, download it and steer your project meetings, meetups, and conferences.
-
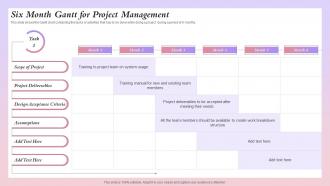 Six Month Gantt For Project Management
This slide shows the Gantt chart containing the tasks or activities that has to be done while doing a project during a period of 6 months. Your complex projects can be managed and organized simultaneously using this detailed Six Month Gantt For Project Management template. Track the milestones, tasks, phases, activities, and subtasks to get an updated visual of your project. Share your planning horizon and release plan with this well-crafted presentation template. This exemplary template can be used to plot various dependencies to distinguish the tasks in the pipeline and their impact on the schedules and deadlines of the project. Apart from this, you can also share this visual presentation with your team members and stakeholders. It a resourceful tool that can be incorporated into your business structure. Therefore, download and edit it conveniently to add the data and statistics as per your requirement.
-
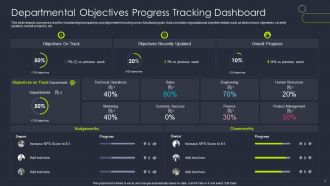 Departmental Objectives Progress Tracking Dashboard
This slide depicts a progress chart for maintaining transparency and alignment in tracking cross-functional goals. It also includes organizational objective details such as total on track objectives, recently updated, overall progress, etc. Introducing our Departmental Objectives Progress Tracking Dashboard set of slides. The topics discussed in these slides are Departmental Objectives Progress, Tracking Dashboard. This is an immediately available PowerPoint presentation that can be conveniently customized. Download it and convince your audience.
-
 Social Media Survey Result Reporting
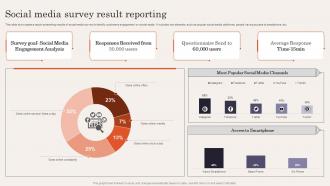
This slide showcases a report presenting results of social media survey to identify customers engagement on social media. It includes key elements such as popular social media platforms, people having access to smartphone, etc. Introducing our Social Media Survey Result Reporting set of slides. The topics discussed in these slides are Social Media Channels, Access To Smartphone, Social Media Engagement Analysis. This is an immediately available PowerPoint presentation that can be conveniently customized. Download it and convince your audience.
-
 Quality Assurance Testing Tools For Process Automation
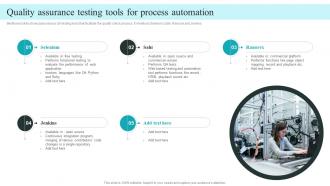
Mentioned slide showcases various QA testing tools that facilitate the quality check process. It mentions Selenium, Sahi, Ranorex and Jenkins.Presenting our well structured Quality Assurance Testing Tools For Process Automation. The topics discussed in this slide are Performs Functional, Evaluate Performance, Continuous Integration. This is an instantly available PowerPoint presentation that can be edited conveniently. Download it right away and captivate your audience.
-
 KPI Dashboard To Track Performance Of Order To Cash Process
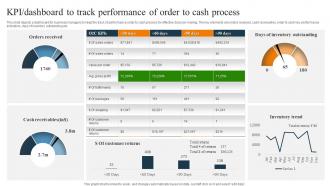
This slide depicts a dashboard for business managers to keep the track of performance order to cash process for effective decision making. The key elements are orders received, cash receivables, order to cash key performance indicators, days of inventory outstanding etc. Introducing our KPI Dashboard To Track Performance Of Order To Cash Process set of slides. The topics discussed in these slides are Days Of Inventory Outstanding, Inventory Trend, Customer Returns. This is an immediately available PowerPoint presentation that can be conveniently customized. Download it and convince your audience.
-
 Independent Feature Film Production Budget Breakdown
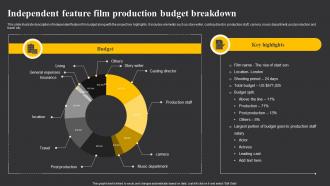
This slide illustrate description of independent feature film budget along with the project key highlights. It includes elements such as story writer, casting director, production staff, camera, music department, post production and travel etc. Introducing our Independent Feature Film Production Budget Breakdown set of slides. The topics discussed in these slides are General Expenses, Casting Director, Production Staff. This is an immediately available PowerPoint presentation that can be conveniently customized. Download it and convince your audience.
-
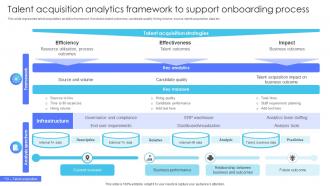 Talent Acquisition Analytics Framework To Multiple Brands Launch Strategy
This slide represents talent acquisition analytics framework. It includes talent outcomes, candidate quality, hiring volume, source, talent acquisition data etc.Present the topic in a bit more detail with this Talent Acquisition Analytics Framework To Multiple Brands Launch Strategy. Use it as a tool for discussion and navigation on Talent Outcomes, Candidate Quality, Acquisition Strategies. This template is free to edit as deemed fit for your organization. Therefore download it now.
-
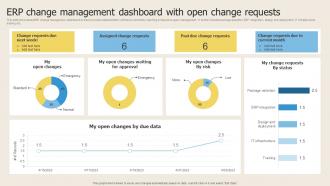 ERP Change Management Dashboard With Open Change Requests
This slide showcases ERP change management dashboard to track process implementation efficiency and timely reporting of issues to upper management. It further includes package selection, ERP integration, design and deployment, IT infrastructure, training etc. Presenting our well structured ERP Change Management Dashboard With Open Change Requests. The topics discussed in this slide are Changes Waiting, Changes By Risk, Change Requests By Status. This is an instantly available PowerPoint presentation that can be edited conveniently. Download it right away and captivate your audience.
-
 Dashboard For Monitoring Project Team Productivity Report
This slide depicts a dashboard for monitoring team productivity reports in project management. It covers various areas such as billing by the consumer, productivity reports, employee billable hours, etc. Presenting our well structured Dashboard For Monitoring Project Team Productivity Report. The topics discussed in this slide are Profitability By Customer, Profitability By Task, Summary By Customer. This is an instantly available PowerPoint presentation that can be edited conveniently. Download it right away and captivate your audience.
-
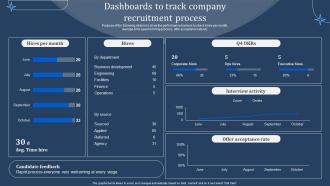 Dashboards To Track Company Recruitment Process Manpower Optimization Methods
Purpose of the following slide is to show the performance trackers to check hires per month, average time spent in hiring process, offer acceptance rate etc. Present the topic in a bit more detail with this Dashboards To Track Company Recruitment Process Manpower Optimization Methods. Use it as a tool for discussion and navigation on Business Development, Interview Activity, Offer Acceptance Rate. This template is free to edit as deemed fit for your organization. Therefore download it now.
-
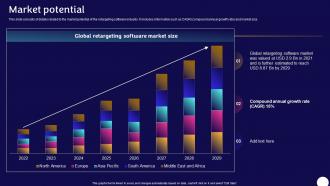 Brand Awareness Platform Investor Funding Market Potential
This slide consists of details related to the market potential of the retargeting software industry. It includes information such as CAGR compound annual growth rate and market size. Present the topic in a bit more detail with this Brand Awareness Platform Investor Funding Market Potential. Use it as a tool for discussion and navigation on Market Potential, Compound Annual Growth Rate, Global Retargeting Software. This template is free to edit as deemed fit for your organization. Therefore download it now.
-
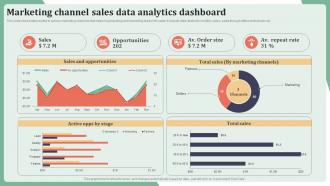 Marketing Channel Sales Data Analytics Dashboard
This slide shows data related to various marketing channels that helps in generating and converting leads into sales. It include data related to monthly sales, sales through different channels etc. Presenting our well structured Marketing Channel Sales Data Analytics Dashboard. The topics discussed in this slide are Sales And Opportunities, Total Sales, Marketing Channels. This is an instantly available PowerPoint presentation that can be edited conveniently. Download it right away and captivate your audience.
-
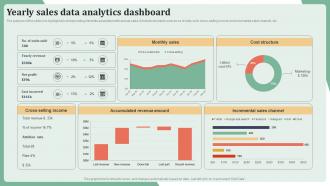 Yearly Sales Data Analytics Dashboard
The purpose of this slide is to highlight all corresponding elements associated with annual sales. It include elements such as no of units sold, cross selling income and incremental sales channel, etc. Presenting our well structured Yearly Sales Data Analytics Dashboard. The topics discussed in this slide are Monthly Sales, Cost Structure, Accumulated Revenue. This is an instantly available PowerPoint presentation that can be edited conveniently. Download it right away and captivate your audience.
-
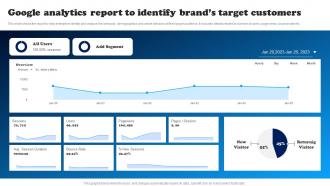 Google Analytics Report To Identify Brands Target Data Driven Decision Making To Build MKT SS V
This slide shows the report to help enterprise identify and analyze the behavior, demographics and online behavior of their target audience. It includes details related to number of users, page views, bounce rate etc. Deliver an outstanding presentation on the topic using this Google Analytics Report To Identify Brands Target Data Driven Decision Making To Build MKT SS V. Dispense information and present a thorough explanation of Analytics, Report, Target using the slides given. This template can be altered and personalized to fit your needs. It is also available for immediate download. So grab it now.
-
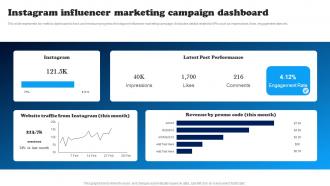 Instagram Influencer Marketing Campaign Dashboard Data Driven Decision Making To Build MKT SS V
This slide represents key metrics dashboard to track and measure progress of Instagram influencer marketing campaign. It includes details related to KPIs such as impressions, likes, engagement rates etc. Present the topic in a bit more detail with this Instagram Influencer Marketing Campaign Dashboard Data Driven Decision Making To Build MKT SS V. Use it as a tool for discussion and navigation on Influencer, Marketing, Campaign. This template is free to edit as deemed fit for your organization. Therefore download it now.
-
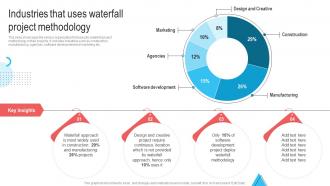 Industries That Uses Waterfall Project Methodology Waterfall Project Management
This slide showcases the various organization that execute waterfall project methodology in their projects. It includes industries such as construction, manufacturing, agencies, software development and marketing etc. Present the topic in a bit more detail with this Industries That Uses Waterfall Project Methodology Waterfall Project Management. Use it as a tool for discussion and navigation on Creative Project, Software Development, Waterfall Methodology. This template is free to edit as deemed fit for your organization. Therefore download it now.
-
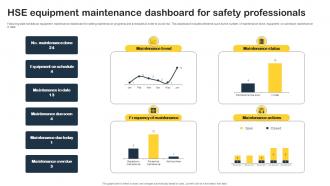 HSE Equipment Maintenance Dashboard For Safety Professionals
Following slide exhibits an equipment maintenance dashboard for setting maintenance programs and schedules in order to avoid risk. This dashboard includes elements such as the number of maintenance done, equipment on schedule, maintenance in date. Introducing our HSE Equipment Maintenance Dashboard For Safety Professionals set of slides. The topics discussed in these slides are Maintenance Trend, Maintenance Status, Frequency Of Maintenance. This is an immediately available PowerPoint presentation that can be conveniently customized. Download it and convince your audience.
-
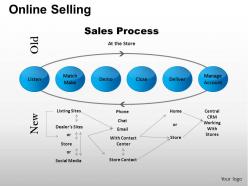 Online selling powerpoint presentation slides
These high quality, editable pre-designed powerpoint slides and powerpoint templates have been carefully created by our professional team to help you impress your audience. Each graphic in every powerpoint slide is vector based and is 100% editable in powerpoint. Each and every property of any slide - color, size, shading etc can be modified to build an effective powerpoint presentation. Use these slides to convey complex business concepts in a simplified manner. Any text can be entered at any point in the powerpoint slide. Simply DOWNLOAD, TYPE and PRESENT!
-
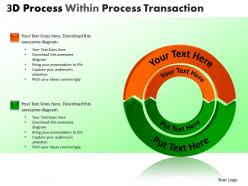 3d process within process transaction powerpoint slides and ppt templates db
These high quality, editable pre-designed powerpoint slides and powerpoint templates have been carefully created by our professional team to help you impress your audience. Each graphic in every powerpoint slide is vector based and is 100% editable in powerpoint.Each and every property of any slide - color, size, shading etc can be modified to build an effective powerpoint presentation. Use these slides to convey complex business concepts in a simplified manner. Any text can be entered at any point in the powerpoint slide. Simply DOWNLOAD, TYPE and PRESENT
-
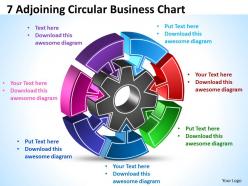 7 adjoining circular business chart powerpoint templates ppt presentation slides 812
Analyze the seven success factors of your business with this circular business chart for Microsoft PowerPoint presentations
-
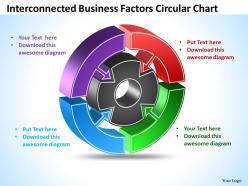 Interconnected business factors circular chart powerpoint templates ppt presentation slides 812
This kind of charts can show the dependencies among parts of an organization or process.
-
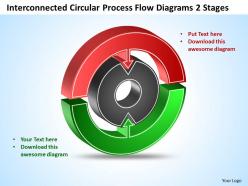 Interconnected circular process flow diagrams 2 stages templates ppt presentation slides 812
The circular-flow diagram is a visual model of the economy that shows how dollars flow through markets among households and firms
-
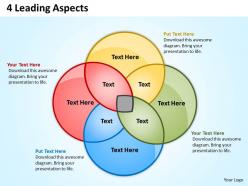 4 leading aspects powerpoint slides presentation diagrams templates
We are proud to present our 4 leading aspects powerpoint slides presentation diagrams templates. This PowerPoint diagram contains an image of four circles shown by venn style. The process of this diagram is part of business strategy. It is used for a broad range of informal and formal descriptions to represent core aspects of a business, including purpose, offerings, strategies, infrastructure, organizational structures, trading practices, and operational processes and policies.
-
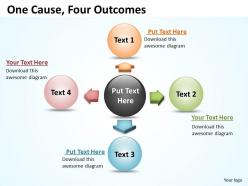 One cause four outcomes ppt slides presentation diagrams templates
We are proud to present our one cause four outcomes ppt slides presentation diagrams templates. Cause and effect diagram is a tool that helps identify, sort and display possible causes of a specific problem or quality characteristic. This diagram can be used to analyze existing problems so that corrective action can be taken.
-
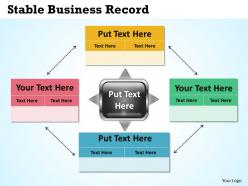 Stable business record powerpoint slides presentation diagrams templates
We are proud to present our stable business record powerpoint slides presentation diagrams templates. This PowerPoint diagram attempts to measure and provide feedback to organizations in order to assist in implementing strategies and objectives. This diagram is used to convey concepts regarding strategic performance management, Key Performance Indicators, Corporate governance and Business management systems.
-
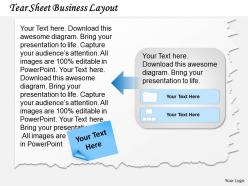 0314 business ppt diagram tear sheet business layout powerpoint template
We are proud to present our 0314 business ppt diagram tear sheet business layout powerpoint template. Conjure up grand ideas with our magical 0314 Business Ppt Diagram Tear Sheet Business Layout Powerpoint Template. Leave everyone awestruck by the end of your presentation. Bubbling and bursting with ideas are you. Let our management give them the shape for you.
-
 0814 business consulting smiley star with golden coins for finance powerpoint slide template
We are proud to present our 0814 business consulting smiley star with golden coins for finance powerpoint slide template. This image slide displays business consulting diagram of smiley star with golden coins for finance. This image slide has been designed with graphic of colorful smiley star and golden coins. Text space is also provided on side. This image slide is 100percent editable. Use this PowerPoint template, in your presentations to explain concepts of finance and monetary polices. May also be used in education related presentations. This image slide make your presentations eye catching.
-
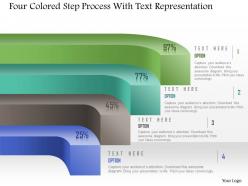 1214 four colored step process with text representation powerpoint template
We are proud to present our 1214 four colored step process with text representation powerpoint template. Four colored step process diagram has been used to craft this power point template. This PPT contains the concept of process flow. Use this PPT for your business and marketing related presentations and make your viewers happy.
-
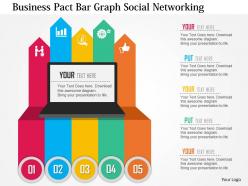 Business pact bar graph social networking flat powerpoint design
We are proud to present our business pact bar graph social networking flat powerpoint design. Concept of social networking and its effect on business network can be explained with this PPT diagram. This PPT diagram contains the graphic of bar graph. Use this PPT diagram for business and marketing related presentations.
-
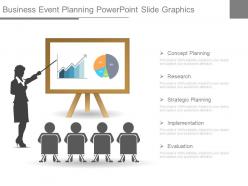 Business event planning powerpoint slide graphics
These can be included in your presentation to change its overall appearance. They have A-one quality to put an astounding impact on the audience. They allow easy tailoring of the components. They propose accurate message. They display professionalism and are result oriented.The stages in this process are concept planning, research, strategic planning, implementation, evaluation.
-
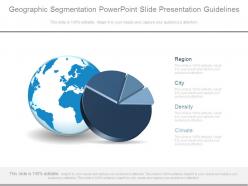 Geographic segmentation powerpoint slide presentation guidelines
Presenting geographic segmentation powerpoint slide presentation guidelines. This is a geographic segmentation powerpoint slide presentation guidelines. This is a two stage process. The stages in this process are region, city, density, climate.
-
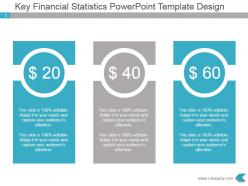 Key financial statistics powerpoint template design
Presenting key financial statistics powerpoint template design. Presenting key financial statistics powerpoint template design. Presenting key financial statistics powerpoint template design. Presenting key financial statistics powerpoint template design. Presenting key financial statistics powerpoint template design. This is a key financial statistics powerpoint template design. This is a three stage process. The stages in this process are key financial, statistics, business, strategy, management, marketing.
-
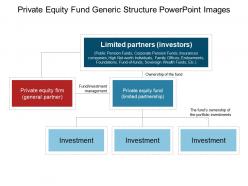 Private equity fund generic structure powerpoint images
Presenting private equity fund generic structure powerpoint images. This is a private equity fund generic structure powerpoint images. This is a three stage process. The stages in this process are investment, venture capital, funding, private equity.
-
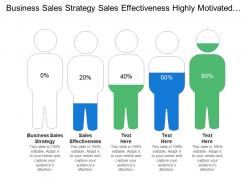 Business sales strategy sales effectiveness highly motivated sales process
Presenting this set of slides with name - Business Sales Strategy Sales Effectiveness Highly Motivated Sales Process. This is an editable five stages graphic that deals with topics like Business Sales Strategy, Sales Effectiveness, Highly Motivated, Sales Process to help convey your message better graphically. This product is a premium product available for immediate download, and is 100 percent editable in Powerpoint. Download this now and use it in your presentations to impress your audience.
-
 Revenue bridge example of ppt slide
Presenting this set of slides with name - Revenue Bridge Example Of Ppt Slide. This is a five stage process. The stages in this process are Revenue Bridge, Income Bridge, Earnings Bridge.
-
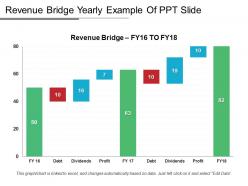 Revenue bridge yearly example of ppt slide
Presenting the revenue presentation template for PowerPoint. This presentation design is fully modifiable and is designed by professionals looking for an impressive presentation design. You can personalize the objects in the slide like font size and font color without going through any fuss. This presentation slide is fully compatible with Google Slide and can be saved in JPG or PDF file format easily. Click on the download button below.
-
 Estimate icons powerpoint presentation examples
Presenting this set of slides with name - Estimate Icons Powerpoint Presentation Examples. This is a three stage process. The stages in this process are Estimate, Guess, Evaluate.
-
 Bank as financial services icon
Presenting this set of slides with name Bank As Financial Services Icon. This is a four process. The stages in this process are stages Financial Service, Investment, Analysis. This is a completely editable PowerPoint presentation and is available for immediate download. Download now and impress your audience.
-
 Stock Pitch Pet Care Products Powerpoint Presentation Slides
Our Stock Pitch Pet Care Products Powerpoint Presentation Slides is the perfect way to pitch your stock. We have researched thousands of stock pitches and designed the most impactful way to convince your investors to invest in your equity.
-
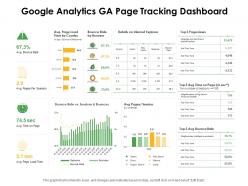 Google analytics ga page tracking dashboard ppt powerpoint presentation inspiration infographics
Presenting this set of slides with name Google Analytics GA Page Tracking Dashboard Ppt Powerpoint Presentation Inspiration Infographics. The topics discussed in these slides are Time, Internet Explorer, Session. This is a completely editable PowerPoint presentation and is available for immediate download. Download now and impress your audience.
-
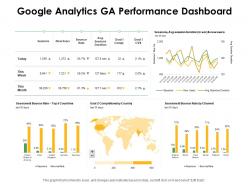 Google analytics ga performance dashboard ppt powerpoint presentation layouts backgrounds
Presenting this set of slides with name Google Analytics GA Performance Dashboard Ppt Powerpoint Presentation Layouts Backgrounds. The topics discussed in these slides are Duration, Completions By Country, Goal. This is a completely editable PowerPoint presentation and is available for immediate download. Download now and impress your audience.
-
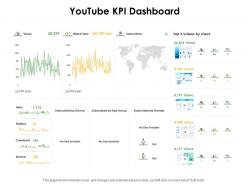 Youtube kpi dashboard ppt powerpoint presentation example
Presenting this set of slides with name Youtube KPI Dashboard Ppt Powerpoint Presentation Example. The topics discussed in these slides are Data Available, Comments, Time. This is a completely editable PowerPoint presentation and is available for immediate download. Download now and impress your audience.
-
 Zendesk support team performance dashboard ppt powerpoint presentation icon aids
Presenting this set of slides with name Zendesk Support Team Performance Dashboard Ppt Powerpoint Presentation Icon Aids. The topics discussed in these slides are Sales Enquiry, Net Promoter Score, Promoters. This is a completely editable PowerPoint presentation and is available for immediate download. Download now and impress your audience.
-
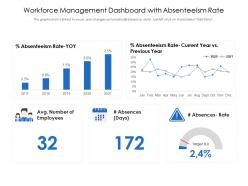 Workforce management dashboard with absenteeism rate
Presenting our well-structured Workforce Management Dashboard With Absenteeism Rate. The topics discussed in this slide are Workforce Management Dashboard With Absenteeism Rate. This is an instantly available PowerPoint presentation that can be edited conveniently. Download it right away and captivate your audience.
-
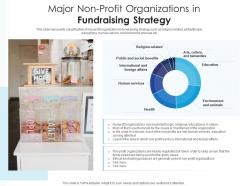 Major non profit organizations in fundraising strategy
This slide represents classification of non profit organization in fundraising strategy such as religion related, philanthropic, educations, human service, environment and animals etc. Introducing our Major Non Profit Organizations In Fundraising Strategy set of slides. The topics discussed in these slides are Human Services, Environment And Animals, Education, Social Benefits, Humanities. This is an immediately available PowerPoint presentation that can be conveniently customized. Download it and convince your audience.
-
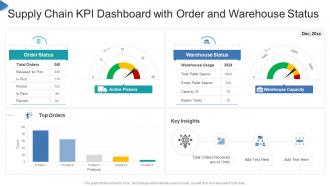 Supply chain kpi dashboard with order and warehouse status
Introducing our Supply Chain KPI Dashboard With Order And Warehouse Status set of slides. The topics discussed in these slides are Supply Chain KPI Dashboard With Order And Warehouse Status. This is an immediately available PowerPoint presentation that can be conveniently customized. Download it and convince your audience.
-
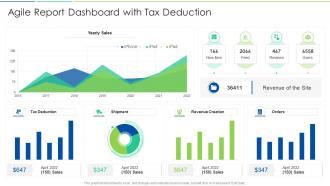 Agile report dashboard with tax deduction
Presenting our well-structured Agile Report Dashboard With Tax Deduction. The topics discussed in this slide are Agile Report Dashboard With Tax Deduction. This is an instantly available PowerPoint presentation that can be edited conveniently. Download it right away and captivate your audience.
-
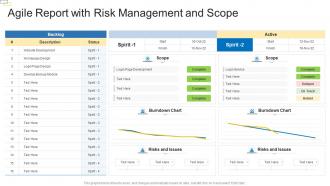 Agile report with risk management and scope
Presenting our well-structured Agile Report With Risk Management And Scope. The topics discussed in this slide are Agile Report With Risk Management And Scope. This is an instantly available PowerPoint presentation that can be edited conveniently. Download it right away and captivate your audience.
-
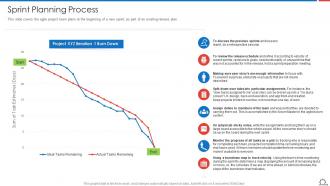 Sprint Planning Process Agile Methodologies And Frameworks Ppt Inspiration
This slide covers the agile project team plans at the beginning of a new sprint, as part of an existing release plan. Present the topic in a bit more detail with this Sprint Planning Process Agile Methodologies And Frameworks Ppt Inspiration. Use it as a tool for discussion and navigation on Sprint Planning Process. This template is free to edit as deemed fit for your organization. Therefore download it now.
-
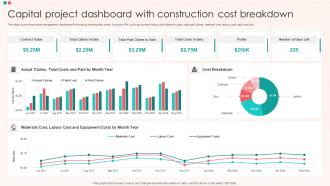 Capital Project Dashboard With Construction Cost Breakdown
This slide covers the project management dashboard for tracking construction costs. It include KPIs such as contract value, total claims to date, total paid claims, material cost, labour cost, paid cost, etc. Presenting our well-structured Capital Project Dashboard With Construction Cost Breakdown. The topics discussed in this slide are Capital Project Dashboard, Construction Cost Breakdown. This is an instantly available PowerPoint presentation that can be edited conveniently. Download it right away and captivate your audience.


