Finance PowerPoint Templates, Presentation Slide Diagrams & PPT Graphics
- Sub Categories
-
- 30 60 90 Day Plan
- Advertising
- Agile Development
- Aims and Objectives
- Arrows
- Before and After
- Blockchain Bitcoin
- Boxes
- Business
- Calender
- Case Study
- Celebrations
- Certificates
- Challenges Opportunities
- Channel Distribution
- Children
- Communication
- Competitive Landscape
- Computer
- Concepts
- Construction Management
- Corporate
- Crowdfunding
- Current State Future State
- Custom PowerPoint Diagrams
- Digital Transformation
- Dos and Donts
- Economics
- Education
- Environment
- Events
- Festival
- Finance
- Financials
- Food
- Game
- Gap Analysis
- Generic
- Geographical
- Health
- Heatmaps
- Holidays
- Icons
- Input Process Output
- Internet
- Key Messages
- Key Wins
- Ladder
- Leadership
- Lists
- Lucky Draw
- Management
- Marketing
- Measuring
- Medical
- Music
- News
- Next Steps
- People Process Technology
- Pillars
- Planning
- Post-it-Notes
- Problem Statement
- Process
- Proposal Management
- Pros and Cons
- Puzzle
- Puzzles
- Recruitment Strategy
- Religion
- Research and Development
- Risk Mitigation Strategies
- Roadmap
- Selling
- Shapes
- Short Term Long Term
- Social
- Stairs
- Start Stop Continue
- Strategy
- Symbol
- Technology
- Thesis Defense Dissertation
- Timelines
- Traffic
- Transition Plan
- Transportation
- Vehicles
- Venture Capital Funding
- Warning
- Winners
- Word Cloud
-
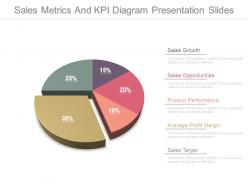 Sales metrics and kpi diagram presentation slides
Presenting sales metrics and kpi diagram presentation slides. This is a sales metrics and kpi diagram presentation slides. This is a five stage process. The stages in this process are sales growth, sales opportunities, product performance, average profit margin, sales target.
-
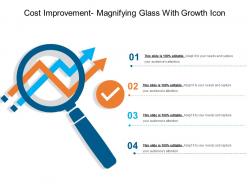 Cost improvement magnifying glass with growth icon
Presenting cost improvement magnifying glass with growth icon. This is a cost improvement magnifying glass with growth icon. This is a four stage process. The stages in this process are cost improvement, cost reduction, budget improvement.
-
 Budget forecast with bag of dollar
Presenting this set of slides with name - Budget Forecast With Bag Of Dollar. This is a one stage process. The stages in this process are Budget Forecast, Forecast Vs Actual Budget, Plan Vs Forecast.
-
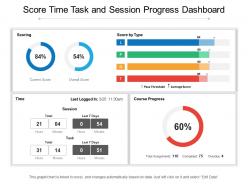 Score time task and session progress dashboard
Presenting this set of slides with name Score Time Task And Session Progress Dashboard. The topics discussed in these slides are Progress Dashboard, Chart And Graph, Finance, Marketing. This is a completely editable PowerPoint presentation and is available for immediate download. Download now and impress your audience.
-
 Piggy bank with dollar icon for savings
Presenting this set of slides with name Piggy Bank With Dollar Icon For Savings. This is a three stage process. The stages in this process are Piggy Bank With Dollar Icon For Savings. This is a completely editable PowerPoint presentation and is available for immediate download. Download now and impress your audience.
-
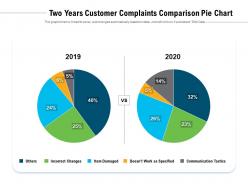 Two years customer complaints comparison pie chart
Presenting this set of slides with name Two Years Customer Complaints Comparison Pie Chart. The topics discussed in these slides are Two Years, Customer Complaints, Comparison Pie Chart. This is a completely editable PowerPoint presentation and is available for immediate download. Download now and impress your audience.
-
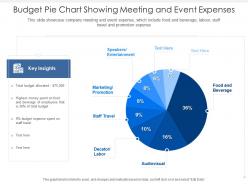 Budget pie chart showing meeting and event expenses
This slide showcase company meeting and event expense, which include food and beverage, labour, staff travel and promotion expense. Introducing our Budget Pie Chart Showing Meeting And Event Expenses set of slides. The topics discussed in these slides are Budget Pie Chart Showing Meeting And Event Expenses. This is an immediately available PowerPoint presentation that can be conveniently customized. Download it and convince your audience.
-
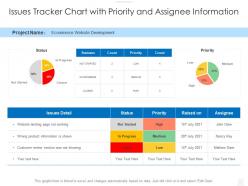 Issues tracker chart with priority and assignee information
Introducing our Issues Tracker Chart With Priority And Assignee Information set of slides. The topics discussed in these slides are Issues Tracker Chart With Priority And Assignee Information. This is an immediately available PowerPoint presentation that can be conveniently customized. Download it and convince your audience.
-
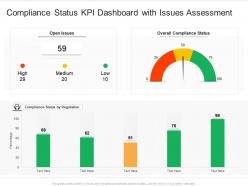 Compliance status kpi dashboard with issues assessment
Introducing our Compliance Status KPI Dashboard With Issues Assessment set of slides. The topics discussed in these slides are Compliance Status KPI Dashboard With Issues Assessment. This is an immediately available PowerPoint presentation that can be conveniently customized. Download it and convince your audience.
-
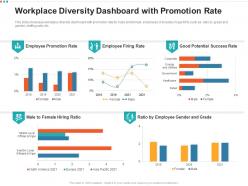 Workplace diversity dashboard with promotion rate
This slide showcase workplace diversity dashboard with promotion rate for male and female employees. It includes major KPIs such as ratio by grade and gender, staffing ratio etc. Introducing our Workplace Diversity Dashboard With Promotion Rate set of slides. The topics discussed in these slides are Workplace Diversity Dashboard With Promotion Rate. This is an immediately available PowerPoint presentation that can be conveniently customized. Download it and convince your audience.
-
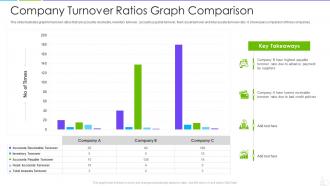 Company turnover ratios graph comparison
Introducing our Company Turnover Ratios Graph Comparison set of slides. The topics discussed in these slides are Company Turnover Ratios Graph Comparison. This is an immediately available PowerPoint presentation that can be conveniently customized. Download it and convince your audience.
-
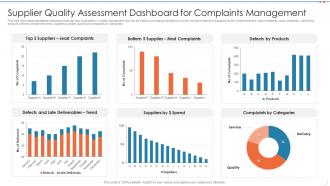 Supplier quality assessment dashboard for complaints management
Introducing our Supplier Quality Assessment Dashboard For Complaints Management set of slides. The topics discussed in these slides are Supplier Quality Assessment Dashboard For Complaints Management. This is an immediately available PowerPoint presentation that can be conveniently customized. Download it and convince your audience.
-
 How to manage accounts to drive sales developing account based scoring
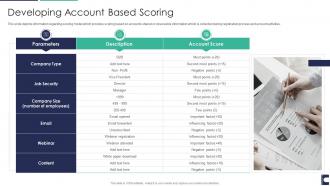
This slide depicts information regarding scoring model which provides scoring based on accounts shared or observable information which is collected during registration process and account activities. Increase audience engagement and knowledge by dispensing information using How To Manage Accounts To Drive Sales Developing Account Based Scoring. This template helps you present information on one stages. You can also present information on Parameters, Account Score, Content, Webinar using this PPT design. This layout is completely editable so personaize it now to meet your audiences expectations.
-
 Implementing Employee Engagement Employee Engagement Performance Dashboard With Participation
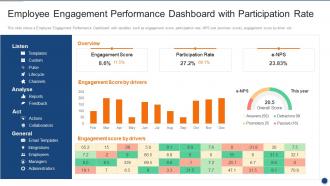
This slide shows a Employee Engagement Performance Dashboard with variables such as engagement score, participation rate, NPS net promoter score, engagement score by driver etc. Present the topic in a bit more detail with this Implementing Employee Engagement Employee Engagement Performance Dashboard With Participation. Use it as a tool for discussion and navigation on Overview, Engagement Score, Participation Rate, Engagement Score By Drivers. This template is free to edit as deemed fit for your organization. Therefore download it now.
-
 Automating Sales Processes To Improve Revenues Digital Marketing Metrics To Monitor Sales
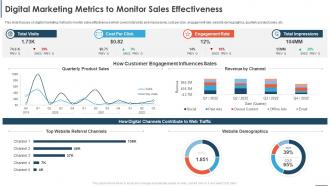
This slide focuses on digital marketing metrics to monitor sales effectiveness which covers total visits and impressions, cost per click, engagement rate, website demographics, quarterly product sales, etc. Deliver an outstanding presentation on the topic using this Automating Sales Processes To Improve Revenues Digital Marketing Metrics To Monitor Sales. Dispense information and present a thorough explanation of Cost Per Click, Engagement Rate, Total Impressions, Total Visits using the slides given. This template can be altered and personalized to fit your needs. It is also available for immediate download. So grab it now.
-
 KPI Dashboard To Track Performance Of Quality Management System
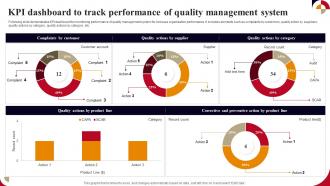
Following slide demonstrates KPI dashboard for monitoring performance of quality management system for increase organisation performance. It includes elements such as complaints by customers, quality action by suppliers, quality actions by category, quality actions by category, etc. Presenting our well structured KPI Dashboard To Track Performance Of Quality Management System The topics discussed in this slide are Complaints By Customer, Quality Actions By Supplier, Quality Actions By Category This is an instantly available PowerPoint presentation that can be edited conveniently. Download it right away and captivate your audience.
-
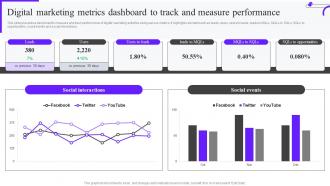 Digital Marketing Metrics Dashboard To Track And Measure Performance Mkt Ss V
This slide presents a dashboard to measure and track performance of digital marketing activities using various metrics. It highlights element such as leads, users, users to leads, leads to MQLs, MQLs to SQLs, SQLs to opportunities, social events and social interactions. Deliver an outstanding presentation on the topic using this Digital Marketing Metrics Dashboard To Track And Measure Performance Mkt Ss V. Dispense information and present a thorough explanation of Social Interactions, Social Events using the slides given. This template can be altered and personalized to fit your needs. It is also available for immediate download. So grab it now.
-
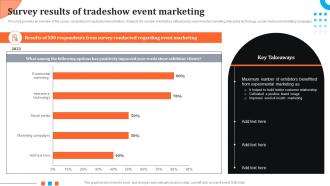 Survey Results Of Tradeshow Event Marketing Event Advertising Via Social Media Channels MKT SS V
This slide provides an overview of the survey conducted among tradeshow exhibitors. It depicts the number of exhibitors influenced by experimental marketing, interactive technology, social media and marketing campaigns. Deliver an outstanding presentation on the topic using this Survey Results Of Tradeshow Event Marketing Event Advertising Via Social Media Channels MKT SS V Dispense information and present a thorough explanation of Experimental Marketing, Customer Relationship using the slides given. This template can be altered and personalized to fit your needs. It is also available for immediate download. So grab it now.
-
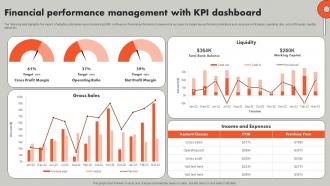 Financial Performance Management With Understanding ERP Software Implementation Procedure
The following slide highlights the impact of adopting enterprise resource planning ERP software on financial performance to measure its success. It includes key performance indicators such as gross profit margin, operating ratio, net profit margin, liquidity status etc. Deliver an outstanding presentation on the topic using this Financial Performance Management With Understanding ERP Software Implementation Procedure. Dispense information and present a thorough explanation of Management, Performance, Financial using the slides given. This template can be altered and personalized to fit your needs. It is also available for immediate download. So grab it now.
-
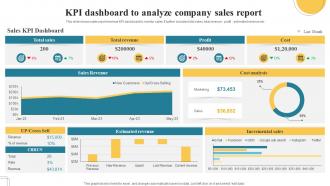 KPI Dashboard To Analyze Company Sales Report
This slide shows sales report revenue KPI dashboard to monitor sales. It further includes total sales, total revenue, profit, estimated revenue etc Introducing our KPI Dashboard To Analyze Company Sales Report set of slides. The topics discussed in these slides are Total Revenue, Incremental Sales. This is an immediately available PowerPoint presentation that can be conveniently customized. Download it and convince your audience.
-
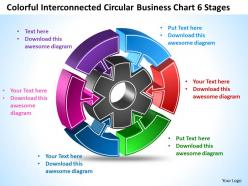 Coloful interconnected circular business chart 6 stages templates ppt presentation slides 812
By using this diagram You can build confidence among audience by providing strong visual clues as to how things fit together and how very different projects contribute to the same outcome
-
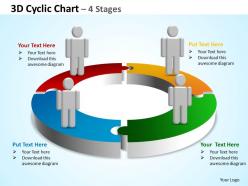 3d cyclic chart 4 stages powerpoint diagrams presentation slides graphics 0912
3D Cyclic Chart in red, green, blue and yellow color can be helpful on explaining four different approaches for business process
-
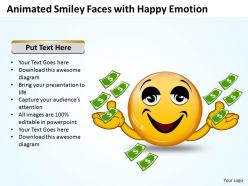 Business powerpoint templates animated smiley with happy emotion sales ppt slides
This PowerPoint Diagram shows you the Happy Smiley with lots of Dollars. Use this 3D PowerPoint Diagram to represent enchantment, enjoyment, exuberance, good cheer, good humor, good spirits, hilarity, hopefulness, mirth, optimism, and paradise, peace of mind, playfulness, pleasure, prosperity, rejoicing, seventh heaven, vivacity, and well-being.
-
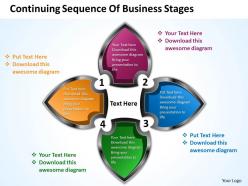 Business powerpoint templates continuing sequence of stages sales ppt slides
This Flower Based PowerPoint Diagram shows the continuous sequence of stages which may be used in Sales, Marketing, and Finance etc. It shows the description of each stage one by one that is by Highlighting one Petal at a time.
-
 Business powerpoint templates design of an emoticon showing angry face sales ppt slides
Use this Business PowerPoint Diagram to represent different types of angry faces. It portrays the concept of animosity, annoyance, antagonism, ill humor, ill temper, impatience, indignation, infuriation, irascibility, ire, irritability, vexation, violence.
-
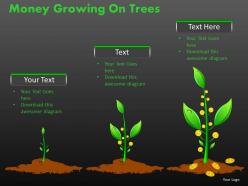 Money growing on trees ppt 12
This template is skillfully designed and is completely editable to suit all the needs and requirements of the user. The color of the font, its size, style, and all other elements can be customized according to the user's desire The text in the PPT placeholder can be replaced with the desired information making this template highly flexible and adaptable as well. This template is also compatible with various Microsoft versions and formats like Google Slides, JPG, PDF, etc so the user will face no issue in saving it in the format of his choice.
-
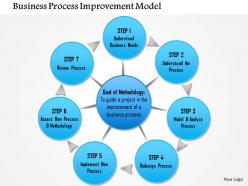 0714 business process improvement model powerpoint presentation slide template
We are proud to present our 0714 business process improvement model powerpoint presentation slide template. Enhance the beauty of your presentation with this innovative diagram. This diagram has been designed with 3d circular process chart with multiple interconnected stages. This graphic image is called business process improvement model. Use it display for various phases of business process improvements.
-
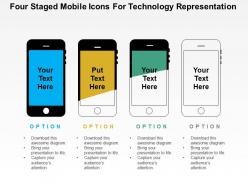 Four staged mobile icons for technology representation flat powerpoint design
We are proud to present our four staged mobile icons for technology representation flat powerpoint design. Four staged mobile and technology icons has been used to craft this power point template diagram. This PPT diagram contains the concept of technology application. Use this PPT diagram for business and mobile technology related presentations.
-
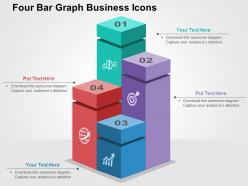 Four bar graph business icons flat powerpoint design
We are proud to present our four bar graph business icons flat powerpoint design. Graphic of four bar graph and business icons has been used to craft this power point template diagram. This PPT diagram contains the concept of business process flow. Use this PPT diagram for finance and business related presentations.
-
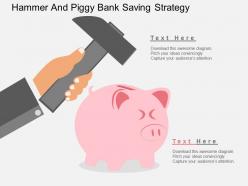 Hammer and piggy bank saving strategy flat powerpoint design
We are proud to present our hammer and piggy bank saving strategy flat powerpoint design. Graphic of hammer and piggy bank been used to design this power point template diagram. This PPT diagram contains the concept of saving and growth strategy. Use this PPT diagram for business and finance related presentations.
-
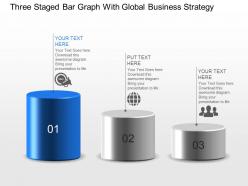 Three staged bar graph with global business strategy powerpoint template slide
We are proud to present our three staged bar graph with global business strategy powerpoint template slide. Graphic of three staged bar graph has been used to craft this power point template diagram. This PPT diagram contains the concept of business strategy .Use this PPT diagram for business and management related presentations.
-
 Dh two staged tags with finance icons flat powerpoint design
Presenting dh two staged tags with finance icons flat powerpoint design. Two staged tags and finance icons have been used to craft this power point template diagram. This PPT diagram contains the concept of financial data and process flow representation. Use this PPT diagram for business and finance related presentations.
-
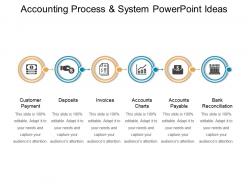 Accounting process and system powerpoint ideas
Presenting accounting process and system powerpoint ideas. This is a accounting process and system powerpoint ideas. This is a six stage process. The stages in this process are accounting, book keeping, auditing.
-
 Opportunity cost three options with dollar
Presenting this Opportunity Cost Three Options with Dollar PowerPoint presentation. Add charts and graphs for a clear representation of facts. The slide supports the standard (4:3) and widescreen (16:9) aspect ratios. It is compatible with Google Slides. Save this into common images or document formats including JPEG, PNG or PDF. High-quality graphics always retain the original quality.
-
 Banking product icon locked safe vault
Presenting banking product icon locked safe vault. This is a banking product icon locked safe vault. This is a four stage process. The stages in this process are banking product icons, financial product icons.
-
 Stock market course showing zigzag arrow upward
Presenting this set of slides with name - Stock Market Course Showing Zigzag Arrow Upward. This is a three stage process. The stages in this process are Bull Market, Financial Market, Stock Market.
-
 Banking network managing banking applications
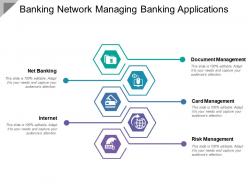
Presenting this set of slides with name - Banking Network Managing Banking Applications. This is a five stage process. The stages in this process are Banking Network, Banking Hub, Banking System.
-
 Banking network money loan analysis boxes
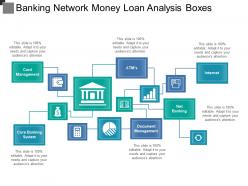
Presenting this set of slides with name - Banking Network Money Loan Analysis Boxes. This is a six stage process. The stages in this process are Banking Network, Banking Hub, Banking System.
-
 Financial management ppt powerpoint presentation show
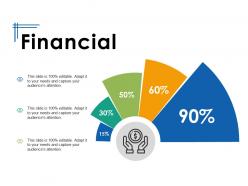
Presenting this set of slides with name - Financial Management Ppt Powerpoint Presentation Show. This is a three stages process. The stages in this process are Business, Finance, Analysis, Investment, Marketing.
-
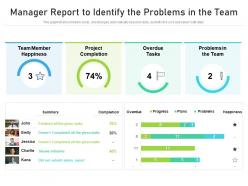 Manager report to identify the problems in the team
This graph or chart is linked to excel, and changes automatically based on data. Just left click on it and select edit data. Introducing our Manager Report To Identify The Problems In The Team set of slides. The topics discussed in these slides are Project Completion, Overdue Tasks, Completion. This is an immediately available PowerPoint presentation that can be conveniently customized. Download it and convince your audience.
-
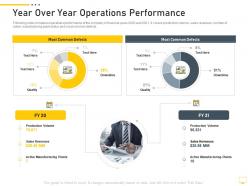 Year over year operations performance digital transformation of workplace
Following slide compares operations performance of the company in financial years 2020 and 2021. It covers production volume, sales revenues, number of active manufacturing plant status and most common defects. Present the topic in a bit more detail with this Year Over Year Operations Performance Digital Transformation Of Workplace. Use it as a tool for discussion and navigation on Production Volume, Sales Revenues, Active Manufacturing Plants. This template is free to edit as deemed fit for your organization. Therefore download it now.
-
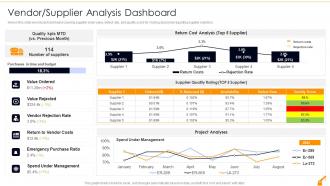 Vendor Supplier Analysis Dashboard Risk Management In Commercial Building
Here in this slide we include Dashboard covering supplier order value, defect rate, and quality score for making decisions regarding supplier selection. Present the topic in a bit more detail with this Vendor Supplier Analysis Dashboard Risk Management In Commercial Building. Use it as a tool for discussion and navigation on Vendor Supplier Analysis Dashboard. This template is free to edit as deemed fit for your organization. Therefore download it now.
-
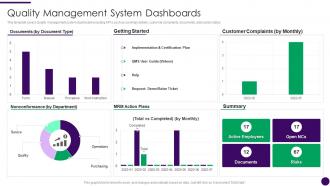 Quality Management System Dashboards How To Achieve ISO 9001 Certification Ppt Clipart
This template covers Quality management system dashboard including KPIs such as summary details, customer complaints, documents, action plan status. Deliver an outstanding presentation on the topic using this Quality Management System Dashboards How To Achieve ISO 9001 Certification Ppt Clipart. Dispense information and present a thorough explanation of Quality Management System Dashboards using the slides given. This template can be altered and personalized to fit your needs. It is also available for immediate download. So grab it now.
-
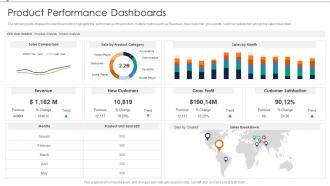 Product Performance Dashboards Annual Product Performance Report Ppt Rules
The following slide displays the dashboard which highlights the performance of the product, multiple metrics such as Revenues, New customer, gross profit, customer satisfaction and global sales breakdown. Deliver an outstanding presentation on the topic using this Product Performance Dashboards Annual Product Performance Report Ppt Rules. Dispense information and present a thorough explanation of Product Performance Dashboards using the slides given. This template can be altered and personalized to fit your needs. It is also available for immediate download. So grab it now.
-
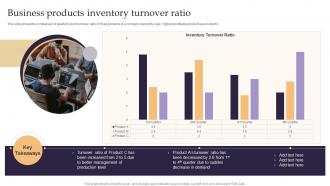 Business Products Inventory Turnover Ratio
This slide shows the comparison of quarterly stock turnover ratio of three products of a company during the year. Highest profitable product was product C Presenting our well-structured Business Products Inventory Turnover Ratio. The topics discussed in this slide are Business Products, Inventory, Turnover Ratio. This is an instantly available PowerPoint presentation that can be edited conveniently. Download it right away and captivate your audience.
-
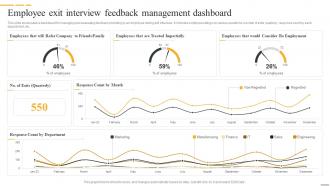 Employee Exit Interview Feedback Management Dashboard
This slide showcases a dashboard for managing and assessing feedback providing by an employee during exit interview. It includes employee ratings on various questions, number of exits quarterly, response count by each department, etc. Introducing our Employee Exit Interview Feedback Management Dashboard set of slides. The topics discussed in these slides are Response Count By Month, Response Count By Department, Treated Impartially. This is an immediately available PowerPoint presentation that can be conveniently customized. Download it and convince your audience.
-
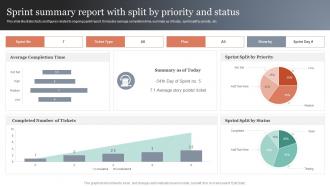 Sprint Summary Report With Split By Priority And Status
This slide illustrates facts and figures related to ongoing sprint report. It includes average completion time, summary as of today, sprint split by priority, etc. Introducing our Sprint Summary Report With Split By Priority And Status set of slides. The topics discussed in these slides are Average Completion, Completed Number, Sprint Split. This is an immediately available PowerPoint presentation that can be conveniently customized. Download it and convince your audience.
-
 Workplace Safety Dashboard To Monitor Incidents Manual For Occupational Health And Safety
This slide highlights the workplace safety dashboard which showcase incidents per employee, worksite incident total, incidents by total and top injuries by body part. Present the topic in a bit more detail with this Workplace Safety Dashboard To Monitor Incidents Manual For Occupational Health And Safety. Use it as a tool for discussion and navigation on Workplace Safety, Dashboard, Monitor Incidents. This template is free to edit as deemed fit for your organization. Therefore download it now.
-
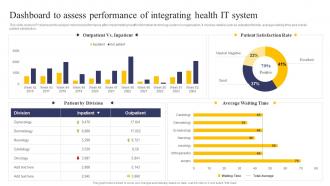 Integrating Health Information System Dashboard To Assess Performance Of Integrating
This slide covers KPI dashboard to analyze improved performance after implementing health information technology system in organization. It involves details such as outpatient trends, average waiting time and overall patient satisfaction. Present the topic in a bit more detail with this Integrating Health Information System Dashboard To Assess Performance Of Integrating. Use it as a tool for discussion and navigation on Dashboard, Performance, Health. This template is free to edit as deemed fit for your organization. Therefore download it now.
-
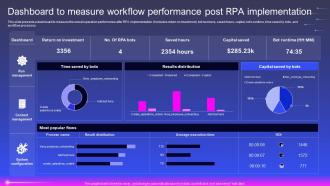 Dashboard To Measure Workflow Performance Post Rpa Robotic Process Automation
This slide presents a dashboard to measure the overall operation performance after RPA implementation. It includes return on investment, bot numbers, saved hours, capital, bots runtime, time saved by bots, and workflow processes. Deliver an outstanding presentation on the topic using this Dashboard To Measure Workflow Performance Post Rpa Robotic Process Automation. Dispense information and present a thorough explanation of Return On Investment, Results Distribution using the slides given. This template can be altered and personalized to fit your needs. It is also available for immediate download. So grab it now.
-
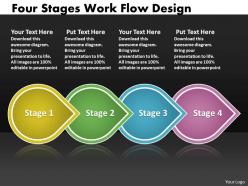 Ppt four stages work flow interior design powerpoint template business templates 4 stages
With this chart you can visualize developments in different timeframes. You can compare different trends and display progress with this professional PPT slide.
-
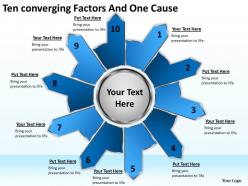 Ten converging factors and one cause cycle process diagram powerpoint templates
Create visually stunning and define your PPT Presentations in a unique and inspiring manner using our above Template which contains a graphic of ten factors converging to one noble Cause. It is Designed to help bullet-point your views and thoughts. You can apply other 3D Styles and shapes to the slide to enhance your presentations.
-
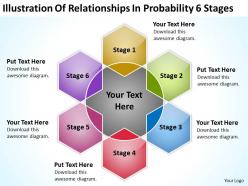 Business process diagram vision of relationships probability 6 stages powerpoint templates
We are proud to present our business process diagram vision of relationships probability 6 stages powerpoint templates. Create dynamic Microsoft office PPT Presentations with our professional templates containing a graphic of overlapping relationship. This PowerPoint Diagram is used to illustrate simple set relationships in probability, logic, statistics, and linguistics and computer science. Use this diagram for business processes and management presentations.
-
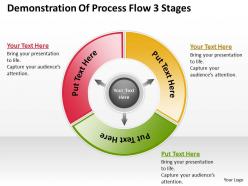 Powerpoint for business demonstration of process flow 3 stages templates
We are proud to present our powerpoint for business demonstration of process flow 3 stages templates. Create visually stunning and define your PPT Presentations in a unique and inspiring manner using our above template. This diagram is good for continual improvement, phases of processes, aparting into main parts, logical processes, management, product lifecycle and cyclic processes. You can change color, size and orientation of any icon to your liking.
-
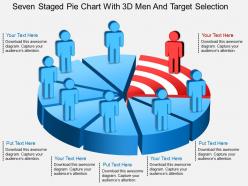 Fu seven staged pie chart with 3d men and target selection powerpoint template
Presenting fu seven staged pie chart with 3d men and target selection powerpoint template. Seven staged pie chart and 3d men has been used to craft this power point template diagram. This PPT diagram contains the concept of target selection. Use this PPT diagram for business and marketing related presentations.
-
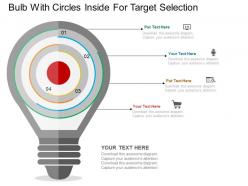 One bulb with circles inside for target selection flat powerpoint design
Presenting one bulb with circles inside for target selection flat powerpoint design. This Power Point template diagram has been crafted with graphic of bulb and circles diagram. This PPT diagram contains the concept of target selection .Use this PPT diagram for business and marketing related presentations.
-
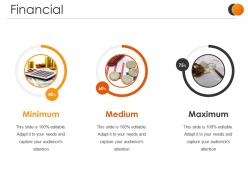 Financial presentation images
Presenting our Financial Presentation Images PowerPoint Presentation Slide. This is a 100% editable and adaptable PPT slide. You can save it in different formats like PDF, JPG, and PNG. It can be edited with different colors, fonts, font sizes, and font types of the template as per your requirements. This template supports the standard (4:3) and widescreen (16:9) format. It is also compatible with Google Slides.
-
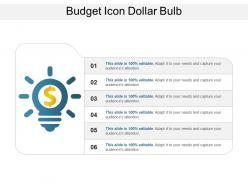 Budget icon dollar bulb
Presenting budget icon dollar bulb. This is a budget icon dollar bulb. This is a six stage process. The stages in this process are budget icon, fund icon, expense icon.
-
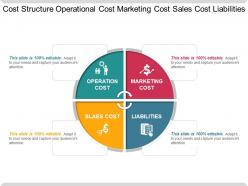 Cost structure operational cost marketing cost sales cost liabilities
Presenting cost structure operational cost marketing cost sales cost liabilities. This is a cost structure operational cost marketing cost sales cost liabilities. This is a four stage process. The stages in this process are cost structure, budget framework, fun model.
-
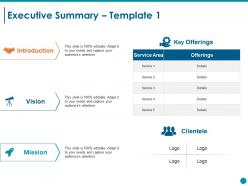 Executive summary ppt styles file formats
Presenting this set of slides with name - Executive Summary Ppt Styles File Formats. This is a three stage process. The stages in this process are Introduction, Vision, Mission, Clientele, Key Offerings.


