Finance PowerPoint Templates, Presentation Slide Diagrams & PPT Graphics
- Sub Categories
-
- 30 60 90 Day Plan
- Advertising
- Agile Development
- Aims and Objectives
- Arrows
- Before and After
- Blockchain Bitcoin
- Boxes
- Business
- Calender
- Case Study
- Celebrations
- Certificates
- Challenges Opportunities
- Channel Distribution
- Children
- Communication
- Competitive Landscape
- Computer
- Concepts
- Construction Management
- Corporate
- Crowdfunding
- Current State Future State
- Custom PowerPoint Diagrams
- Digital Transformation
- Dos and Donts
- Economics
- Education
- Environment
- Events
- Festival
- Finance
- Financials
- Food
- Game
- Gap Analysis
- Generic
- Geographical
- Health
- Heatmaps
- Holidays
- Icons
- Input Process Output
- Internet
- Key Messages
- Key Wins
- Ladder
- Leadership
- Lists
- Lucky Draw
- Management
- Marketing
- Measuring
- Medical
- Music
- News
- Next Steps
- People Process Technology
- Pillars
- Planning
- Post-it-Notes
- Problem Statement
- Process
- Proposal Management
- Pros and Cons
- Puzzle
- Puzzles
- Recruitment Strategy
- Religion
- Research and Development
- Risk Mitigation Strategies
- Roadmap
- Selling
- Shapes
- Short Term Long Term
- Social
- Stairs
- Start Stop Continue
- Strategy
- Symbol
- Technology
- Thesis Defense Dissertation
- Timelines
- Traffic
- Transition Plan
- Transportation
- Vehicles
- Venture Capital Funding
- Warning
- Winners
- Word Cloud
-
 Business process management diagram for benefits powerpoint templates ppt backgrounds slides
High resolution images and the graphics. Ease to edit the content and related information. Uncomplicated addition of your company’s name. Download and save in the format you like. Compatibility with the Google slides. Beneficial for the business professionals, Management people and the entrepreneurs.
-
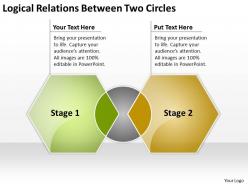 Business powerpoint examples between two circles templates ppt backgrounds for slides
We are proud to present our business powerpoint examples between two circles templates ppt backgrounds for slides. Business Template displays overlapping hexagon shape. This diagram is also called Venn diagram. The PowerPoint Diagram provides you with a vast range of viable options. Select the appropriate ones and just fill in your text.
-
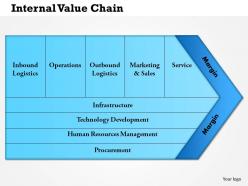 0514 internal value chain powerpoint presentation powerpoint presentation
Other than providing you with the best experience this PPT slide can be used by professionals for internal value chain marketing related presentations. All the colors of the sections and the text shown in the figure can be changed according to your liking. After downloading you can access more interesting features of this template.
-
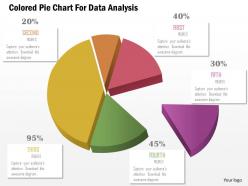 1114 colored pie chart for data analysis powerpoint template
We are proud to present our 1114 colored pie chart for data analysis powerpoint template. Graphic of colored pie chart has been used to design this Power Point template slide. This PPt slide contains the concept of data analysis. Use this PPT slide for your business and finance data related analysis.
-
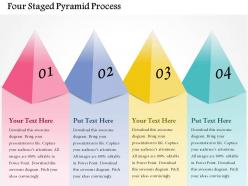 Four staged pyramid process powerpoint templates
We are proud to present our four staged pyramid process powerpoint templates. Graphic of four staged pyramid diagram has been used to design this power point template. This PPT diagram contains the concept of business process representation. Use this PPT diagram for business and marketing related presentations.
-
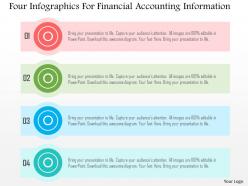 Four infographics for financial accounting information flat powerpoint design
We are proud to present our four infographics for financial accounting information flat powerpoint design. Four info graphics has been used to craft this power point template. This PPT diagram contains the concept of financial accounting and information. Use this PPT diagram for finance and accounting related presentations.
-
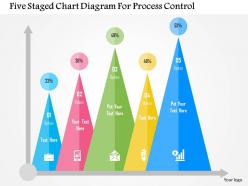 Five staged chart diagram for process control flat powerpoint design
We are proud to present our five staged chart diagram for process control flat powerpoint design. Five staged chart has been used to craft this power point template diagram. This PPT diagram contains the concept of process control. Use this diagram PPT for business and finance related presentations.
-
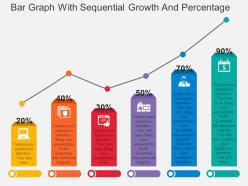 Ppt bar graph with sequential growth and percentage flat powerpoint design
Presenting ppt bar graph with sequential growth and percentage flat powerpoint design. This Power Point template diagram has been crafted with graphic of bar graph and percentage icons. This PPT diagram contains the concept of sequential growth and financial planning. Use this PPT diagram for business and finance related presentations.
-
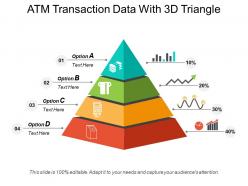 Atm transaction data with 3d triangle
Presenting atm transaction data with 3d triangle. This is a atm transaction data with 3d triangle. This is a four stage process. The stages in this process are atm, automated teller machine.
-
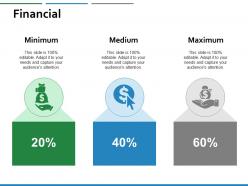 Financial management ppt powerpoint presentation inspiration outline
Presenting this set of slides with name - Financial Management Ppt Powerpoint Presentation Inspiration Outline. This is a three stages process. The stages in this process are Financial, Minimum, Maximum, Marketing, Strategy.
-
 Kpi metrics and dashboard a1215 ppt powerpoint presentation portfolio outfit
Presenting this set of slides with name KPI Metrics And Dashboard A1215 Ppt Powerpoint Presentation Portfolio Outfit. This is a one stage process. The stages in this process are KPI Metrics And Dashboard. This is a completely editable PowerPoint presentation and is available for immediate download. Download now and impress your audience.
-
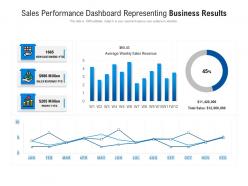 Sales performance dashboard representing business results
Presenting this set of slides with name Sales Performance Dashboard Representing Business Results. The topics discussed in these slides are New Customers, Sales Revenue, Profit. This is a completely editable PowerPoint presentation and is available for immediate download. Download now and impress your audience.
-
 Cost optimization process icon with dollar
Presenting this set of slides with name Cost Optimization Process Icon With Dollar. This is a three stage process. The stages in this process are Cost Optimization Process Icon With Dollar. This is a completely editable PowerPoint presentation and is available for immediate download. Download now and impress your audience.
-
 How visually map content strategy brand customer demographics and geographics ppt file graphics
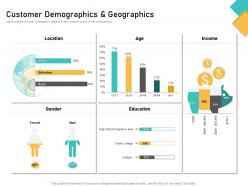
Use this editable customer demographics template to get a complete picture of their characteristics. Present the topic in a bit more detail with this How Visually Map Content Strategy Brand Customer Demographics And Geographics Ppt File Graphics. Use it as a tool for discussion and navigation on Location, Income, Education. This template is free to edit as deemed fit for your organization. Therefore download it now.
-
 Loan portfolio risk review dashboard
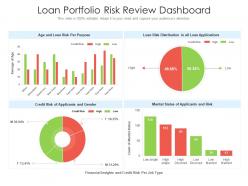
Introducing our Loan Portfolio Risk Review Dashboard set of slides. The topics discussed in these slides are Loan Portfolio Risk Review Dashboard. This is an immediately available PowerPoint presentation that can be conveniently customized. Download it and convince your audience.
-
 Warehouse Operations Dashboard With Orders Management
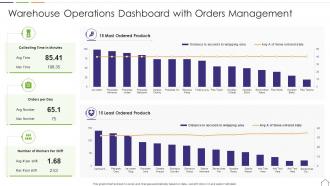
This graph or chart is linked to excel, and changes automatically based on data. Just left click on it and select edit data. Presenting our well structured Warehouse Operations Dashboard With Orders Management. The topics discussed in this slide are Collecting Time in Minutes, 15 Most Ordered Products, Orders per Day, Number of Workers Per Shift, 15 Least Ordered Products. This is an instantly available PowerPoint presentation that can be edited conveniently. Download it right away and captivate your audience.
-
 Dashboard Snapshot Indicating Economic Impact Of COVID 19
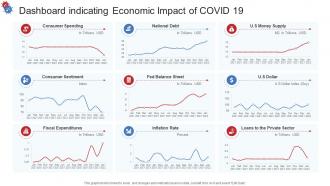
This graph or chart is linked to excel, and changes automatically based on data. Just left click on it and select Edit Data. Introducing our Dashboard Snapshot Indicating Economic Impact Of COVID 19 set of slides. The topics discussed in these slides are Consumer Spending, National Debt, US Money Supply, Consumer Sentiment, Fed Balance Sheet, Inflation Rate, Fiscal Expenditures, Loans Private Sector, US Dollar. This is an immediately available PowerPoint presentation that can be conveniently customized. Download it and convince your audience.
-
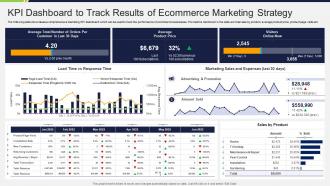 KPI Dashboard To Track Results Of Ecommerce Marketing Strategy
The following slide showcases a comprehensive marketing KPI dashboard which can be used to track the performance of ecommerce businesses. The metrics mentioned in the slide are total sale by product, average product price, product page visits etc. Introducing our KPI Dashboard To Track Results Of Ecommerce Marketing Strategy set of slides. The topics discussed in these slides are Average Product Price, Visitors Online Now, Sales By Product, Marketing Sales And Expenses Last 30 Days. This is an immediately available PowerPoint presentation that can be conveniently customized. Download it and convince your audience.
-
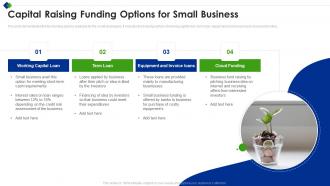 Capital Raising Funding Options For Small Business
This slide demonstrates the four funding options available for the small businesses. It includes fund raising options of working capital loan, term loan, equipment and invoice loans and cloud funding. Presenting our set of slides with name Capital Raising Funding Options For Small Business. This exhibits information on four stages of the process. This is an easy-to-edit and innovatively designed PowerPoint template. So download immediately and highlight information on Cloud Funding, Working Capital Loan, Equipment And Invoice Loans.
-
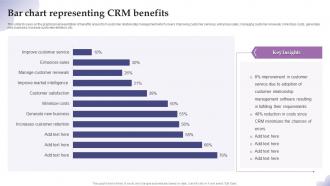 Bar Chart Representing CRM Benefits
This slide focuses on the graphical representation of benefits arises from customer relationship management which covers improving customer services, enhances sales, managing customer renewals, minimizes costs, generates new business, increase customer retention, etc. Introducing our Bar Chart Representing CRM Benefits set of slides. The topics discussed in these slides are Bar chart representing, CRM benefits. This is an immediately available PowerPoint presentation that can be conveniently customized. Download it and convince your audience.
-
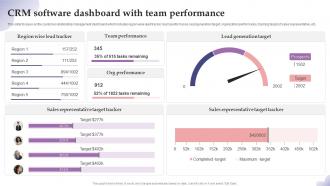 CRM Software Dashboard With Team Performance
This slide focuses on the customer relationship management dashboard which includes region wise lead tracker, team performance, lead generation target, organization performance, tracking target of sales representative, etc. Introducing our CRM Software Dashboard With Team Performance set of slides. The topics discussed in these slides are CRM Software, Dashboard, Team Performance. This is an immediately available PowerPoint presentation that can be conveniently customized. Download it and convince your audience.
-
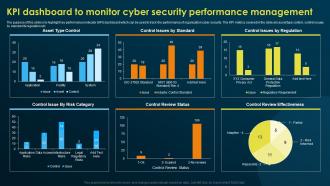 KPI Dashboard To Monitor Cyber Security Performance Implementing Security Awareness Training
The purpose of this slide is to highlight key performance indicator KPI dashboard which can be used to track the performance of organization cyber security. The KPI metrics covered in the slide are asset type control, control issues by standard and regulation etc. Deliver an outstanding presentation on the topic using this KPI Dashboard To Monitor Cyber Security Performance Implementing Security Awareness Training. Dispense information and present a thorough explanation of Asset Type Control, Control Issues By Standard, Review Effectiveness using the slides given. This template can be altered and personalized to fit your needs. It is also available for immediate download. So grab it now.
-
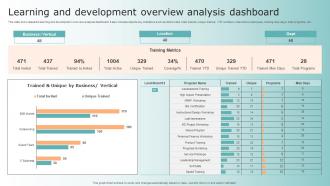 Learning And Development Overview Analysis Dashboard
This slide showcases the learning and development overview analysis dashboard. It also includes depicts key indicators such as total invited, total trained, unique trained, YTD numbers, total active employees, training man days, total programs, etc. Introducing our Learning And Development Overview Analysis Dashboard set of slides. The topics discussed in these slides are Training Metrics, Assessments Training. This is an immediately available PowerPoint presentation that can be conveniently customized. Download it and convince your audience.
-
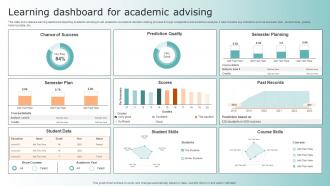 Learning Dashboard For Academic Advising
This slide showcases a learning dashboard depicting academic advising to aid academic counselors decision making process through comparative and predictive analysis. It also includes key indicators such as semester plan, student data, grades, historical data, etc. Introducing our Learning Dashboard For Academic Advising set of slides. The topics discussed in these slides are Chance Success, Prediction Quality. This is an immediately available PowerPoint presentation that can be conveniently customized. Download it and convince your audience.
-
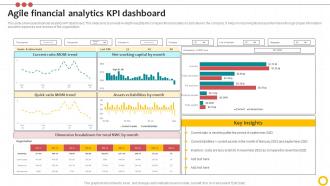 Agile Financial Analytics Kpi Dashboard
This slide showcases financial analytics KPI dashboard. This slide aims to provide in depth insights into company financial status to add value to the company. It helps in improving financial performance through proper information about the expenses and revenue of the organization. Presenting our well structured Agile Financial Analytics Kpi Dashboard. The topics discussed in this slide are Current Ratio Mom Trend, Dimension Breakdown.This is an instantly available PowerPoint presentation that can be edited conveniently. Download it right away and captivate your audience.
-
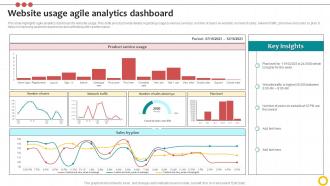 Website Usage Agile Analytics Dashboard
This slide highlights agile analytics dashboard for website usage. This slide aims to provide details regarding usage by various services, number of users on website, number of sales, network traffic, plan level and sales by plan. It helps in improving audience experience and optimizing sites performance. Presenting our well structured Website Usage Agile Analytics Dashboard. The topics discussed in this slide are Product Service Usage, Network Traffic.This is an instantly available PowerPoint presentation that can be edited conveniently. Download it right away and captivate your audience.
-
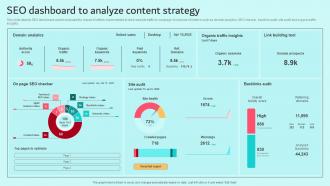 SEO Dashboard To Analyze Content Strategy Brand Content Strategy Guide MKT SS V
This slide depicts SEO dashboard used to evaluate the impact of efforts implemented to drive website traffic to webpage. It consists of metrics such as domain analytics, SEO checker, backlink audit, site audit and organic traffic insights. Deliver an outstanding presentation on the topic using this SEO Dashboard To Analyze Content Strategy Brand Content Strategy Guide MKT SS V. Dispense information and present a thorough explanation of Analytics, Strategy, Tool using the slides given. This template can be altered and personalized to fit your needs. It is also available for immediate download. So grab it now.
-
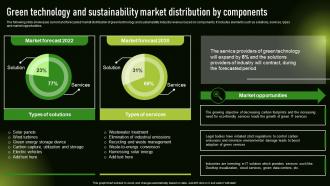 Green Technology And Sustainability Sustainable Development With Green Technology
The following slide showcases current and forecasted market distribution of green technology and sustainability industry revenue based on components. It includes elements such as solutions, services, types and market opportunities. Deliver an outstanding presentation on the topic using this Green Technology And Sustainability Sustainable Development With Green Technology. Dispense information and present a thorough explanation of Technology, Market, Components using the slides given. This template can be altered and personalized to fit your needs. It is also available for immediate download. So grab it now.
-
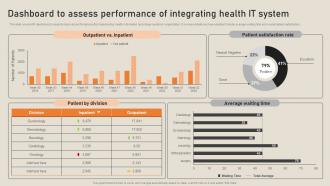 Dashboard To Assess Performance Of Integrating Health It System His To Transform Medical
This slide covers KPI dashboard to analyze improved performance after implementing health information technology system in organization. It involves details such as outpatient trends, average waiting time and overall patient satisfaction. Deliver an outstanding presentation on the topic using this Dashboard To Assess Performance Of Integrating Health It System His To Transform Medical. Dispense information and present a thorough explanation of Patient By Division, Patient Satisfaction Rate, Average Waiting Time using the slides given. This template can be altered and personalized to fit your needs. It is also available for immediate download. So grab it now.
-
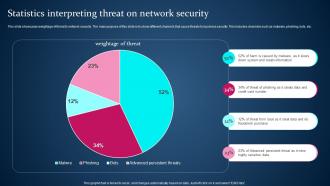 Statistics Interpreting Threat On Network Security
This slide showcases weightage of threat to network security. The main purpose of this slide is to show different channels that cause threats to business security. This includes channels such as malware, phishing, bots, etc. Presenting our well structured Statistics Interpreting Threat On Network Security. The topics discussed in this slide are Steals Information, Credit Card Number.This is an instantly available PowerPoint presentation that can be edited conveniently. Download it right away and captivate your audience.
-
 Business powerpoint templates naughty emoticon showing his tongue sales ppt slides
Use this Naughty Emoticon PowerPoint Diagram to express beam, friendliness, tenderness, grin, laugh, amusement, delightful nature, happiness, pleasing nature, simper, and smirk. You can change color, size and orientation of any icon to your liking.
-
 Curved arrows pointing inwards editable powerpoint templates infographics images 21
This PowerPoint Diagram shows four curved arrows combined together to form a square. It is helpful to describe interrelated issues, Approaches or Methods.
-
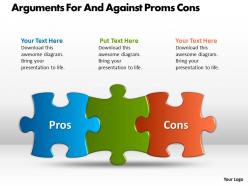 Arguments for and against proms cons ppt powerpoint slides
We are proud to present our arguments for and against proms cons ppt powerpoint slides. This Business Diagram will show you all arguments to prove your thesis. It will help you capture alternate viewpoints or to evaluate options for their merit or value. Forward thinking is the way to go. Use our templates to emphasise your views.
-
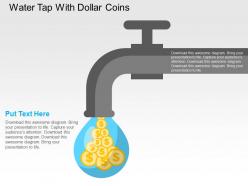 Water tap with dollar coins flat powerpoint design
We are proud to present our water tap with dollar coins flat powerpoint design. Graphic of water tap and dollar coins has been used to craft this power point template diagram. This PPT diagram contains the concept of money flow for financial planning. Use this PPT diagram for business and finance related presentations.
-
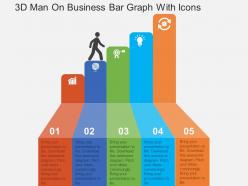 3d man on business bar graph with icons flat powerpoint design
We are proud to present our 3d man on business bar graph with icons flat powerpoint design. This power point template diagram has been crafted with graphic of 3d man and bar graph. This PPT diagram contains the concept of result analysis. Use this PPT diagram for business and marketing related presentations.
-
 Three staged lego blocks finance business diagram powerpoint template slide
Presentation slideshow goes well with Google slides. PPT diagram can be show in standard and widescreen view. Entirely alterable PowerPoint design as editing is enabled. Simple to download and share with the audience. Similar designs comes with different nodes and stages. Perfect for finance industry and business leaders.
-
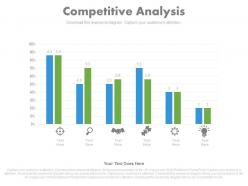 View competitive data analysis to identify opportunities and threats powerpoint slides
Presenting view competitive data analysis to identify opportunities and threats powerpoint slides. This Power Point template slide has been crafted with graphic of data bar graph and pie charts icons. This PPT slide contains the concept of competitive data analysis and identity opportunities representation. Use this PPT slide for business and marketing related presentations.
-
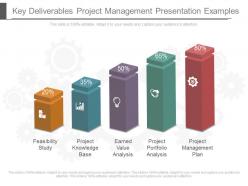 Key deliverables project management presentation examples
Presenting key deliverables project management presentation examples. This is a key deliverables project management presentation examples. This is a five stage process. The stages in this process are feasibility study, project knowledge base, earned value analysis, project portfolio analysis, project management plan.
-
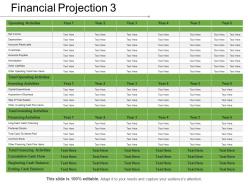 Financial projection 3 presentation portfolio
Presenting Financial Projection 3 Presentation Portfolio. You can easily download this template to access its full version. This template allows you to resize it and make changes in the fonts, colors, images, icons as per your needs. This slide is compatible with Google Slides and other formats such as PDF, JPG, and PNG. The slide designs are available in both the sizes- standard(4:3) and widescreen(16:9).
-
 Five step agenda
Presenting this set of slides with name - Five Step Agenda. This is a five stage process. The stages in this process are Red Ribbon, Red Banners.
-
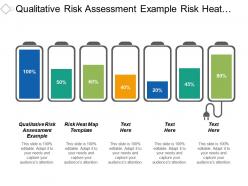 Qualitative risk assessment example risk heat map template cpb
Presenting this set of slides with name - Qualitative Risk Assessment Example Risk Heat Map Template Cpb. This is an editable seven graphic that deals with topics like Qualitative Risk Assessment Example, Risk Heat Map Template to help convey your message better graphically. This product is a premium product available for immediate download, and is 100 percent editable in Powerpoint. Download this now and use it in your presentations to impress your audience.
-
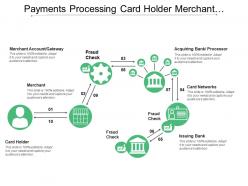 Payments processing card holder merchant acquiring fraud check
Presenting, our payments processing cardholder merchant acquiring fraud check PPT deck. Comprised of a high-resolution PowerPoint slides to address the payment process related concepts. Content is suitable and flexible and can easily be converted to JPG and PDF format. Edit the background color, layout, font shape, and size. Enter your data and edit the text. Fit to be used by business professionals, students, and researchers. Easy to incorporate your business name and logo in the slide. Widescreen friendly and accessible in both standard 4:3 and fullscreen versions 16:9.
-
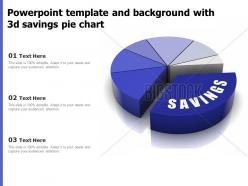 Powerpoint template and background with 3d savings pie chart
Present your findings by deploying our pre-designed template. Highlight the critical features of the subject quickly and amplify the productivity level using our Powerpoint Template And Background With 3d Savings Pie Chart. With the help of this professionally designed presentation, you can present the data using illustrations to keep your audience engaged. The design elements of this contemporary PPT slide enhances the overall appeal of your presentation. Do not miss any important detail and streamline your subject matter by employing our customizable Powerpoint Template And Background With 3d Savings Pie Chart. As this template is content-ready, just a few edits will do the trick. Download this fully-equipped PPT theme to deliver an impressive presentation and grab the audiences attention instantly. Any industry can adopt this versatile PowerPoint template. Empower yourself with our ready-made PPT layout comprising high-resolution design elements to deliver your content impactfully. Introduce this well-researched PPT theme in your business structure to get noticed. Therefore, steal the show and leave a great impression by downloading this content-ready presentation.
-
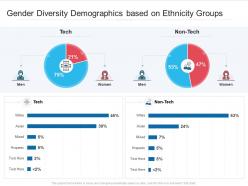 Gender diversity demographics based on ethnicity groups
Presenting our well structured Gender Diversity Demographics Based On Ethnicity Groups. The topics discussed in this slide are Gender Diversity Demographics Based On Ethnicity Groups. This is an instantly available PowerPoint presentation that can be edited conveniently. Download it right away and captivate your audience.
-
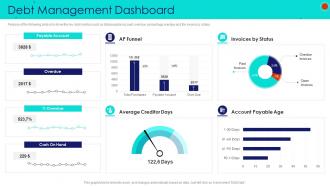 Debt management dashboard snapshot debt collection strategies
Purpose of the following slide is to show the key debt metrics such as total payable account, overdue, percentage overdue and the invoice by status Present the topic in a bit more detail with this Debt Management Dashboard Snapshot Debt Collection Strategies. Use it as a tool for discussion and navigation on Overdue, Payable Account, Invoices By Status, Cash On Hand. This template is free to edit as deemed fit for your organization. Therefore download it now.
-
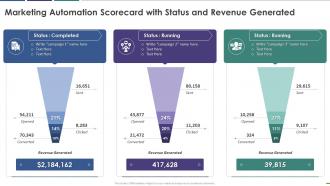 Marketing automation scorecard with status and revenue generated
This graph or chart is linked to excel, and changes automatically based on data. Just left click on it and select Edit Data. Introducing Marketing Automation Scorecard With Status And Revenue Generated to increase your presentation threshold. Encompassed with three stages, this template is a great option to educate and entice your audience. Dispence information on Completed, Running, Revenue Generated, using this template. Grab it now to reap its full benefits.
-
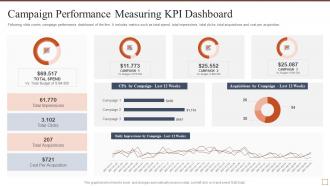 Campaign performance measuring kpi dashboard effective brand building strategy
Present the topic in a bit more detail with this Campaign Performance Measuring KPI Dashboard Effective Brand Building Strategy. Use it as a tool for discussion and navigation on Campaign Performance Measuring KPI DashboardFollowing slide covers campaign performance dashboard of the firm. It includes metrics such as total spend, total impressions, total clicks, total acquisitions and cost per acquisition. . This template is free to edit as deemed fit for your organization. Therefore download it now.
-
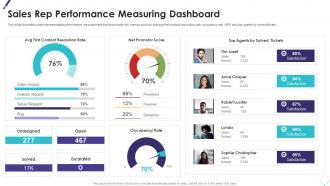 Sales Rep Performance Measuring Dashboard Improving Planning Segmentation
This slide illustrates sales representative performance measurement dashboard with key metrics such as average first contact resolution rate, occupancy rate, NPS and top agents by solved tickets. Present the topic in a bit more detail with this Sales Rep Performance Measuring Dashboard Improving Planning Segmentation. Use it as a tool for discussion and navigation on Unassigned, Solved, Escalated, Open. This template is free to edit as deemed fit for your organization. Therefore download it now.
-
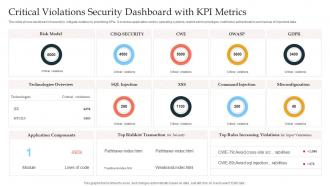 Critical Violations Security Dashboard Snapshot With KPI Metrics
This slide shows dashboard of security to mitigate violation by prioritizing KPIs. It includes application control, operating systems, restrict admin privileges, multi factor authentication and backup of important data. Introducing our Critical Violations Security Dashboard Snapshot With KPI Metrics set of slides. The topics discussed in these slides are Critical Violations Security, Dashboard, KPI Metrics. This is an immediately available PowerPoint presentation that can be conveniently customized. Download it and convince your audience.
-
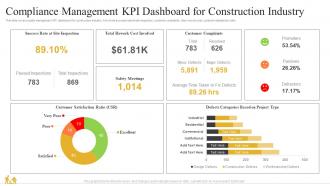 Compliance Management KPI Dashboard For Construction Industry
This slide covers quality management KPI dashboard for construction industry. It involves success rate at site inspection, customer complaints, total rework cost, customer satisfaction ratio. Presenting our well-structured Compliance Management KPI Dashboard For Construction Industry. The topics discussed in this slide are Compliance Management, KPI Dashboard, Construction Industry. This is an instantly available PowerPoint presentation that can be edited conveniently. Download it right away and captivate your audience.
-
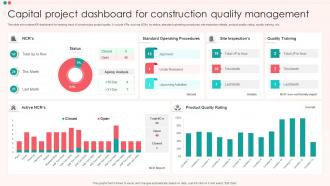 Capital Project Dashboard For Construction Quality Management
This slide showcases KPI dashboard for keeping track of construction project quality. It include KPIs such as NCRs by status, standard operating procedures, site inspection details, product quality rating, quality training, etc. Presenting our well-structured Capital Project Dashboard For Construction Quality Management. The topics discussed in this slide are Capital Project Dashboard, Construction Quality Management. This is an instantly available PowerPoint presentation that can be edited conveniently. Download it right away and captivate your audience.
-
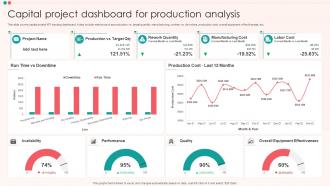 Capital Project Dashboard For Production Analysis
This slide covers capital project KPI tracking dashboard. It also include metrics such as production vs. target quantity, manufacturing, runtime vs. downtime, production cost, overall equipment effectiveness, etc. Presenting our well-structured Capital Project Dashboard For Production Analysis. The topics discussed in this slide are Availability, Performance, Quality, Overall Equipment Effectiveness. This is an instantly available PowerPoint presentation that can be edited conveniently. Download it right away and captivate your audience.
-
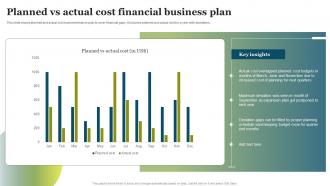 Planned Vs Actual Cost Financial Business Plan
This slide shows planned and actual cost business finance plan to cover financial gaps. It includes planned and actual cost for a year with deviations. Introducing our Planned Vs Actual Cost Financial Business Plan set of slides. The topics discussed in these slides are Planned Vs Actual, Financial Business Plan. This is an immediately available PowerPoint presentation that can be conveniently customized. Download it and convince your audience.
-
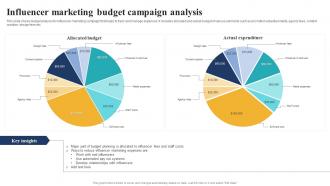 Influencer Marketing Budget Campaign Analysis
This slide shows budget analysis for influencer marketing campaign that helps to track and manage expenses. It includes allocated and actual budget of various elements such as promotion advertisements, agency fees, content creation, design fees etc. Presenting our well structured Influencer Marketing Budget Campaign Analysis. The topics discussed in this slide are Influencer Marketing, Budget Campaign, Analysis. This is an instantly available PowerPoint presentation that can be edited conveniently. Download it right away and captivate your audience.
-
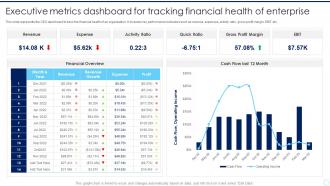 Executive Metrics Dashboard For Tracking Financial Health Of Enterprise
This slide represents the CEO dashboard to track the financial health of an organization. It includes key performance indicators such as revenue, expenses, activity ratio, gross profit margin, EBIT etc. Presenting our well structured Executive Metrics Dashboard For Tracking Financial Health Of Enterprise. The topics discussed in this slide are Revenue, Expense, Activity Ratio, Quick Ratio. This is an instantly available PowerPoint presentation that can be edited conveniently. Download it right away and captivate your audience.
-
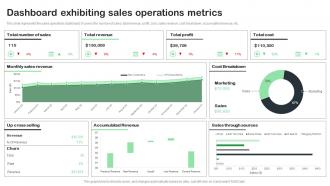 Dashboard Exhibiting Sales Operations Metrics
This slide represents the sales operations dashboard. It covers the number of sales, total revenue, profit, cost, sales revenue, cost breakdown, accumulated revenue, etc. Presenting our well structured Dashboard Exhibiting Sales Operations Metrics. The topics discussed in this slide are Accumulated Revenue, Cost Breakdown, Sales Through Source. This is an instantly available PowerPoint presentation that can be edited conveniently. Download it right away and captivate your audience.
-
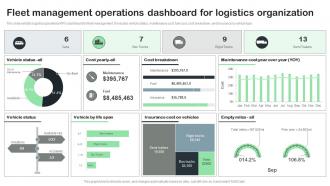 Fleet Management Operations Dashboard For Logistics Organization
This slide exhibits logistics operations KPIs dashboard for fleet management. It includes vehicle status, maintenance cost, fuel cost, cost breakdown, and insurance by vehicle type. Introducing our Fleet Management Operations Dashboard For Logistics Organization set of slides. The topics discussed in these slides are Vehicle Status, Cost Breakdown, Insurance Cost. This is an immediately available PowerPoint presentation that can be conveniently customized. Download it and convince your audience.
-
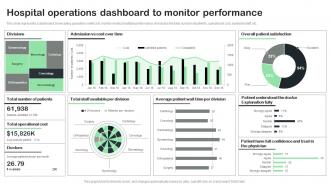 Hospital Operations Dashboard To Monitor Performance
This slide represents a dashboard showcasing operations metrics to monitor medical institute performance. It includes the total number of patients, operational cost, available staff, etc. Presenting our well structured Hospital Operations Dashboard To Monitor Performance. The topics discussed in this slide are Hospital Operations Dashboard, Monitor Performance. This is an instantly available PowerPoint presentation that can be edited conveniently. Download it right away and captivate your audience.
-
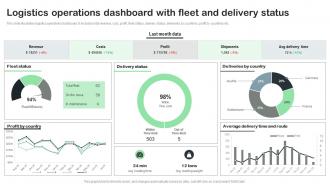 Logistics Operations Dashboard With Fleet And Delivery Status
This slide illustrates logistics operations dashboard. It includes total revenue, cost, profit, fleet status, delivery status, deliveries by countries, profit by countries etc. Introducing our Logistics Operations Dashboard With Fleet And Delivery Status set of slides. The topics discussed in these slides are Fleet Status, Delivery Status, Deliveries By Country. This is an immediately available PowerPoint presentation that can be conveniently customized. Download it and convince your audience.
-
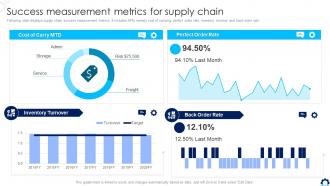 Supply Chain Transformation Toolkit Success Measurement Metrics For Supply Chain
Following slide displays supply chain success measurement metrics. It includes KPIs namely cost of carrying, perfect order rate, inventory turnover and back order rate. Deliver an outstanding presentation on the topic using this Supply Chain Transformation Toolkit Success Measurement Metrics For Supply Chain. Dispense information and present a thorough explanation of Success, Measurement, Metrics, Supply Chain using the slides given. This template can be altered and personalized to fit your needs. It is also available for immediate download. So grab it now.


