Finance PowerPoint Templates, Presentation Slide Diagrams & PPT Graphics
- Sub Categories
-
- 30 60 90 Day Plan
- Advertising
- Agile Development
- Aims and Objectives
- Arrows
- Before and After
- Blockchain Bitcoin
- Boxes
- Business
- Calender
- Case Study
- Celebrations
- Certificates
- Challenges Opportunities
- Channel Distribution
- Children
- Communication
- Competitive Landscape
- Computer
- Concepts
- Construction Management
- Corporate
- Crowdfunding
- Current State Future State
- Custom PowerPoint Diagrams
- Digital Transformation
- Dos and Donts
- Economics
- Education
- Environment
- Events
- Festival
- Finance
- Financials
- Food
- Game
- Gap Analysis
- Generic
- Geographical
- Health
- Heatmaps
- Holidays
- Icons
- Input Process Output
- Internet
- Key Messages
- Key Wins
- Ladder
- Leadership
- Lists
- Lucky Draw
- Management
- Marketing
- Measuring
- Medical
- Music
- News
- Next Steps
- People Process Technology
- Pillars
- Planning
- Post-it-Notes
- Problem Statement
- Process
- Proposal Management
- Pros and Cons
- Puzzle
- Puzzles
- Recruitment Strategy
- Religion
- Research and Development
- Risk Mitigation Strategies
- Roadmap
- Selling
- Shapes
- Short Term Long Term
- Social
- Stairs
- Start Stop Continue
- Strategy
- Symbol
- Technology
- Thesis Defense Dissertation
- Timelines
- Traffic
- Transition Plan
- Transportation
- Vehicles
- Venture Capital Funding
- Warning
- Winners
- Word Cloud
-
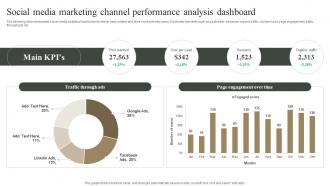 Social Media Marketing Channel Performance Analysis Measuring Marketing Success MKT SS V
The following slide showcases social media analytical dashboard to deliver best content and drive more website users. It includes elements such as post reach, sessions, organic traffic, cost per lead, page engagement, traffic through ads etc. Present the topic in a bit more detail with this Social Media Marketing Channel Performance Analysis Measuring Marketing Success MKT SS V Use it as a tool for discussion and navigation on Social Media, Marketing Channel, Analysis Dashboard This template is free to edit as deemed fit for your organization. Therefore download it now.
-
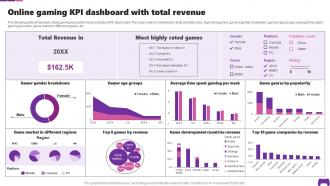 Online Gaming KPI Dashboard With Total Revenue Transforming Future Of Gaming IoT SS
The following slide showcases virtual gaming key performance indicator KPI dashboard. The major metrics mentioned in slide are total sales, high rated games, gamers gender breakdown, gamers age groups, average time spent gaming per week, game market in different regions, etc. Present the topic in a bit more detail with this Online Gaming KPI Dashboard With Total Revenue Transforming Future Of Gaming IoT SS. Use it as a tool for discussion and navigation on Gamer Age Groups, Game Development Countries Revenue. This template is free to edit as deemed fit for your organization. Therefore download it now.
-
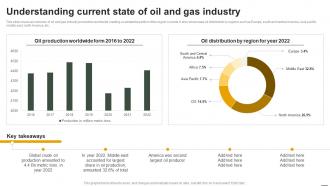 IoT Applications In Oil And Gas Understanding Current State Of Oil And Gas Industry IoT SS
This slide covers an overview of oil and gas industry production worldwide meeting a substantial portion of the regions needs. It also showcases oil distribution by regions such as Europe, south and central America, Asia pacific, middle east, north America, etc. Deliver an outstanding presentation on the topic using this IoT Applications In Oil And Gas Understanding Current State Of Oil And Gas Industry IoT SS. Dispense information and present a thorough explanation of Oil And Gas Industry, Production Worldwide, Meeting A Substantial Portion, Global Crude Oil Production using the slides given. This template can be altered and personalized to fit your needs. It is also available for immediate download. So grab it now.
-
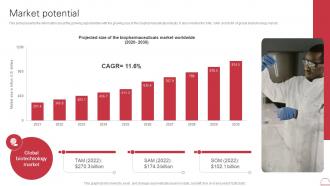 Market Potential Gilead Sciences Investor Funding Elevator Pitch Deck
This slide presents the information about the growing opportunities with the growing size of the biopharmaceuticals industry. It also mention the TAM, SAM and SOM of global biotechnology market. Present the topic in a bit more detail with this Market Potential Gilead Sciences Investor Funding Elevator Pitch Deck. Use it as a tool for discussion and navigation on Market Potential. This template is free to edit as deemed fit for your organization. Therefore download it now.
-
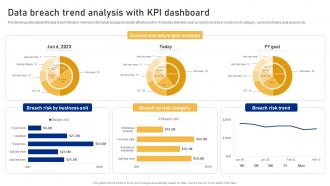 Data Breach Trend Analysis With KPI Dashboard Cyber Risk Assessment
The following slide depicts the data breach trends to minimize information leakage and patch affected system. It includes elements such as breach risk trend, breach by risk category, current and future goal analysis etc. Present the topic in a bit more detail with this Data Breach Trend Analysis With KPI Dashboard Cyber Risk Assessment Use it as a tool for discussion and navigation on Breach Risk, Business Unit, Risk Category This template is free to edit as deemed fit for your organization. Therefore download it now.
-
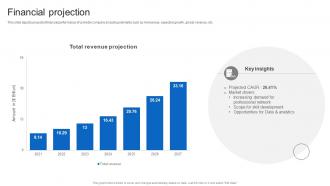 Financial Projection Business Model Of Linkedin
This slide depicts projected financial performance of LinkedIn company including elements such as Ad revenue, expected growth, global, revenue, etc. Present the topic in a bit more detail with this Financial Projection Business Model Of Linkedin Use it as a tool for discussion and navigation on Financial Projection, Revenue Projection This template is free to edit as deemed fit for your organization. Therefore download it now.
-
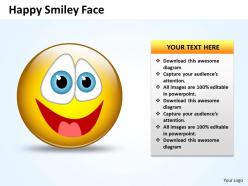 Business powerpoint templates naughty emoticon showing his tongue sales ppt slides
Use this Naughty Emoticon PowerPoint Diagram to express beam, friendliness, tenderness, grin, laugh, amusement, delightful nature, happiness, pleasing nature, simper, and smirk. You can change color, size and orientation of any icon to your liking.
-
 Curved arrows pointing inwards editable powerpoint templates infographics images 21
This PowerPoint Diagram shows four curved arrows combined together to form a square. It is helpful to describe interrelated issues, Approaches or Methods.
-
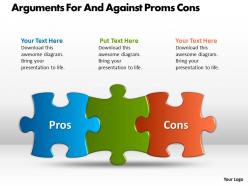 Arguments for and against proms cons ppt powerpoint slides
We are proud to present our arguments for and against proms cons ppt powerpoint slides. This Business Diagram will show you all arguments to prove your thesis. It will help you capture alternate viewpoints or to evaluate options for their merit or value. Forward thinking is the way to go. Use our templates to emphasise your views.
-
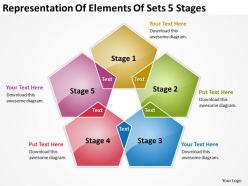 Business diagram examples representation of elements sets 5 stages powerpoint slides
We are proud to present our business diagram examples representation of elements sets 5 stages powerpoint slides. Deliver amazing Presentations with our above template. This diagram is also called as set diagram or overlapping circles. It features an image of pentagons in circular process representing Venn diagram. This diagram is used to represent overlapping relationships or compare and contrast relationships.
-
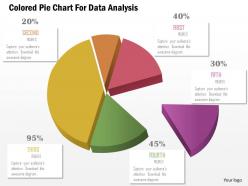 1114 colored pie chart for data analysis powerpoint template
We are proud to present our 1114 colored pie chart for data analysis powerpoint template. Graphic of colored pie chart has been used to design this Power Point template slide. This PPt slide contains the concept of data analysis. Use this PPT slide for your business and finance data related analysis.
-
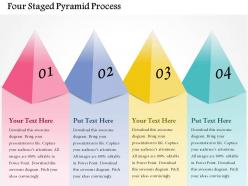 Four staged pyramid process powerpoint templates
We are proud to present our four staged pyramid process powerpoint templates. Graphic of four staged pyramid diagram has been used to design this power point template. This PPT diagram contains the concept of business process representation. Use this PPT diagram for business and marketing related presentations.
-
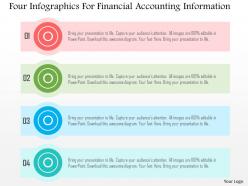 Four infographics for financial accounting information flat powerpoint design
We are proud to present our four infographics for financial accounting information flat powerpoint design. Four info graphics has been used to craft this power point template. This PPT diagram contains the concept of financial accounting and information. Use this PPT diagram for finance and accounting related presentations.
-
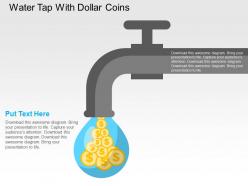 Water tap with dollar coins flat powerpoint design
We are proud to present our water tap with dollar coins flat powerpoint design. Graphic of water tap and dollar coins has been used to craft this power point template diagram. This PPT diagram contains the concept of money flow for financial planning. Use this PPT diagram for business and finance related presentations.
-
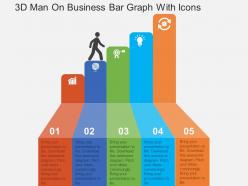 3d man on business bar graph with icons flat powerpoint design
We are proud to present our 3d man on business bar graph with icons flat powerpoint design. This power point template diagram has been crafted with graphic of 3d man and bar graph. This PPT diagram contains the concept of result analysis. Use this PPT diagram for business and marketing related presentations.
-
 Three staged lego blocks finance business diagram powerpoint template slide
Presentation slideshow goes well with Google slides. PPT diagram can be show in standard and widescreen view. Entirely alterable PowerPoint design as editing is enabled. Simple to download and share with the audience. Similar designs comes with different nodes and stages. Perfect for finance industry and business leaders.
-
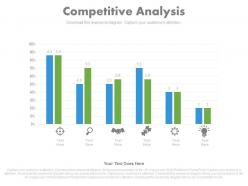 View competitive data analysis to identify opportunities and threats powerpoint slides
Presenting view competitive data analysis to identify opportunities and threats powerpoint slides. This Power Point template slide has been crafted with graphic of data bar graph and pie charts icons. This PPT slide contains the concept of competitive data analysis and identity opportunities representation. Use this PPT slide for business and marketing related presentations.
-
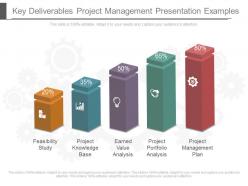 Key deliverables project management presentation examples
Presenting key deliverables project management presentation examples. This is a key deliverables project management presentation examples. This is a five stage process. The stages in this process are feasibility study, project knowledge base, earned value analysis, project portfolio analysis, project management plan.
-
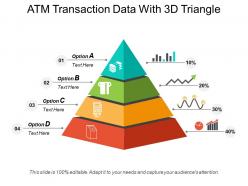 Atm transaction data with 3d triangle
Presenting atm transaction data with 3d triangle. This is a atm transaction data with 3d triangle. This is a four stage process. The stages in this process are atm, automated teller machine.
-
 Five step agenda
Presenting this set of slides with name - Five Step Agenda. This is a five stage process. The stages in this process are Red Ribbon, Red Banners.
-
 Kpi metrics and dashboard a1215 ppt powerpoint presentation portfolio outfit
Presenting this set of slides with name KPI Metrics And Dashboard A1215 Ppt Powerpoint Presentation Portfolio Outfit. This is a one stage process. The stages in this process are KPI Metrics And Dashboard. This is a completely editable PowerPoint presentation and is available for immediate download. Download now and impress your audience.
-
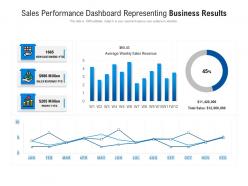 Sales performance dashboard representing business results
Presenting this set of slides with name Sales Performance Dashboard Representing Business Results. The topics discussed in these slides are New Customers, Sales Revenue, Profit. This is a completely editable PowerPoint presentation and is available for immediate download. Download now and impress your audience.
-
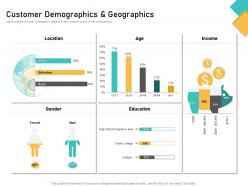 How visually map content strategy brand customer demographics and geographics ppt file graphics
Use this editable customer demographics template to get a complete picture of their characteristics. Present the topic in a bit more detail with this How Visually Map Content Strategy Brand Customer Demographics And Geographics Ppt File Graphics. Use it as a tool for discussion and navigation on Location, Income, Education. This template is free to edit as deemed fit for your organization. Therefore download it now.
-
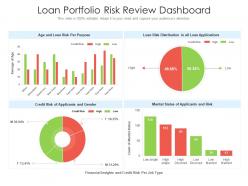 Loan portfolio risk review dashboard
Introducing our Loan Portfolio Risk Review Dashboard set of slides. The topics discussed in these slides are Loan Portfolio Risk Review Dashboard. This is an immediately available PowerPoint presentation that can be conveniently customized. Download it and convince your audience.
-
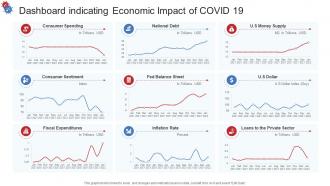 Dashboard Snapshot Indicating Economic Impact Of COVID 19
This graph or chart is linked to excel, and changes automatically based on data. Just left click on it and select Edit Data. Introducing our Dashboard Snapshot Indicating Economic Impact Of COVID 19 set of slides. The topics discussed in these slides are Consumer Spending, National Debt, US Money Supply, Consumer Sentiment, Fed Balance Sheet, Inflation Rate, Fiscal Expenditures, Loans Private Sector, US Dollar. This is an immediately available PowerPoint presentation that can be conveniently customized. Download it and convince your audience.
-
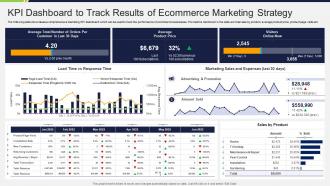 KPI Dashboard To Track Results Of Ecommerce Marketing Strategy
The following slide showcases a comprehensive marketing KPI dashboard which can be used to track the performance of ecommerce businesses. The metrics mentioned in the slide are total sale by product, average product price, product page visits etc. Introducing our KPI Dashboard To Track Results Of Ecommerce Marketing Strategy set of slides. The topics discussed in these slides are Average Product Price, Visitors Online Now, Sales By Product, Marketing Sales And Expenses Last 30 Days. This is an immediately available PowerPoint presentation that can be conveniently customized. Download it and convince your audience.
-
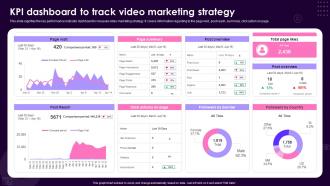 KPI Dashboard Snapshot To Track Video Marketing Strategy
This slide signifies the key performance indicator dashboard to measure video marketing strategy. It covers information regarding to the page visit, post reach, summary, click action on page. Introducing our KPI Dashboard Snapshot To Track Video Marketing Strategy set of slides. The topics discussed in these slides are KPI Dashboard, Video Marketing Strategy. This is an immediately available PowerPoint presentation that can be conveniently customized. Download it and convince your audience.
-
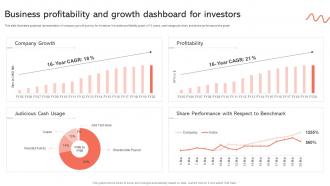 Business Profitability And Growth Dashboard For Investors
This slide illustrates graphical representation of company growth journey for investors. It includes profitability graph of 15 years, cash usage pie chart, and share performance line graph. Introducing our Business Profitability And Growth Dashboard For Investors set of slides. The topics discussed in these slides are Company Growth, Profitability, Share Performance. This is an immediately available PowerPoint presentation that can be conveniently customized. Download it and convince your audience.
-
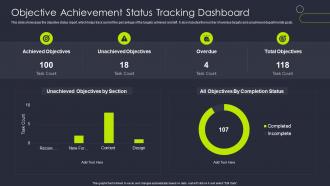 Objective Achievement Status Tracking Dashboard
This slide showcases the objective status report, which helps track current the percentage of the targets achieved and left. It also includes the number of overdue targets and unachieved departmental goals. Introducing our Objective Achievement Status Tracking Dashboard set of slides. The topics discussed in these slides are Achieved Objectives, Unachieved Objectives, Overdue, Total Objectives. This is an immediately available PowerPoint presentation that can be conveniently customized. Download it and convince your audience.
-
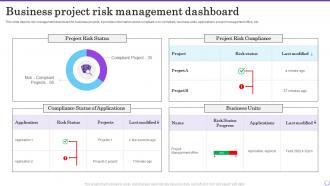 Business Project Risk Management Dashboard
This slide depicts risk management dashboard for business projects. It provides information about compliant, non compliant, business units, applications, project management office, etc. Introducing our Business Project Risk Management Dashboard set of slides. The topics discussed in these slides are Project Risk Status, Project Risk Compliance, Business Units. This is an immediately available PowerPoint presentation that can be conveniently customized. Download it and convince your audience.
-
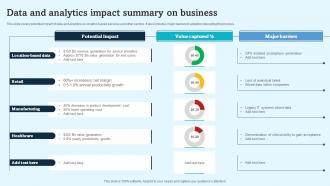 Data And Analytics Impact Summary On Business
This slide covers potential impact of data and analytics on location based services and other sectors. It also includes major barriers to adoption disrupting the process. Introducing our Data And Analytics Impact Summary On Business set of slides. The topics discussed in these slides are Manufacturing, Potential Impact, Data And Analytics. This is an immediately available PowerPoint presentation that can be conveniently customized. Download it and convince your audience.
-
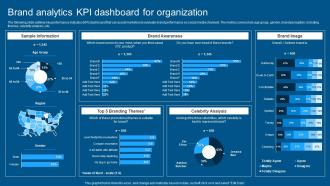 Complete Guide To Conduct Market Brand Analytics KPI Dashboard For Organization
The following slide outlines key performance indicator KPI dashboard that can assist marketers to evaluate brand performance on social media channels. The metrics covered are age group, gender, brand perception, branding themes, celebrity analysis, etc. Present the topic in a bit more detail with this Complete Guide To Conduct Market Brand Analytics KPI Dashboard For Organization. Use it as a tool for discussion and navigation on Brand Awareness, Branding Themes, Celebrity Analysis. This template is free to edit as deemed fit for your organization. Therefore download it now.
-
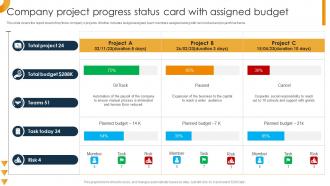 Company Project Progress Status Card With Assigned Budget
This slide covers the report sheet of top three companys projects. It further includes budget assigned, team members assigned along with risk involved and project time frame. Introducing our Company Project Progress Status Card With Assigned Budget set of slides. The topics discussed in these slides are Total Budget, Project, Company Project. This is an immediately available PowerPoint presentation that can be conveniently customized. Download it and convince your audience.
-
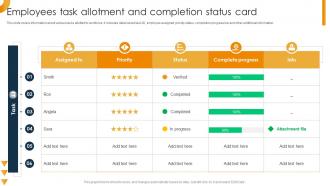 Employees Task Allotment And Completion Status Card
This slide covers information about various tasks allotted to workforce. It includes detail about task ID, employee assigned, priority status, completion progress bar and other additional information. Introducing our Employees Task Allotment And Completion Status Card set of slides. The topics discussed in these slides are Employees Task, Completion Status, Complete Progress. This is an immediately available PowerPoint presentation that can be conveniently customized. Download it and convince your audience.
-
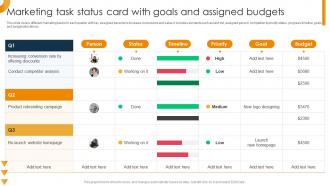 Marketing Task Status Card With Goals And Assigned Budgets
This slide covers different marketing tasks for each quarter with key assigned persons to increase conversions and sales. It includes elements such as task list, assigned person, completion and priority status, progress timeline, goals and budget allocations. Presenting our well structured Marketing Task Status Card With Goals And Assigned Budgets. The topics discussed in this slide are Marketing Task, Card With Goals, Assigned Budgets. This is an instantly available PowerPoint presentation that can be edited conveniently. Download it right away and captivate your audience.
-
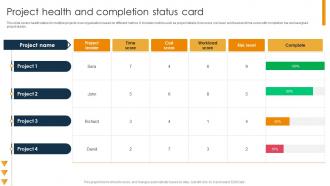 Project Health And Completion Status Card
This slide covers health status for multiple projects in an organization based on different metrics. It includes metrics such as project details, time score, risk level, workload and time score with completion bar and assigned project leader. Presenting our well structured Project Health And Completion Status Card. The topics discussed in this slide are Project, Workload Score, Risk Level. This is an instantly available PowerPoint presentation that can be edited conveniently. Download it right away and captivate your audience.
-
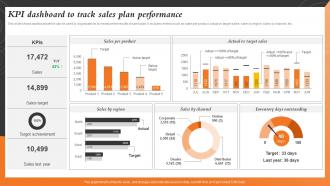 KPI Dashboard To Track Sales Plan Sales And Marketing Alignment For Business Strategy SS V
This slide shows dashboard which can be used by organizations to measure the results of sales plan. It includes metrics such as sales per product, actual vs target sales, sales by region, sales by channel, etc. Deliver an outstanding presentation on the topic using this KPI Dashboard To Track Sales Plan Sales And Marketing Alignment For Business Strategy SS V. Dispense information and present a thorough explanation of Product, Target, Performance using the slides given. This template can be altered and personalized to fit your needs. It is also available for immediate download. So grab it now.
-
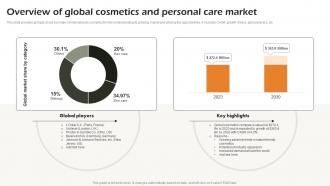 Overview Of Global Cosmetics And Personal Care Market Business Strategic Analysis Strategy SS V
This slide provides glimpse about summary of international cosmetics firm for understanding its growing market and utilizing the opportunities. It includes CAGR, growth drivers, global players, etc. Present the topic in a bit more detail with this Overview Of Global Cosmetics And Personal Care Market Business Strategic Analysis Strategy SS V. Use it as a tool for discussion and navigation on Global Players, Overview, Global Cosmetics. This template is free to edit as deemed fit for your organization. Therefore download it now.
-
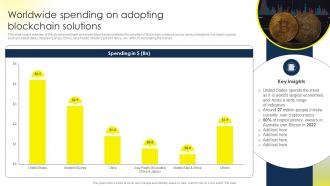 Worldwide Spending On Adopting Blockchain Comprehensive Guide To Blockchain BCT SS
This slide covers overview of the global investment and expenditure trends related to the adoption of blockchain solutions across various industries. It includes regions such as United states, Western Europe, China, Asia Pacific, Middle East and Africa, etc. with US dominating the market. Deliver an outstanding presentation on the topic using this Worldwide Spending On Adopting Blockchain Comprehensive Guide To Blockchain BCT SS. Dispense information and present a thorough explanation of Worldwide Spending, Adopting Blockchain Solutions using the slides given. This template can be altered and personalized to fit your needs. It is also available for immediate download. So grab it now.
-
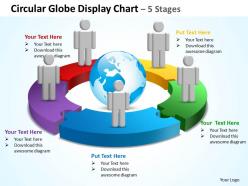 Circular globe display chart 5 stages powerpoint diagrams presentation slides graphics 0912
You can use the graph to represent global business issues such as financial data, stock market surge, increase in sales, corporate presentations and more..
-
 0115 human hand with dollar and bulb powerpoint template
We are proud to present our 0115 human hand with dollar and bulb powerpoint template. In this power point template two human hand graphic has been used to show the concept of financial growth and idea generation for it. This PPT also contains the graphic of dollar and bulb to justify the concept. Use this PPT for your business and finance related presentations.
-
 Lp real estate balance with finance flat powerpoint design
Presenting lp real estate balance with finance flat powerpoint design. This Power Point template diagram has been crafted with graphic of balance scale and house diagram. This PPT diagram contains the concept of balance between house and real estate .Use this PPT diagram for business and real estate related presentations.
-
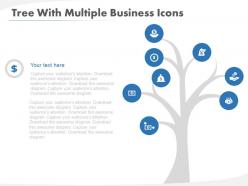 Tree with multiple business icons flat powerpoint design
Presenting tree with multiple business icons flat powerpoint design. This Power Point template diagram slide has been crafted with graphic of tree and multiple business icons diagram. This PPT diagram slide contains the concept of business process flow representation .Use this PPT slide for business and finance related presentations.
-
 Financial services regulation model ppt examples
Presenting financial services regulation model ppt examples. This is a financial services regulation model ppt examples. This is a eight stage process. The stages in this process are regulation, ownership, size and complexity, history, risk policy, incentives policy, geographical mix, business model.
-
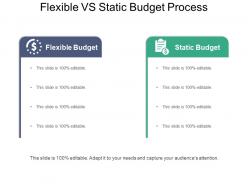 Flexible vs static budget process powerpoint slide clipart
Showing Flexible Vs. Static Budget Process PowerPoint Slide. This is an expertly composed PPT format very helpful for the business and financial experts. Amendable shapes, examples, and topics. Pertinent PPT Images with flexible alternatives to embed subtitles or sub-inscription. Smooth Downloads. Runs easily with all accessible software's. Astounding Picture Presentation designs which stay unaffected when anticipated on widescreen or Google Slides.
-
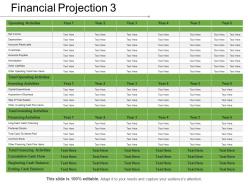 Financial projection 3 presentation portfolio
Presenting Financial Projection 3 Presentation Portfolio. You can easily download this template to access its full version. This template allows you to resize it and make changes in the fonts, colors, images, icons as per your needs. This slide is compatible with Google Slides and other formats such as PDF, JPG, and PNG. The slide designs are available in both the sizes- standard(4:3) and widescreen(16:9).
-
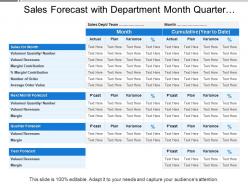 Sales forecast with department month quarter yearly revenue
Presenting this set of slides with name - Sales Forecast With Department Month Quarter Yearly Revenue. This is a two stage process. The stages in this process are Forecast Revenue, Sales Projections, Sales Forecast.
-
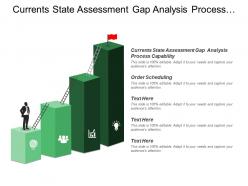 Currents state assessment gap analysis process capability order scheduling
Presenting this set of slides with name - Currents State Assessment Gap Analysis Process Capability Order Scheduling. This is an editable four stages graphic that deals with topics like Currents State Assessment Gap Analysis Process Capability, Order Scheduling to help convey your message better graphically. This product is a premium product available for immediate download, and is 100 percent editable in Powerpoint. Download this now and use it in your presentations to impress your audience.
-
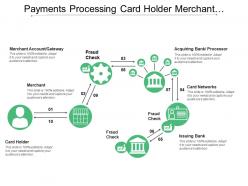 Payments processing card holder merchant acquiring fraud check
Presenting, our payments processing cardholder merchant acquiring fraud check PPT deck. Comprised of a high-resolution PowerPoint slides to address the payment process related concepts. Content is suitable and flexible and can easily be converted to JPG and PDF format. Edit the background color, layout, font shape, and size. Enter your data and edit the text. Fit to be used by business professionals, students, and researchers. Easy to incorporate your business name and logo in the slide. Widescreen friendly and accessible in both standard 4:3 and fullscreen versions 16:9.
-
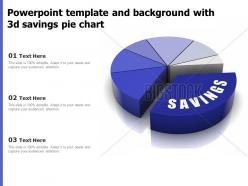 Powerpoint template and background with 3d savings pie chart
Present your findings by deploying our pre-designed template. Highlight the critical features of the subject quickly and amplify the productivity level using our Powerpoint Template And Background With 3d Savings Pie Chart. With the help of this professionally designed presentation, you can present the data using illustrations to keep your audience engaged. The design elements of this contemporary PPT slide enhances the overall appeal of your presentation. Do not miss any important detail and streamline your subject matter by employing our customizable Powerpoint Template And Background With 3d Savings Pie Chart. As this template is content-ready, just a few edits will do the trick. Download this fully-equipped PPT theme to deliver an impressive presentation and grab the audiences attention instantly. Any industry can adopt this versatile PowerPoint template. Empower yourself with our ready-made PPT layout comprising high-resolution design elements to deliver your content impactfully. Introduce this well-researched PPT theme in your business structure to get noticed. Therefore, steal the show and leave a great impression by downloading this content-ready presentation.
-
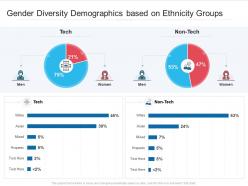 Gender diversity demographics based on ethnicity groups
Presenting our well structured Gender Diversity Demographics Based On Ethnicity Groups. The topics discussed in this slide are Gender Diversity Demographics Based On Ethnicity Groups. This is an instantly available PowerPoint presentation that can be edited conveniently. Download it right away and captivate your audience.
-
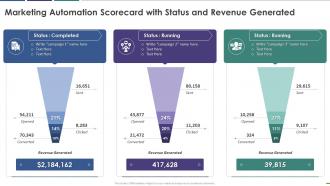 Marketing automation scorecard with status and revenue generated
This graph or chart is linked to excel, and changes automatically based on data. Just left click on it and select Edit Data. Introducing Marketing Automation Scorecard With Status And Revenue Generated to increase your presentation threshold. Encompassed with three stages, this template is a great option to educate and entice your audience. Dispence information on Completed, Running, Revenue Generated, using this template. Grab it now to reap its full benefits.
-
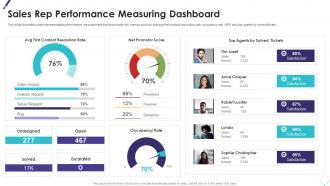 Sales Rep Performance Measuring Dashboard Improving Planning Segmentation
This slide illustrates sales representative performance measurement dashboard with key metrics such as average first contact resolution rate, occupancy rate, NPS and top agents by solved tickets. Present the topic in a bit more detail with this Sales Rep Performance Measuring Dashboard Improving Planning Segmentation. Use it as a tool for discussion and navigation on Unassigned, Solved, Escalated, Open. This template is free to edit as deemed fit for your organization. Therefore download it now.
-
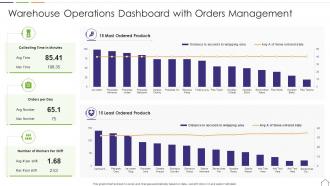 Warehouse Operations Dashboard With Orders Management
This graph or chart is linked to excel, and changes automatically based on data. Just left click on it and select edit data. Presenting our well structured Warehouse Operations Dashboard With Orders Management. The topics discussed in this slide are Collecting Time in Minutes, 15 Most Ordered Products, Orders per Day, Number of Workers Per Shift, 15 Least Ordered Products. This is an instantly available PowerPoint presentation that can be edited conveniently. Download it right away and captivate your audience.
-
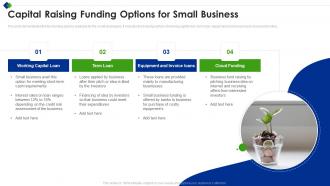 Capital Raising Funding Options For Small Business
This slide demonstrates the four funding options available for the small businesses. It includes fund raising options of working capital loan, term loan, equipment and invoice loans and cloud funding. Presenting our set of slides with name Capital Raising Funding Options For Small Business. This exhibits information on four stages of the process. This is an easy-to-edit and innovatively designed PowerPoint template. So download immediately and highlight information on Cloud Funding, Working Capital Loan, Equipment And Invoice Loans.
-
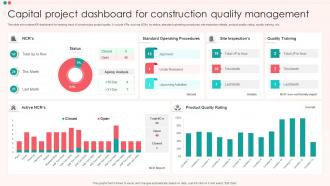 Capital Project Dashboard For Construction Quality Management
This slide showcases KPI dashboard for keeping track of construction project quality. It include KPIs such as NCRs by status, standard operating procedures, site inspection details, product quality rating, quality training, etc. Presenting our well-structured Capital Project Dashboard For Construction Quality Management. The topics discussed in this slide are Capital Project Dashboard, Construction Quality Management. This is an instantly available PowerPoint presentation that can be edited conveniently. Download it right away and captivate your audience.
-
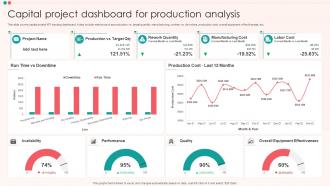 Capital Project Dashboard For Production Analysis
This slide covers capital project KPI tracking dashboard. It also include metrics such as production vs. target quantity, manufacturing, runtime vs. downtime, production cost, overall equipment effectiveness, etc. Presenting our well-structured Capital Project Dashboard For Production Analysis. The topics discussed in this slide are Availability, Performance, Quality, Overall Equipment Effectiveness. This is an instantly available PowerPoint presentation that can be edited conveniently. Download it right away and captivate your audience.
-
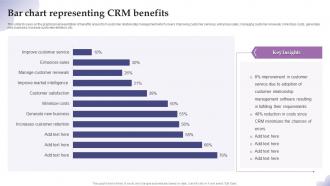 Bar Chart Representing CRM Benefits
This slide focuses on the graphical representation of benefits arises from customer relationship management which covers improving customer services, enhances sales, managing customer renewals, minimizes costs, generates new business, increase customer retention, etc. Introducing our Bar Chart Representing CRM Benefits set of slides. The topics discussed in these slides are Bar chart representing, CRM benefits. This is an immediately available PowerPoint presentation that can be conveniently customized. Download it and convince your audience.
-
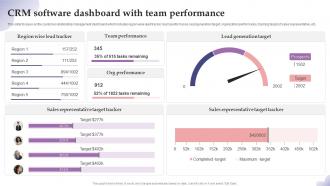 CRM Software Dashboard With Team Performance
This slide focuses on the customer relationship management dashboard which includes region wise lead tracker, team performance, lead generation target, organization performance, tracking target of sales representative, etc. Introducing our CRM Software Dashboard With Team Performance set of slides. The topics discussed in these slides are CRM Software, Dashboard, Team Performance. This is an immediately available PowerPoint presentation that can be conveniently customized. Download it and convince your audience.
-
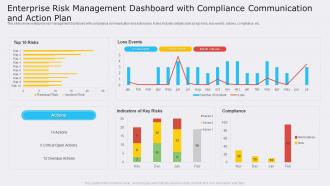 Enterprise Risk Management Dashboard With Compliance Communication And Action Plan
This slide shows enterprise risk management dashboard with compliance communication and action plan. It also includes details such as top risks, loss events, actions, compliance, etc. Introducing our Enterprise Risk Management Dashboard With Compliance Communication And Action Plan set of slides. The topics discussed in these slides are Enterprise Risk Management, Dashboard, Compliance Communication, Action Plan. This is an immediately available PowerPoint presentation that can be conveniently customized. Download it and convince your audience.


