Finance PowerPoint Templates, Presentation Slide Diagrams & PPT Graphics
- Sub Categories
-
- 30 60 90 Day Plan
- Advertising
- Agile Development
- Aims and Objectives
- Arrows
- Before and After
- Blockchain Bitcoin
- Boxes
- Business
- Calender
- Case Study
- Celebrations
- Certificates
- Challenges Opportunities
- Channel Distribution
- Children
- Communication
- Competitive Landscape
- Computer
- Concepts
- Construction Management
- Corporate
- Crowdfunding
- Current State Future State
- Custom PowerPoint Diagrams
- Digital Transformation
- Dos and Donts
- Economics
- Education
- Environment
- Events
- Festival
- Finance
- Financials
- Food
- Game
- Gap Analysis
- Generic
- Geographical
- Health
- Heatmaps
- Holidays
- Icons
- Input Process Output
- Internet
- Key Messages
- Key Wins
- Ladder
- Leadership
- Lists
- Lucky Draw
- Management
- Marketing
- Measuring
- Medical
- Music
- News
- Next Steps
- People Process Technology
- Pillars
- Planning
- Post-it-Notes
- Problem Statement
- Process
- Proposal Management
- Pros and Cons
- Puzzle
- Puzzles
- Recruitment Strategy
- Religion
- Research and Development
- Risk Mitigation Strategies
- Roadmap
- Selling
- Shapes
- Short Term Long Term
- Social
- Stairs
- Start Stop Continue
- Strategy
- Symbol
- Technology
- Thesis Defense Dissertation
- Timelines
- Traffic
- Transition Plan
- Transportation
- Vehicles
- Venture Capital Funding
- Warning
- Winners
- Word Cloud
-
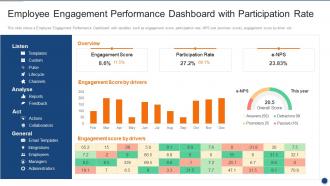 Implementing Employee Engagement Employee Engagement Performance Dashboard With Participation
This slide shows a Employee Engagement Performance Dashboard with variables such as engagement score, participation rate, NPS net promoter score, engagement score by driver etc. Present the topic in a bit more detail with this Implementing Employee Engagement Employee Engagement Performance Dashboard With Participation. Use it as a tool for discussion and navigation on Overview, Engagement Score, Participation Rate, Engagement Score By Drivers. This template is free to edit as deemed fit for your organization. Therefore download it now.
-
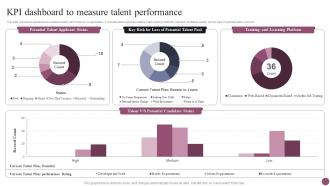 KPI Dashboard To Measure Talent Performance Employee Management System
This slide represents dashboard to measure talent performance in organization. It includes talent applicant status, team training methods, talented candidate status, risk for loss of potential talent pool etc. Present the topic in a bit more detail with this KPI Dashboard To Measure Talent Performance Employee Management System. Use it as a tool for discussion and navigation on Dashboard, Measure Talent Performance, Learning Platform. This template is free to edit as deemed fit for your organization. Therefore download it now.
-
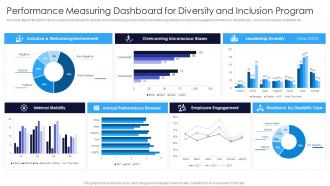 Performance Measuring Dashboard For Diversity And Inclusion Multicultural Diversity Development
This slide depicts the performance measuring dashboard for diversity and inclusion program providing information regarding the employee engagement,workforce by disability type, unconscious biases complaints etc. Present the topic in a bit more detail with this Performance Measuring Dashboard For Diversity And Inclusion Multicultural Diversity Development. Use it as a tool for discussion and navigation on Welcoming Environment, Overcoming Unconscious, Leadership Diversity. This template is free to edit as deemed fit for your organization. Therefore download it now.
-
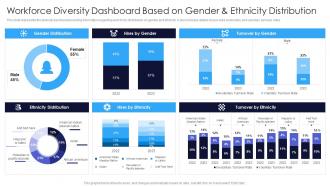 Workforce Diversity Dashboard Based On Gender And Ethnicity Multicultural Diversity Development
This slide represents the diversity dashboard providing information regarding work force distribution on gender and ethnicity. It also includes details of year wise involuntary and voluntary turnover rates. Deliver an outstanding presentation on the topic using this Workforce Diversity Dashboard Based On Gender And Ethnicity Multicultural Diversity Development. Dispense information and present a thorough explanation of Gender Distribution, Ethnicity Distribution, Ethnicity Distribution using the slides given. This template can be altered and personalized to fit your needs. It is also available for immediate download. So grab it now.
-
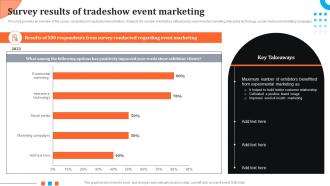 Survey Results Of Tradeshow Event Marketing Event Advertising Via Social Media Channels MKT SS V
This slide provides an overview of the survey conducted among tradeshow exhibitors. It depicts the number of exhibitors influenced by experimental marketing, interactive technology, social media and marketing campaigns. Deliver an outstanding presentation on the topic using this Survey Results Of Tradeshow Event Marketing Event Advertising Via Social Media Channels MKT SS V Dispense information and present a thorough explanation of Experimental Marketing, Customer Relationship using the slides given. This template can be altered and personalized to fit your needs. It is also available for immediate download. So grab it now.
-
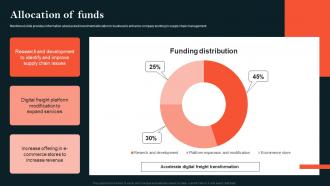 Allocation Of Funds Convoy Investor Funding Elevator Pitch Deck
Mentioned slide provides information about asked investment allocation in business to enhance company working in supply chain management. Present the topic in a bit more detail with this Allocation Of Funds Convoy Investor Funding Elevator Pitch Deck. Use it as a tool for discussion and navigation on Development, Identify, Modification. This template is free to edit as deemed fit for your organization. Therefore download it now.
-
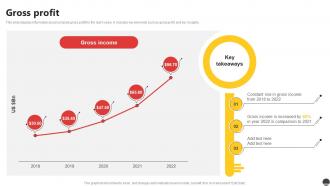 Gross Profit E Commerce Company Profile Ppt Infographics CP SS
This slide displays information about company gross profit for the last 5 years. It includes key elements such as gross profit, and key insights. Present the topic in a bit more detail with this Gross Profit E Commerce Company Profile Ppt Infographics CP SS. Use it as a tool for discussion and navigation on Gross Income. This template is free to edit as deemed fit for your organization. Therefore download it now.
-
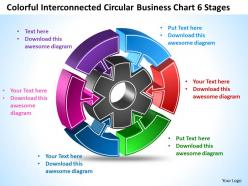 Coloful interconnected circular business chart 6 stages templates ppt presentation slides 812
By using this diagram You can build confidence among audience by providing strong visual clues as to how things fit together and how very different projects contribute to the same outcome
-
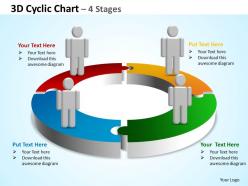 3d cyclic chart 4 stages powerpoint diagrams presentation slides graphics 0912
3D Cyclic Chart in red, green, blue and yellow color can be helpful on explaining four different approaches for business process
-
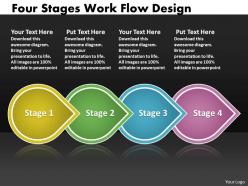 Ppt four stages work flow interior design powerpoint template business templates 4 stages
With this chart you can visualize developments in different timeframes. You can compare different trends and display progress with this professional PPT slide.
-
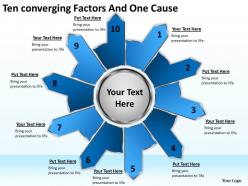 Ten converging factors and one cause cycle process diagram powerpoint templates
Create visually stunning and define your PPT Presentations in a unique and inspiring manner using our above Template which contains a graphic of ten factors converging to one noble Cause. It is Designed to help bullet-point your views and thoughts. You can apply other 3D Styles and shapes to the slide to enhance your presentations.
-
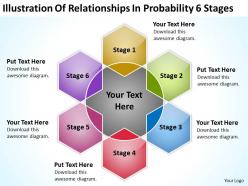 Business process diagram vision of relationships probability 6 stages powerpoint templates
We are proud to present our business process diagram vision of relationships probability 6 stages powerpoint templates. Create dynamic Microsoft office PPT Presentations with our professional templates containing a graphic of overlapping relationship. This PowerPoint Diagram is used to illustrate simple set relationships in probability, logic, statistics, and linguistics and computer science. Use this diagram for business processes and management presentations.
-
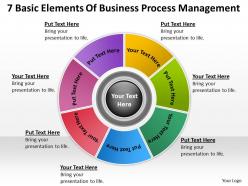 Diagram of the business cycle 7 basic elements process management powerpoint slides
We are proud to present our diagram of the business cycle 7 basic elements process management powerpoint slides. The above PowerPoint diagram contains seven basic elements of business process. Use this diagram for strategic management, tasks management, processes, process steps, project management and process planning. Create captivating presentations to deliver comparative and weighted arguments.
-
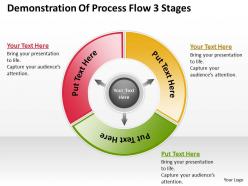 Powerpoint for business demonstration of process flow 3 stages templates
We are proud to present our powerpoint for business demonstration of process flow 3 stages templates. Create visually stunning and define your PPT Presentations in a unique and inspiring manner using our above template. This diagram is good for continual improvement, phases of processes, aparting into main parts, logical processes, management, product lifecycle and cyclic processes. You can change color, size and orientation of any icon to your liking.
-
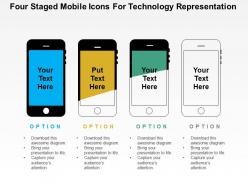 Four staged mobile icons for technology representation flat powerpoint design
We are proud to present our four staged mobile icons for technology representation flat powerpoint design. Four staged mobile and technology icons has been used to craft this power point template diagram. This PPT diagram contains the concept of technology application. Use this PPT diagram for business and mobile technology related presentations.
-
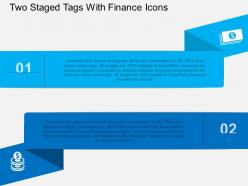 Dh two staged tags with finance icons flat powerpoint design
Presenting dh two staged tags with finance icons flat powerpoint design. Two staged tags and finance icons have been used to craft this power point template diagram. This PPT diagram contains the concept of financial data and process flow representation. Use this PPT diagram for business and finance related presentations.
-
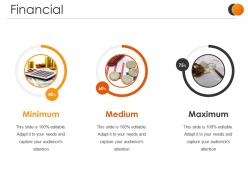 Financial presentation images
Presenting our Financial Presentation Images PowerPoint Presentation Slide. This is a 100% editable and adaptable PPT slide. You can save it in different formats like PDF, JPG, and PNG. It can be edited with different colors, fonts, font sizes, and font types of the template as per your requirements. This template supports the standard (4:3) and widescreen (16:9) format. It is also compatible with Google Slides.
-
 Budget icon dollar bulb
Presenting budget icon dollar bulb. This is a budget icon dollar bulb. This is a six stage process. The stages in this process are budget icon, fund icon, expense icon.
-
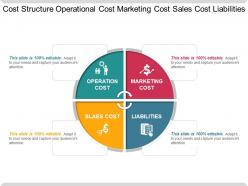 Cost structure operational cost marketing cost sales cost liabilities
Presenting cost structure operational cost marketing cost sales cost liabilities. This is a cost structure operational cost marketing cost sales cost liabilities. This is a four stage process. The stages in this process are cost structure, budget framework, fun model.
-
 Opportunity cost three options with dollar
Presenting this Opportunity Cost Three Options with Dollar PowerPoint presentation. Add charts and graphs for a clear representation of facts. The slide supports the standard (4:3) and widescreen (16:9) aspect ratios. It is compatible with Google Slides. Save this into common images or document formats including JPEG, PNG or PDF. High-quality graphics always retain the original quality.
-
 Banking product icon locked safe vault
Presenting banking product icon locked safe vault. This is a banking product icon locked safe vault. This is a four stage process. The stages in this process are banking product icons, financial product icons.
-
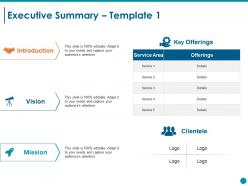 Executive summary ppt styles file formats
Presenting this set of slides with name - Executive Summary Ppt Styles File Formats. This is a three stage process. The stages in this process are Introduction, Vision, Mission, Clientele, Key Offerings.
-
 Employee work environment survey staff meeting agenda template cpb
Presenting this set of slides with name - Employee Work Environment Survey Staff Meeting Agenda Template Cpb. Employee Work Environment Survey Staff Meeting Agenda Template Cpb. This is an editable two stages graphic that deals with topics like Employee Work Environment Survey, Staff Meeting Agenda Template to help convey your message better graphically. This product is a premium product available for immediate download, and is 100 percent editable in Powerpoint. Download this now and use it in your presentations to impress your audience.
-
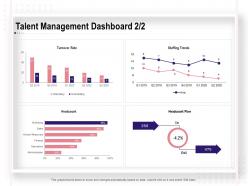 Talent management dashboard snapshot turnover rate ppt powerpoint presentation styles
Presenting this set of slides with name Talent Management Dashboard Snapshot Turnover Rate Ppt Powerpoint Presentation Styles. The topics discussed in these slides are Turnover Rate, Staffing Trends, Headcount, Headcount Flow. This is a completely editable PowerPoint presentation and is available for immediate download. Download now and impress your audience.
-
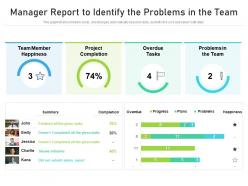 Manager report to identify the problems in the team
This graph or chart is linked to excel, and changes automatically based on data. Just left click on it and select edit data. Introducing our Manager Report To Identify The Problems In The Team set of slides. The topics discussed in these slides are Project Completion, Overdue Tasks, Completion. This is an immediately available PowerPoint presentation that can be conveniently customized. Download it and convince your audience.
-
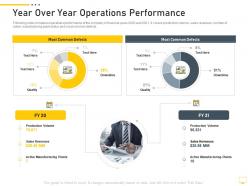 Year over year operations performance digital transformation of workplace
Following slide compares operations performance of the company in financial years 2020 and 2021. It covers production volume, sales revenues, number of active manufacturing plant status and most common defects. Present the topic in a bit more detail with this Year Over Year Operations Performance Digital Transformation Of Workplace. Use it as a tool for discussion and navigation on Production Volume, Sales Revenues, Active Manufacturing Plants. This template is free to edit as deemed fit for your organization. Therefore download it now.
-
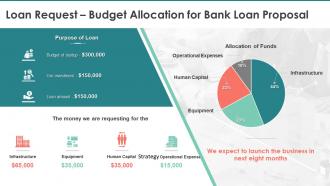 Loan request budget allocation for bank loan proposal ppt slides show
Present the topic in a bit more detail with this Loan Request Budget Allocation For Bank Loan Proposal Ppt Slides Show. Use it as a tool for discussion and navigation on Operational Expenses, Human Capital, Equipment, Infrastructure. This template is free to edit as deemed fit for your organization. Therefore download it now.
-
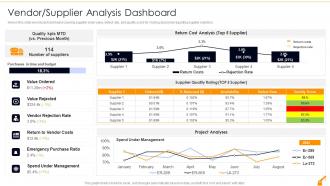 Vendor Supplier Analysis Dashboard Risk Management In Commercial Building
Here in this slide we include Dashboard covering supplier order value, defect rate, and quality score for making decisions regarding supplier selection. Present the topic in a bit more detail with this Vendor Supplier Analysis Dashboard Risk Management In Commercial Building. Use it as a tool for discussion and navigation on Vendor Supplier Analysis Dashboard. This template is free to edit as deemed fit for your organization. Therefore download it now.
-
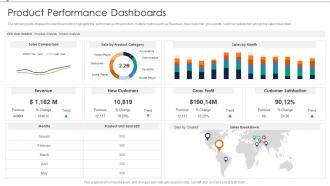 Product Performance Dashboards Annual Product Performance Report Ppt Rules
The following slide displays the dashboard which highlights the performance of the product, multiple metrics such as Revenues, New customer, gross profit, customer satisfaction and global sales breakdown. Deliver an outstanding presentation on the topic using this Product Performance Dashboards Annual Product Performance Report Ppt Rules. Dispense information and present a thorough explanation of Product Performance Dashboards using the slides given. This template can be altered and personalized to fit your needs. It is also available for immediate download. So grab it now.
-
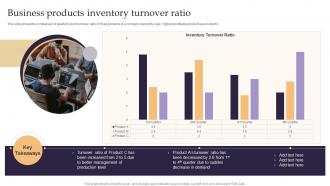 Business Products Inventory Turnover Ratio
This slide shows the comparison of quarterly stock turnover ratio of three products of a company during the year. Highest profitable product was product C Presenting our well-structured Business Products Inventory Turnover Ratio. The topics discussed in this slide are Business Products, Inventory, Turnover Ratio. This is an instantly available PowerPoint presentation that can be edited conveniently. Download it right away and captivate your audience.
-
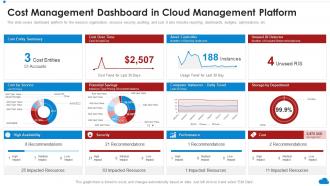 Cost Management Dashboard In Cloud Management Platform Cloud Architecture Review
This slide covers dashboard platform for the resource organization, resource security, auditing, and cost. It also includes reporting, dashboards, budgets, optimizations, etc. Deliver an outstanding presentation on the topic using this Cost Management Dashboard In Cloud Management Platform Cloud Architecture Review. Dispense information and present a thorough explanation of Cost Entity Summary, Cost Over Time, Asset Controller, Unused RI Detector using the slides given. This template can be altered and personalized to fit your needs. It is also available for immediate download. So grab it now.
-
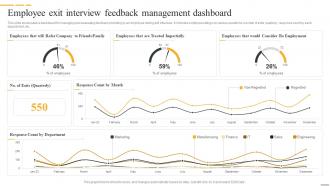 Employee Exit Interview Feedback Management Dashboard
This slide showcases a dashboard for managing and assessing feedback providing by an employee during exit interview. It includes employee ratings on various questions, number of exits quarterly, response count by each department, etc. Introducing our Employee Exit Interview Feedback Management Dashboard set of slides. The topics discussed in these slides are Response Count By Month, Response Count By Department, Treated Impartially. This is an immediately available PowerPoint presentation that can be conveniently customized. Download it and convince your audience.
-
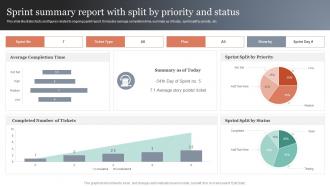 Sprint Summary Report With Split By Priority And Status
This slide illustrates facts and figures related to ongoing sprint report. It includes average completion time, summary as of today, sprint split by priority, etc. Introducing our Sprint Summary Report With Split By Priority And Status set of slides. The topics discussed in these slides are Average Completion, Completed Number, Sprint Split. This is an immediately available PowerPoint presentation that can be conveniently customized. Download it and convince your audience.
-
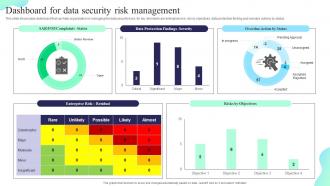 Dashboard For Data Security Risk Management Formulating Cybersecurity Plan
This slide showcases dashboard that can help organization in managing the data security risks. Its key elements are enterprise risk, risk by objectives, data protection finding and overdue actions by status. Present the topic in a bit more detail with this Dashboard For Data Security Risk Management Formulating Cybersecurity Plan. Use it as a tool for discussion and navigation on Data Protection, Dashboard, Data Security. This template is free to edit as deemed fit for your organization. Therefore download it now.
-
 Workplace Safety Dashboard To Monitor Incidents Manual For Occupational Health And Safety
This slide highlights the workplace safety dashboard which showcase incidents per employee, worksite incident total, incidents by total and top injuries by body part. Present the topic in a bit more detail with this Workplace Safety Dashboard To Monitor Incidents Manual For Occupational Health And Safety. Use it as a tool for discussion and navigation on Workplace Safety, Dashboard, Monitor Incidents. This template is free to edit as deemed fit for your organization. Therefore download it now.
-
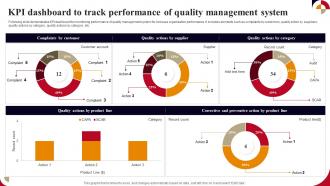 KPI Dashboard To Track Performance Of Quality Management System
Following slide demonstrates KPI dashboard for monitoring performance of quality management system for increase organisation performance. It includes elements such as complaints by customers, quality action by suppliers, quality actions by category, quality actions by category, etc. Presenting our well structured KPI Dashboard To Track Performance Of Quality Management System The topics discussed in this slide are Complaints By Customer, Quality Actions By Supplier, Quality Actions By Category This is an instantly available PowerPoint presentation that can be edited conveniently. Download it right away and captivate your audience.
-
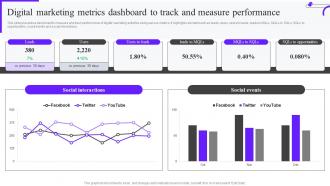 Digital Marketing Metrics Dashboard To Track And Measure Performance Mkt Ss V
This slide presents a dashboard to measure and track performance of digital marketing activities using various metrics. It highlights element such as leads, users, users to leads, leads to MQLs, MQLs to SQLs, SQLs to opportunities, social events and social interactions. Deliver an outstanding presentation on the topic using this Digital Marketing Metrics Dashboard To Track And Measure Performance Mkt Ss V. Dispense information and present a thorough explanation of Social Interactions, Social Events using the slides given. This template can be altered and personalized to fit your needs. It is also available for immediate download. So grab it now.
-
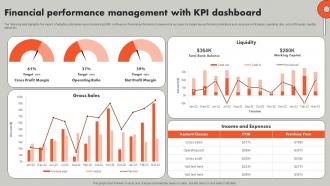 Financial Performance Management With Understanding ERP Software Implementation Procedure
The following slide highlights the impact of adopting enterprise resource planning ERP software on financial performance to measure its success. It includes key performance indicators such as gross profit margin, operating ratio, net profit margin, liquidity status etc. Deliver an outstanding presentation on the topic using this Financial Performance Management With Understanding ERP Software Implementation Procedure. Dispense information and present a thorough explanation of Management, Performance, Financial using the slides given. This template can be altered and personalized to fit your needs. It is also available for immediate download. So grab it now.
-
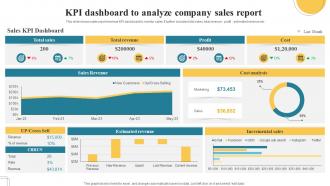 KPI Dashboard To Analyze Company Sales Report
This slide shows sales report revenue KPI dashboard to monitor sales. It further includes total sales, total revenue, profit, estimated revenue etc Introducing our KPI Dashboard To Analyze Company Sales Report set of slides. The topics discussed in these slides are Total Revenue, Incremental Sales. This is an immediately available PowerPoint presentation that can be conveniently customized. Download it and convince your audience.
-
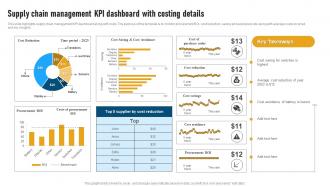 Supply Chain Management Kpi Dashboard With Costing Details
This slide highlights supply chain management KPI dashboard along with costs. The purpose of this template is to monitor procurement ROI, cost reduction, saving and avoidance rate along with average costs incurred and key insights. Presenting our well structured Supply Chain Management Kpi Dashboard With Costing Details. The topics discussed in this slide are Cost Reduction, Procurement Roi.This is an instantly available PowerPoint presentation that can be edited conveniently. Download it right away and captivate your audience.
-
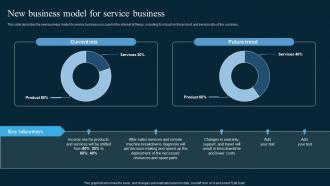 New Business Model For Service Business AI In Manufacturing
This slide describes the new business model for service business use case for the internet of things, including its impact on the product and service ratio of the company. Deliver an outstanding presentation on the topic using this New Business Model For Service Business AI In Manufacturing. Dispense information and present a thorough explanation of Product, Services, New Business Model, Service Business using the slides given. This template can be altered and personalized to fit your needs. It is also available for immediate download. So grab it now.
-
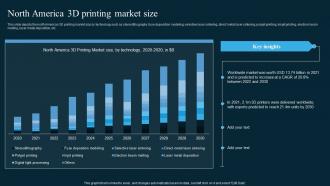 North America 3d Printing Market Size AI In Manufacturing
This slide depicts the north American 3D printing market size by technology such as stereolithography, fuse deposition modeling, selective laser sintering, direct metal laser sintering, polyjet printing, inkjet printing, electron beam melting, laser metal deposition, etc. Present the topic in a bit more detail with this North America 3d Printing Market Size AI In Manufacturing. Use it as a tool for discussion and navigation on North America, Printing Market. This template is free to edit as deemed fit for your organization. Therefore download it now.
-
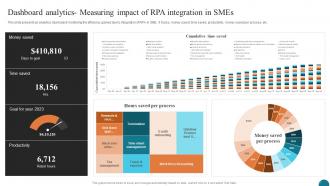 Dashboard Analytics Measuring Impact Elevating Small And Medium Enterprises Digital Transformation DT SS
This slide presents an analytics dashboard monitoring the efficiency gained due to integration of RPA in SME. It tracks, money saved, time saved, productivity, money saved per process, etc. Present the topic in a bit more detail with this Dashboard Analytics Measuring Impact Elevating Small And Medium Enterprises Digital Transformation DT SS. Use it as a tool for discussion and navigation on Tax Management, Termination, Travel And Expense. This template is free to edit as deemed fit for your organization. Therefore download it now.
-
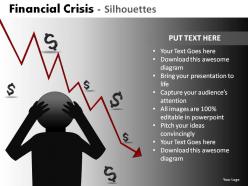 Financial crisis powerpoint presentation slides db
These high quality, editable pre-designed powerpoint slides and powerpoint templates have been carefully created by our professional team to help you impress your audience. Each graphic in every powerpoint slide is vector based and is 100% editable in powerpoint. Each and every property of any slide - color, size, shading etc can be modified to build an effective powerpoint presentation. Use these slides to convey complex business concepts in a simplified manner. Any text can be entered at any point in the powerpoint slide. Simply DOWNLOAD, TYPE and PRESENT
-
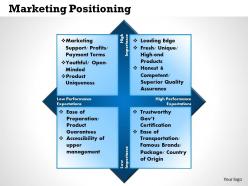 0514 marketing positioning powerpoint presentation
We are proud to present our 0514 marketing positioning powerpoint presentation. Develop competitive advantage with our above template. This image signifies the concept of marketing positioning. It is a useful powerful tool conceived to enable you to define your message in your business PPT presentations.
-
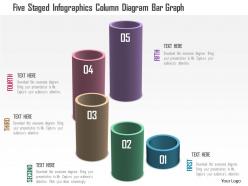 1214 five staged infographics column diagram bar graph powerpoint template
We are proud to present our 1214 five staged infographics column diagram bar graph powerpoint template. This power point image template has been designed with graphic of five staged info graphics column design are graph. This image template may be used for result analysis. Use this bar graph for your business and marketing related presentations.
-
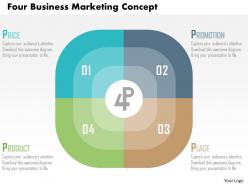 Four business marketing concept flat powerpoint design
Images can be added resized, colored and reversed. Color, style and position can be standardized, supports font size which can be read from a distance. PPT diagram is compatible with Microsoft 2010 and 2013 versions. Pre designed shapes help to save lot of time and effort. PowerPoint presentation can be used in business, sales, marketing and service sectors.
-
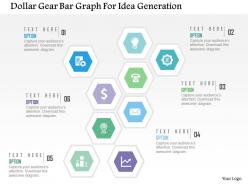 Dollar gear bar graph for idea generation flat powerpoint design
We are proud to present our dollar gear bar graph for idea generation flat powerpoint design. Concept of idea generation has been displayed in this power point template. This PPT diagram contain the graphic of dollar, gear and bar graph. Use this PPT diagram for business and finance related presentations.
-
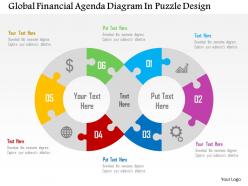 Global financial agenda diagram in puzzle design flat powerpoint design
We are proud to present our global financial agenda diagram in puzzle design flat powerpoint design. Concept of global financial agenda has been defined in this power point template diagram. This PPT diagram contains the graphic of two interconnected circular charts. Made with puzzles. Use this PPT diagram for business and data related presentations.
-
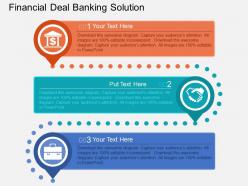 Pl financial deal banking solution flat powerpoint design
Presenting pl financial deal banking solution flat powerpoint design. This power point template diagram has been crafted with graphic of. This PPT diagram contains the concept of team management and result analysis. This PPT diagram can be used for business and marketing related presentations.
-
 Ce five staged colored infographics with financial icons flat powerpoint design
Presenting ce five staged colored infographics with financial icons flat powerpoint design. Five staged colored info graphics and financial icons has been used to design this power point template diagram. This PPT diagram contains the concept of finance data and process flow. Use this PPT diagram for business and finance related presentations.
-
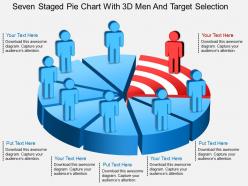 Fu seven staged pie chart with 3d men and target selection powerpoint template
Presenting fu seven staged pie chart with 3d men and target selection powerpoint template. Seven staged pie chart and 3d men has been used to craft this power point template diagram. This PPT diagram contains the concept of target selection. Use this PPT diagram for business and marketing related presentations.
-
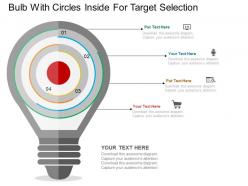 One bulb with circles inside for target selection flat powerpoint design
Presenting one bulb with circles inside for target selection flat powerpoint design. This Power Point template diagram has been crafted with graphic of bulb and circles diagram. This PPT diagram contains the concept of target selection .Use this PPT diagram for business and marketing related presentations.
-
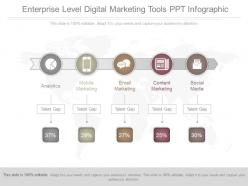 See enterprise level digital marketing tools ppt infographic
Presenting see enterprise level digital marketing tools ppt infographic. This is a enterprise level digital marketing tools ppt infographic. This is five stage process. The stages in this proces are analytics, mobile marketing, email marketing, content marketing, social media.
-
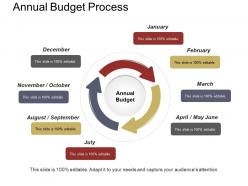 Annual budget process example of ppt
Presenting annual budget process example of PPT presentation slide. A user can convert the annual budget slide into JPEG or PDF format. This slide can be downloaded in standard screen and widescreen. Match it to your presentation theme by changing its colors, font size and font style. All our slides are compatible with Google Slides. Get this professionally designed PPT template now and create amazing presentations with ease.
-
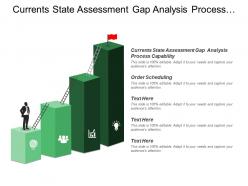 Currents state assessment gap analysis process capability order scheduling
Presenting this set of slides with name - Currents State Assessment Gap Analysis Process Capability Order Scheduling. This is an editable four stages graphic that deals with topics like Currents State Assessment Gap Analysis Process Capability, Order Scheduling to help convey your message better graphically. This product is a premium product available for immediate download, and is 100 percent editable in Powerpoint. Download this now and use it in your presentations to impress your audience.
-
 Revenue leakage shown by leaking bucket and dollars
Presenting this set of slides with name - Revenue Leakage Shown By Leaking Bucket And Dollars. This is a three stage process. The stages in this process are Revenue Leakage, Capital Leakage, Income Leakage.
-
 Online store with shopping cart
Presenting this set of slides with name - Online Store With Shopping Cart. This is a four stage process. The stages in this process are Online Store, Cash Card, Payment Card.
-
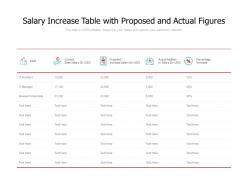 Salary increase table with proposed and actual figures
Presenting this set of slides with name Salary Increase Table With Proposed And Actual Figures. The topics discussed in these slides are Salary Increase, Finance, Marketing. This is a completely editable PowerPoint presentation and is available for immediate download. Download now and impress your audience.
-
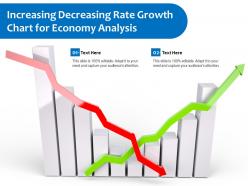 Increasing decreasing rate growth chart for economy analysis
Introducing our premium set of slides with Increasing Decreasing Rate Growth Chart For Economy Analysis. Ellicudate the two stage and present information using this PPT slide. This is a completely adaptable PowerPoint template design that can be used to interpret topics like Increasing Decreasing Rate Growth Chart For Economy Analysis. So download instantly and tailor it with your information.


