Finance PowerPoint Templates, Presentation Slide Diagrams & PPT Graphics
- Sub Categories
-
- 30 60 90 Day Plan
- Advertising
- Agile Development
- Aims and Objectives
- Arrows
- Before and After
- Blockchain Bitcoin
- Boxes
- Business
- Calender
- Case Study
- Celebrations
- Certificates
- Challenges Opportunities
- Channel Distribution
- Children
- Communication
- Competitive Landscape
- Computer
- Concepts
- Construction Management
- Corporate
- Crowdfunding
- Current State Future State
- Custom PowerPoint Diagrams
- Digital Transformation
- Dos and Donts
- Economics
- Education
- Environment
- Events
- Festival
- Finance
- Financials
- Food
- Game
- Gap Analysis
- Generic
- Geographical
- Health
- Heatmaps
- Holidays
- Icons
- Input Process Output
- Internet
- Key Messages
- Key Wins
- Ladder
- Leadership
- Lists
- Lucky Draw
- Management
- Marketing
- Measuring
- Medical
- Music
- News
- Next Steps
- People Process Technology
- Pillars
- Planning
- Post-it-Notes
- Problem Statement
- Process
- Proposal Management
- Pros and Cons
- Puzzle
- Puzzles
- Recruitment Strategy
- Religion
- Research and Development
- Risk Mitigation Strategies
- Roadmap
- Selling
- Shapes
- Short Term Long Term
- Social
- Stairs
- Start Stop Continue
- Strategy
- Symbol
- Technology
- Thesis Defense Dissertation
- Timelines
- Traffic
- Transition Plan
- Transportation
- Vehicles
- Venture Capital Funding
- Warning
- Winners
- Word Cloud
-
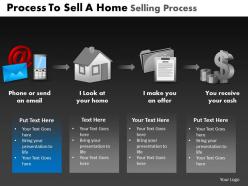 Process to sell a home selling process powerpoint slides and ppt templates db
These high quality, editable pre-designed powerpoint slides and powerpoint templates have been carefully created by our professional team to help you impress your audience. Each graphic in every powerpoint slide is vector based and is 100% editable in powerpoint.Each and every property of any slide - color, size, shading etc can be modified to build an effective powerpoint presentation. Use these slides to convey complex business concepts in a simplified manner. Any text can be entered at any point in the powerpoint slide. Simply DOWNLOAD, TYPE and PRESENT
-
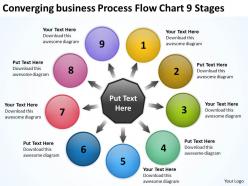 Business powerpoint theme process flow chart 9 stages cycle slides
This diagram allows you to pull nodes from the database and display them as you find it fit for your presentation. This diagram is designed to help your audience to develop their thoughts along the way.
-
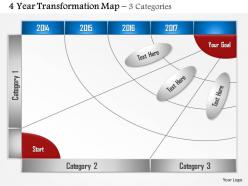 0514 3 category 4 year transformation map
We are proud to present our 0514 3 category 4 year transformation map. Download this transformation map diagram to mark your business timeline across the top of it, breaking it in to the significant milestones of your business. This template can be used to plot progress during a transformation period.
-
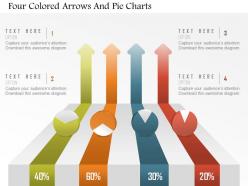 Am four colored arrows and pie charts powerpoint template
We are proud to present our am four colored arrows and pie charts powerpoint template. Graphic of four colored arrows and pie chart has been used to craft this PPT diagram. This PPT diagram contains the concept of financial analysis. Use this PPT and build an exclusive presentation for finance and marketing related topics.
-
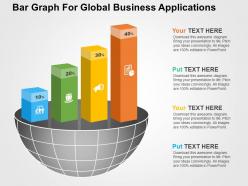 Bar graph for global business applications flat powerpoint design
Adjustable PPT slides as well-matched with Google slides. Completely modifiable PowerPoint design. Presentation design can be shared in standard and widescreen view. Fast download and can be easily transformed into JPEG and PDF document. Similar designs available with different nodes and stages. Alternate to add or remove logo, icon and image as required. Useful for Business professionals, executives and leaders.
-
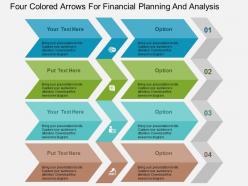 Four colored arrows for financial planning and analysis flat powerpoint design
We are proud to present our four colored arrows for financial planning and analysis flat powerpoint design. Graphic of four colored arrows has been used to design this power point template diagram. This PPT diagram contains the concept of financial planning and analysis. Use this PPT diagram for business and marketing related presentations.
-
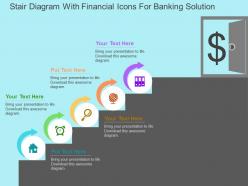 Stair diagram with financial icons for banking solution flat powerpoint design
We are proud to present our stair diagram with financial icons for banking solution flat powerpoint design. This power point template diagram has been crafted with graphic of stair diagram and financial icons. This PPT diagram contains the concept of banking solution. Use this PPT diagram for business and banking related presentations.
-
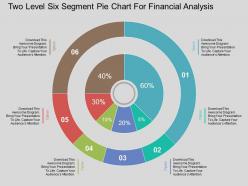 Df two level six segment pie chart for financial analysis flat powerpoint design
Presenting df two level six segment pie chart for financial analysis flat powerpoint design. This Power Point template diagram has been crafted with graphic of two level six segment pie chart. This PPT diagram contains the concept of business result and target analysis. Use this PPT diagram for business and marketing related presentations.
-
 Service portfolio alignment services strategic ppt presentation
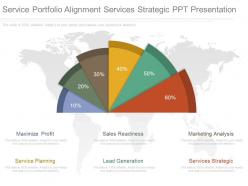
Presenting service portfolio alignment services strategic ppt presentation. This is a service portfolio alignment services strategic ppt presentation. This is a six stage process. The stages in this process are maximize profit, sales readiness, marketing analysis, service planning, lead generation, services strategic.
-
 Comparison of workforce management powerpoint slide rules
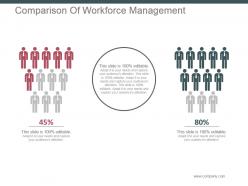
Presenting comparison of workforce management powerpoint slide rules. This is a comparison of workforce management powerpoint slide rules. This is a two stage process. The stages in this process are compare, percentage, business, marketing, comparison.
-
 Insurance sales steps as a agent
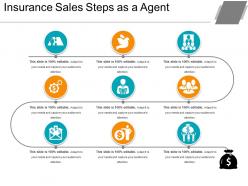
Introducing Insurance Sales Steps As A Agent PPT template for the insurer to convince their potential customers to buy the product. The template is compatible with Google Slides as well. You can save the files in other file formats such as PDF, JPG, and PNG. You can display this on all types of screens.
-
 Coin icon showing pile of coins with dollar currency sign
Presenting this set of slides with name - Coin Icon Showing Pile Of Coins With Dollar Currency Sign. This is a one stage process. The stages in this process are Coin Icon, Penny Icon, Stack Icon.
-
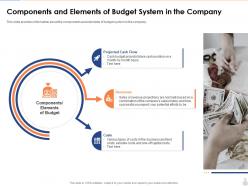 Components and elements overview of an effective budget system components and strategies
This slide provides information about the components and elements of budget system in the company. Introducing Components And Elements Overview Of An Effective Budget System Components And Strategies to increase your presentation threshold. Encompassed with three stages, this template is a great option to educate and entice your audience. Dispence information on Projected Cash Flow, Revenues, Costs, using this template. Grab it now to reap its full benefits.
-
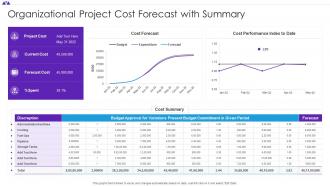 Organizational Project Cost Forecast With Summary
This graph or chart is linked to excel, and changes automatically based on data. Just left click on it and select Edit Data. Introducing our Organizational Project Cost Forecast With Summary set of slides. The topics discussed in these slides are Cost Forecast, Cost Performance Index, Cost Summary. This is an immediately available PowerPoint presentation that can be conveniently customized. Download it and convince your audience.
-
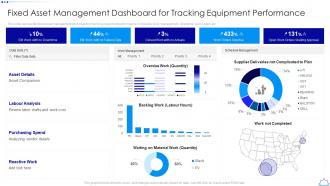 Fixed Asset Management Dashboard For Tracking Equipment Performance
This slide represents fixed asset management dashboard for tracking equipment performance. It includes work management, downtime, work orders etc. Present the topic in a bit more detail with this Fixed Asset Management Dashboard For Tracking Equipment Performance. Use it as a tool for discussion and navigation on Labour Analysis, Purchasing Spend, Reactive Work. This template is free to edit as deemed fit for your organization. Therefore download it now.
-
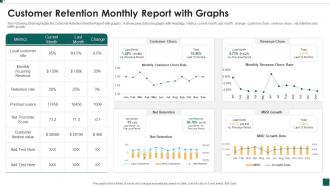 Customer Retention Monthly Report With Graphs
The Following Slide highlights the Customer Retention Monthly Report with graphs . It showcases data and graphs with headings, metrics, current month, last month , change , customer churn , revenue churn , net retention and MRR growth. Presenting our well structured Customer Retention Monthly Report With Graphs. The topics discussed in this slide are Loyal Customer Rate, Retention Rate, Premium Users. This is an instantly available PowerPoint presentation that can be edited conveniently. Download it right away and captivate your audience.
-
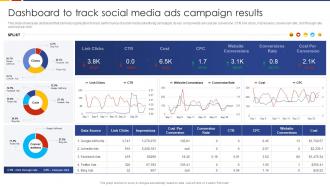 Dashboard To Track Social Media Ads Campaign Results Social Media Marketing Strategic
This slide showcases dashboard that can help organization to track performance of social media advertising campaigns. Its key components are cost per conversion, CTR, link clicks, impressions, conversion rate, click through rate and cost per click. Deliver an outstanding presentation on the topic using this Dashboard To Track Social Media Ads Campaign Results Social Media Marketing Strategic. Dispense information and present a thorough explanation of Dashboard, Social Media, Campaign Results using the slides given. This template can be altered and personalized to fit your needs. It is also available for immediate download. So grab it now.
-
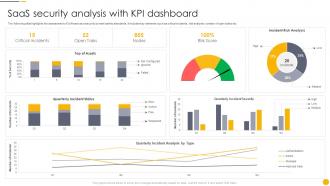 Saas Security Analysis With Kpi Dashboard
The following slide highlights the assessment of Software as a security to meet safety standards. It includes key elements such as critical incidents, risk analysis, number of open tasks etc. Introducing our Saas Security Analysis With Kpi Dashboard set of slides. The topics discussed in these slides are Analysis, Dashboard, Assessment. This is an immediately available PowerPoint presentation that can be conveniently customized. Download it and convince your audience.
-
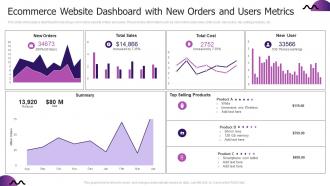 Ecommerce Website Dashboard With New Orders And Users Metrics
This slide showcases a dashboard for tracking e commerce website orders and users. This provides information such as new orders, total sales, total costs, new users, top-selling products, etc. Introducing our Ecommerce Website Dashboard With New Orders And Users Metrics set of slides. The topics discussed in these slides are Ecommerce Website Dashboard, New Orders, Users Metrics. This is an immediately available PowerPoint presentation that can be conveniently customized. Download it and convince your audience.
-
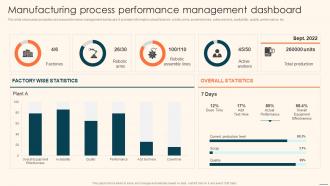 Manufacturing Process Performance Management Dashboard Deploying Automation Manufacturing
This slide showcases production process performance management dashboard. It provides information about factories, robotic arms, assembly lines, active workers, availability, quality, performance, etc. Present the topic in a bit more detail with this Manufacturing Process Performance Management Dashboard Deploying Automation Manufacturing. Use it as a tool for discussion and navigation on Overall Statistics, Manufacturing Process, Performance Management. This template is free to edit as deemed fit for your organization. Therefore download it now.
-
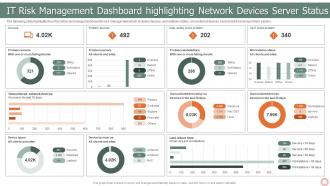 IT Risk Management Strategies IT Risk Management Dashboard Highlighting Network Devices
The following slide highlights the information technology dashboard for risk management which includes devices, workstations status, unmonitored devices, last reboot time and problem servers. Deliver an outstanding presentation on the topic using this IT Risk Management Strategies IT Risk Management Dashboard Highlighting Network Devices. Dispense information and present a thorough explanation of Workstation Status, Problem Workstations, Problem Servers using the slides given. This template can be altered and personalized to fit your needs. It is also available for immediate download. So grab it now.
-
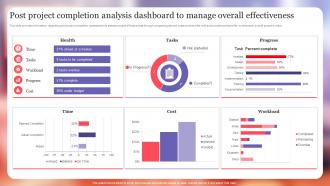 Post Project Completion Analysis Dashboard To Manage Project Excellence Playbook For Managers
This slide provides information regarding post project completion assessment to assess project effectiveness through comparing planned costs and benefits with actual costs and benefits to determine overall projects value. Present the topic in a bit more detail with this Post Project Completion Analysis Dashboard To Manage Project Excellence Playbook For Managers. Use it as a tool for discussion and navigation on Health, Progress, Workload, Cost, Time. This template is free to edit as deemed fit for your organization. Therefore download it now.
-
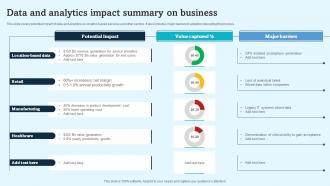 Data And Analytics Impact Summary On Business
This slide covers potential impact of data and analytics on location based services and other sectors. It also includes major barriers to adoption disrupting the process. Introducing our Data And Analytics Impact Summary On Business set of slides. The topics discussed in these slides are Manufacturing, Potential Impact, Data And Analytics. This is an immediately available PowerPoint presentation that can be conveniently customized. Download it and convince your audience.
-
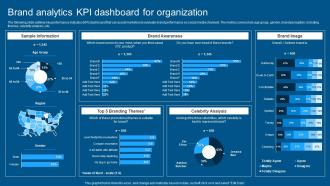 Complete Guide To Conduct Market Brand Analytics KPI Dashboard For Organization
The following slide outlines key performance indicator KPI dashboard that can assist marketers to evaluate brand performance on social media channels. The metrics covered are age group, gender, brand perception, branding themes, celebrity analysis, etc. Present the topic in a bit more detail with this Complete Guide To Conduct Market Brand Analytics KPI Dashboard For Organization. Use it as a tool for discussion and navigation on Brand Awareness, Branding Themes, Celebrity Analysis. This template is free to edit as deemed fit for your organization. Therefore download it now.
-
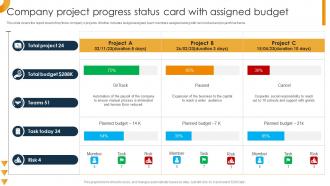 Company Project Progress Status Card With Assigned Budget
This slide covers the report sheet of top three companys projects. It further includes budget assigned, team members assigned along with risk involved and project time frame. Introducing our Company Project Progress Status Card With Assigned Budget set of slides. The topics discussed in these slides are Total Budget, Project, Company Project. This is an immediately available PowerPoint presentation that can be conveniently customized. Download it and convince your audience.
-
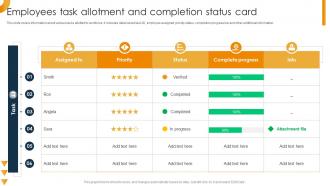 Employees Task Allotment And Completion Status Card
This slide covers information about various tasks allotted to workforce. It includes detail about task ID, employee assigned, priority status, completion progress bar and other additional information. Introducing our Employees Task Allotment And Completion Status Card set of slides. The topics discussed in these slides are Employees Task, Completion Status, Complete Progress. This is an immediately available PowerPoint presentation that can be conveniently customized. Download it and convince your audience.
-
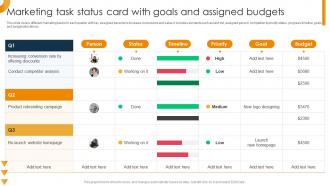 Marketing Task Status Card With Goals And Assigned Budgets
This slide covers different marketing tasks for each quarter with key assigned persons to increase conversions and sales. It includes elements such as task list, assigned person, completion and priority status, progress timeline, goals and budget allocations. Presenting our well structured Marketing Task Status Card With Goals And Assigned Budgets. The topics discussed in this slide are Marketing Task, Card With Goals, Assigned Budgets. This is an instantly available PowerPoint presentation that can be edited conveniently. Download it right away and captivate your audience.
-
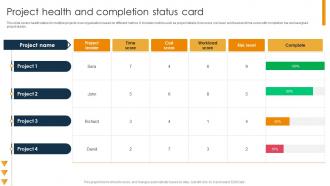 Project Health And Completion Status Card
This slide covers health status for multiple projects in an organization based on different metrics. It includes metrics such as project details, time score, risk level, workload and time score with completion bar and assigned project leader. Presenting our well structured Project Health And Completion Status Card. The topics discussed in this slide are Project, Workload Score, Risk Level. This is an instantly available PowerPoint presentation that can be edited conveniently. Download it right away and captivate your audience.
-
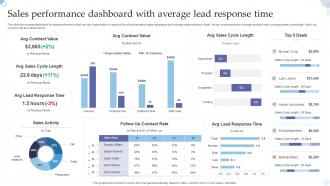 Sales Performance Dashboard With Average Lead Response Time
This slide showcases dashboard for sales performance that can help organization to analyze the effectiveness of sales campaigns and average response time of lead. Its key components are average contract value, average sales cycle length, follow up contract rate and sales activity. Presenting our well structured Sales Performance Dashboard With Average Lead Response Time. The topics discussed in this slide are Sales Activity, Avg Lead Response Time. This is an instantly available PowerPoint presentation that can be edited conveniently. Download it right away and captivate your audience.
-
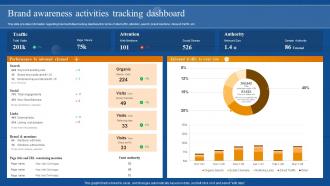 Brand Awareness Activities Tracking Dashboard Brand Awareness Overview Branding SS
This slide provides information regarding brand activities tracking dashboard in terms of site traffic, attention, search, brand mentions, inbound traffic, etc. Present the topic in a bit more detail with this Brand Awareness Activities Tracking Dashboard Brand Awareness Overview Branding SS. Use it as a tool for discussion and navigation on Brand Awareness, Activities Tracking, Dashboard, Inbound Traffic . This template is free to edit as deemed fit for your organization. Therefore download it now.
-
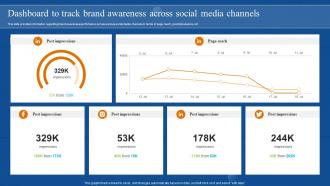 Brand Awareness Overview Dashboard To Track Brand Awareness Across Social Media Channels Branding SS
This slide provides information regarding brand awareness performance across various social media channels in terms of page reach, post impressions, etc. Present the topic in a bit more detail with this Brand Awareness Overview Dashboard To Track Brand Awareness Across Social Media Channels Branding SS. Use it as a tool for discussion and navigation on Post Impressions, Dashboard To Track, Brand Awareness, Social Media Channels. This template is free to edit as deemed fit for your organization. Therefore download it now.
-
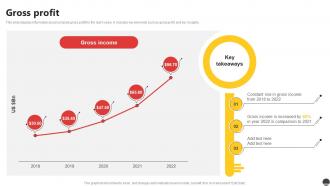 Gross Profit E Commerce Company Profile Ppt Infographics CP SS
This slide displays information about company gross profit for the last 5 years. It includes key elements such as gross profit, and key insights. Present the topic in a bit more detail with this Gross Profit E Commerce Company Profile Ppt Infographics CP SS. Use it as a tool for discussion and navigation on Gross Income. This template is free to edit as deemed fit for your organization. Therefore download it now.
-
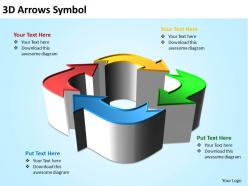 Business powerpoint templates 3d arrows symbol sales ppt slides
This PowerPoint Diagram Shows 3D Arrows making Square like Object. This Colorful 3D Arrow Diagram will let you explain four different paths to reach the Destination. It signifies the Concept of Recycling, Reuse, Environment etc.
-
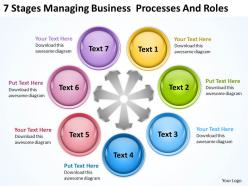 Business process workflow diagram and roles powerpoint templates ppt backgrounds for slides
Use of innovative and high quality background images. 100% editing of the slides allowed. Allow editing with the Google slides or other offline software’s. No effect on quality when opened on a wide screen. Useful for the project leads, employees and the business managers.
-
 Gm piggy bank with gold coins flat powerpoint design
Presenting gm piggy bank with gold coins flat powerpoint design. Presenting gm piggy bank with gold coins flat powerpoint design. This Power Point template diagram has been crafted with graphic of piggy bank and gold coins. This PPT diagram contains the concept of financial planning and saving techniques representation. This PPT diagram can be used for business and finance related presentations.
-
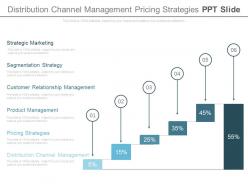 Distribution channel management pricing strategies ppt slide
Presenting distribution channel management pricing strategies ppt slide. This is a distribution channel management pricing strategies ppt slide. This is a six stage process. The stages in this process are management, finance.
-
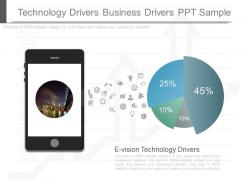 See technology drivers business drivers ppt sample
They will have an eye-opening impact on the audience by their astounding looks. They can be converted into different formats. They are result and technology oriented. They can be customised by changing the size and shape of icons and also by adding logos and images. They are compatible with google. The stages in this process are e vision, technology drivers, finance, marketing.
-
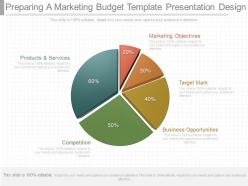 One preparing a marketing budget template presentation design
Presenting one preparing a marketing budget template presentation design. This is a preparing a marketing budget template presentation design. This is a five stage process. The stages in this process are marketing objectives, target mark, business opportunities, competition, products and services.
-
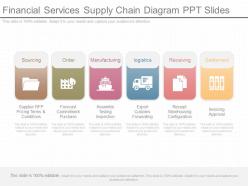 Download financial services supply chain diagram ppt slides
Presenting download financial services supply chain diagram ppt slides. This is a financial services supply chain diagram ppt slides. This is a six stage process. The stages in this process are sourcing, order, manufacturing, logistics, receiving, settlement.
-
 Financial management icon ppt design
Presenting this set of slides with name - Financial Management Icon Ppt Design. This is a two stage process. The stages in this process are Financial State, Financial Management, Economy.
-
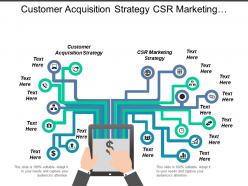 Customer acquisition strategy csr marketing strategy business administration cpb
Presenting this set of slides with name - Customer Acquisition Strategy Csr Marketing Strategy Business Administration Cpb. This is an editable two stages graphic that deals with topics like Customer, Acquisition, Strategy, Csr, Marketing, Strategy, Business, Administration to help convey your message better graphically. This product is a premium product available for immediate download, and is 100 percent editable in Powerpoint. Download this now and use it in your presentations to impress your audience.
-
 Stock pitch b2b retail powerpoint presentation ppt slide template
Our Stock Pitch B2B Retail Powerpoint Presentation Ppt Slide Template is the perfect way to pitch your stock. We have researched thousands of stock pitches and designed the most impactful way to convince your investors to invest in your equity.
-
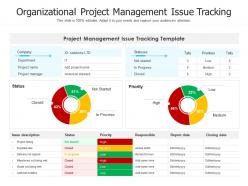 Organizational project management issue tracking
Introducing our Organizational Project Management Issue Tracking set of slides. The topics discussed in these slides are Issue Description, Status, Priority, Responsible, Report Date. This is an immediately available PowerPoint presentation that can be conveniently customized. Download it and convince your audience.
-
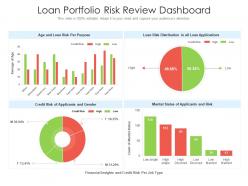 Loan portfolio risk review dashboard
Introducing our Loan Portfolio Risk Review Dashboard set of slides. The topics discussed in these slides are Loan Portfolio Risk Review Dashboard. This is an immediately available PowerPoint presentation that can be conveniently customized. Download it and convince your audience.
-
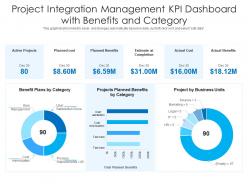 Project integration management kpi dashboard with benefits and category
Introducing our Project Integration Management Kpi Dashboard With Benefits And Category set of slides. The topics discussed in these slides are Active Projects, Planned Cost, Planned Benefits, Actual Cost, Actual Benefits. This is an immediately available PowerPoint presentation that can be conveniently customized. Download it and convince your audience.
-
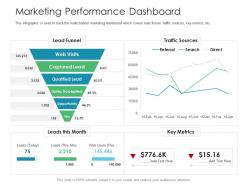 Marketing performance dashboard business consumer marketing strategies ppt ideas
This infographic is used to track the multichannel marketing dashboard which covers lead funnel, traffic sources, key metrics, etc. Introducing Marketing Performance Dashboard Business Consumer Marketing Strategies Ppt Ideas to increase your presentation threshold. Encompassed with six stages, this template is a great option to educate and entice your audience. Dispense information on Opportunity, Sales Accepted, Qualified Lead, Captured Lead, Traffic Sources, using this template. Grab it now to reap its full benefits.
-
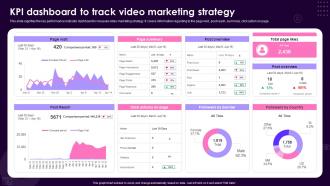 KPI Dashboard Snapshot To Track Video Marketing Strategy
This slide signifies the key performance indicator dashboard to measure video marketing strategy. It covers information regarding to the page visit, post reach, summary, click action on page. Introducing our KPI Dashboard Snapshot To Track Video Marketing Strategy set of slides. The topics discussed in these slides are KPI Dashboard, Video Marketing Strategy. This is an immediately available PowerPoint presentation that can be conveniently customized. Download it and convince your audience.
-
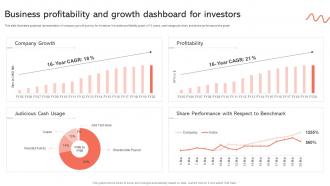 Business Profitability And Growth Dashboard For Investors
This slide illustrates graphical representation of company growth journey for investors. It includes profitability graph of 15 years, cash usage pie chart, and share performance line graph. Introducing our Business Profitability And Growth Dashboard For Investors set of slides. The topics discussed in these slides are Company Growth, Profitability, Share Performance. This is an immediately available PowerPoint presentation that can be conveniently customized. Download it and convince your audience.
-
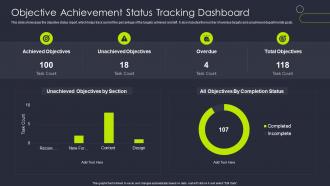 Objective Achievement Status Tracking Dashboard
This slide showcases the objective status report, which helps track current the percentage of the targets achieved and left. It also includes the number of overdue targets and unachieved departmental goals. Introducing our Objective Achievement Status Tracking Dashboard set of slides. The topics discussed in these slides are Achieved Objectives, Unachieved Objectives, Overdue, Total Objectives. This is an immediately available PowerPoint presentation that can be conveniently customized. Download it and convince your audience.
-
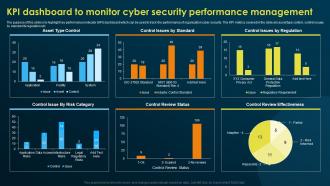 KPI Dashboard To Monitor Cyber Security Performance Implementing Security Awareness Training
The purpose of this slide is to highlight key performance indicator KPI dashboard which can be used to track the performance of organization cyber security. The KPI metrics covered in the slide are asset type control, control issues by standard and regulation etc. Deliver an outstanding presentation on the topic using this KPI Dashboard To Monitor Cyber Security Performance Implementing Security Awareness Training. Dispense information and present a thorough explanation of Asset Type Control, Control Issues By Standard, Review Effectiveness using the slides given. This template can be altered and personalized to fit your needs. It is also available for immediate download. So grab it now.
-
 CRM Tasks And Deals Status Dashboard
This slide illustrates graphical representation of status report of tasks and deals related to CRM statistical data. It includes total deals graph, total tasks graph etc. Introducing our CRM Tasks And Deals Status Dashboard set of slides. The topics discussed in these slides are Review Meeting, Monthly Office Meeting. This is an immediately available PowerPoint presentation that can be conveniently customized. Download it and convince your audience.
-
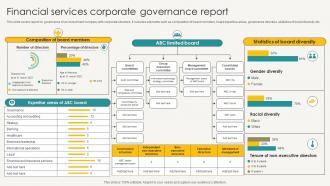 Financial Services Corporate Governance Report
This slide covers report on governance of an investment company with corporate structure. It includes elements such as composition of board members, board expertise areas, governance structure, statistics of board diversity etc. Introducing our Financial Services Corporate Governance Report set of slides. The topics discussed in these slides are Corporate Governance Report, Gender Diversity, Racial Diversity. This is an immediately available PowerPoint presentation that can be conveniently customized. Download it and convince your audience.
-
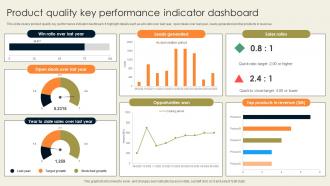 Product Quality Key Performance Indicator Dashboard
This slide covers product quality key performance indicator dashboard. It highlight details such as win ratio over last year, open deals over last year, leads generated and top products in revenue. Introducing our Product Quality Key Performance Indicator Dashboard set of slides. The topics discussed in these slides are Leads Generated, Sales Ratios, Opportunities Won. This is an immediately available PowerPoint presentation that can be conveniently customized. Download it and convince your audience.
-
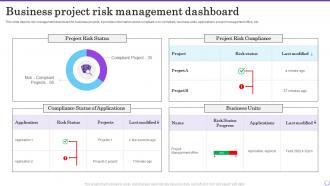 Business Project Risk Management Dashboard
This slide depicts risk management dashboard for business projects. It provides information about compliant, non compliant, business units, applications, project management office, etc. Introducing our Business Project Risk Management Dashboard set of slides. The topics discussed in these slides are Project Risk Status, Project Risk Compliance, Business Units. This is an immediately available PowerPoint presentation that can be conveniently customized. Download it and convince your audience.
-
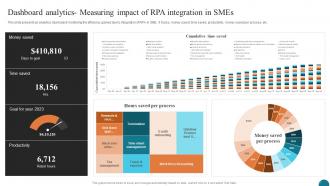 Dashboard Analytics Measuring Impact Elevating Small And Medium Enterprises Digital Transformation DT SS
This slide presents an analytics dashboard monitoring the efficiency gained due to integration of RPA in SME. It tracks, money saved, time saved, productivity, money saved per process, etc. Present the topic in a bit more detail with this Dashboard Analytics Measuring Impact Elevating Small And Medium Enterprises Digital Transformation DT SS. Use it as a tool for discussion and navigation on Tax Management, Termination, Travel And Expense. This template is free to edit as deemed fit for your organization. Therefore download it now.
-
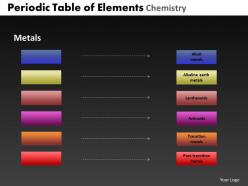 Periodic table of elements chemistry powerpoint slides and ppt templates db
These high quality, editable pre-designed powerpoint slides and powerpoint templates have been carefully created by our professional team to help you impress your audience. Each graphic in every powerpoint slide is vector based and is 100% editable in powerpoint.Each and every property of any slide - color, size, shading etc can be modified to build an effective powerpoint presentation. Use these slides to convey complex business concepts in a simplified manner. Any text can be entered at any point in the powerpoint slide. Simply DOWNLOAD, TYPE and PRESENT
-
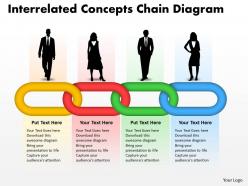 Interrelated concepts chain diagram powerpoint templates ppt presentation slides 0812
Chain diagrams are visualizations that show the relationships between events and tasks and how the events affect each other. Different events and event chains can be displayed using different colors.
-
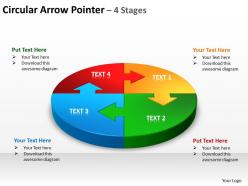 Circular arrow pointer 4 stages powerpoint diagrams presentation slides graphics 0912
Use this circle chart to make your team understand complex processes.
-
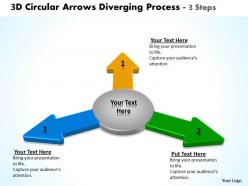 3d circular arrows diverging process steps software powerpoint slides
We are proud to present our 3d circular arrows diverging process steps software powerpoint slides. This diagram helps to illustrate a Process steps. This diagram is adequate to present three corner points of a sequence. Create your process cycle with this chart and convince your audience with a professional arranged presentation.
-
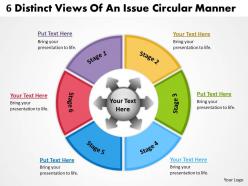 6 distinct views of an issue circular manner cycle process powerpoint templates
We are proud to present our 6 distinct views of an issue circular manner cycle process powerpoint templates. This layout helps you to bring some important aspects of your business process to the notice of all concerned. Streamline the flow of information across the board


