Finance PowerPoint Templates, Presentation Slide Diagrams & PPT Graphics
- Sub Categories
-
- 30 60 90 Day Plan
- Advertising
- Agile Development
- Aims and Objectives
- Arrows
- Before and After
- Blockchain Bitcoin
- Boxes
- Business
- Calender
- Case Study
- Celebrations
- Certificates
- Challenges Opportunities
- Channel Distribution
- Children
- Communication
- Competitive Landscape
- Computer
- Concepts
- Construction Management
- Corporate
- Crowdfunding
- Current State Future State
- Custom PowerPoint Diagrams
- Digital Transformation
- Dos and Donts
- Economics
- Education
- Environment
- Events
- Festival
- Finance
- Financials
- Food
- Game
- Gap Analysis
- Generic
- Geographical
- Health
- Heatmaps
- Holidays
- Icons
- Input Process Output
- Internet
- Key Messages
- Key Wins
- Ladder
- Leadership
- Lists
- Lucky Draw
- Management
- Marketing
- Measuring
- Medical
- Music
- News
- Next Steps
- People Process Technology
- Pillars
- Planning
- Post-it-Notes
- Problem Statement
- Process
- Proposal Management
- Pros and Cons
- Puzzle
- Puzzles
- Recruitment Strategy
- Religion
- Research and Development
- Risk Mitigation Strategies
- Roadmap
- Selling
- Shapes
- Short Term Long Term
- Social
- Stairs
- Start Stop Continue
- Strategy
- Symbol
- Technology
- Thesis Defense Dissertation
- Timelines
- Traffic
- Transition Plan
- Transportation
- Vehicles
- Venture Capital Funding
- Warning
- Winners
- Word Cloud
-
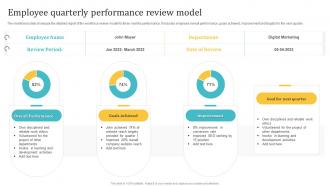 Employee Quarterly Performance Review Model
The mentioned slide showcase the detailed report of the workforce review model for three months performance. It includes employee overall performance, goals achieved, improvement and targets for the next quarter. Introducing our Employee Quarterly Performance Review Model set of slides. The topics discussed in these slides are Overall Performance, Goals Achieved, Improvement. This is an immediately available PowerPoint presentation that can be conveniently customized. Download it and convince your audience.
-
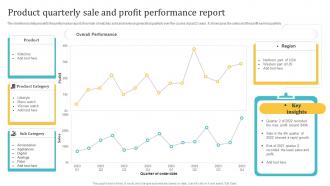 Product Quarterly Sale And Profit Performance Report
The mentioned slide presents the performance report of number of watches sold and revenue generated quarterly over the course of past 2 years. It showcases the sales and the profit earned quarterly. Introducing our Product Quarterly Sale And Profit Performance Report set of slides. The topics discussed in these slides are Overall Performance, Product Category, Sub Category. This is an immediately available PowerPoint presentation that can be conveniently customized. Download it and convince your audience.
-
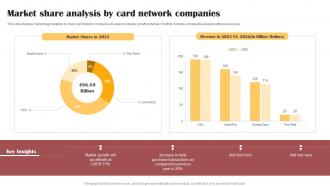 Market Share Analysis By Card Network Companies
This slide displays market fragmentation by major card network companies to analyze industry growth potential. It further includes comparative analysis with previous year. Presenting our well structured Market Share Analysis By Card Network Companies. The topics discussed in this slide are Market Shares, Revenue, Market Growth. This is an instantly available PowerPoint presentation that can be edited conveniently. Download it right away and captivate your audience.
-
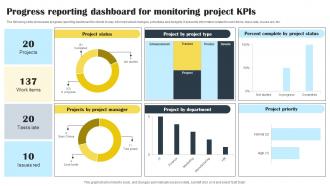 Progress Reporting Dashboard For Monitoring Project KPIs
The following slide showcases progress reporting dashboard for clients to stay informed about changes, schedules and budgets. It presents information related to work items, tasks late, issues red, etc. Presenting our well structured Progress Reporting Dashboard For Monitoring Project KPIs. The topics discussed in this slide are Project Status, Project By Department, Project Priority. This is an instantly available PowerPoint presentation that can be edited conveniently. Download it right away and captivate your audience.
-
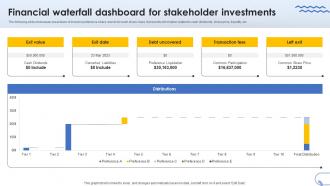 Financial Waterfall Dashboard For Stakeholder Investments
The following slide showcases breakdown of investor preference share rounds for each share class. It presents information related to cash dividends, share price, liquidity, etc. Presenting our well structured Financial Waterfall Dashboard For Stakeholder Investments. The topics discussed in this slide are Debt Uncovered, Transaction Fees, Stakeholder Investments. This is an instantly available PowerPoint presentation that can be edited conveniently. Download it right away and captivate your audience.
-
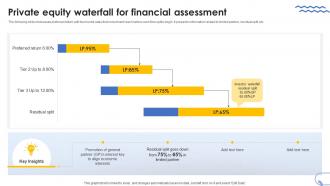 Private Equity Waterfall For Financial Assessment
The following slide showcases preferred return with two hurdle rates that investment reach before cash flow splits begin. It presents information related to limited partner, residual split, etc. Presenting our well structured Private Equity Waterfall For Financial Assessment. The topics discussed in this slide are Private Equity Waterfall, Financial Assessment. This is an instantly available PowerPoint presentation that can be edited conveniently. Download it right away and captivate your audience.
-
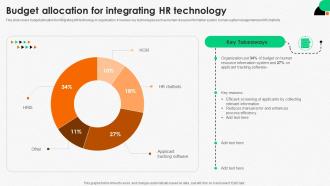 Integrating Human Resource Budget Allocation For Integrating HR Technology
This slide covers budget allocation for integrating HR technology in organization. It involves key technologies such as human resource information system, human capital management and HR chatbots. Deliver an outstanding presentation on the topic using this Integrating Human Resource Budget Allocation For Integrating HR Technology. Dispense information and present a thorough explanation of Efficient Screening Of Applicants, Collecting Relevant Information, Enhances Process Efficiency using the slides given. This template can be altered and personalized to fit your needs. It is also available for immediate download. So grab it now.
-
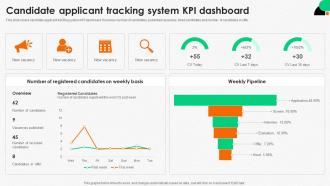 Integrating Human Resource Candidate Applicant Tracking System KPI Dashboard
This slide covers candidate applicant tracking system KPI dashboard. It involves number of candidates, published vacancies, hired candidates and number of candidates in offer. Present the topic in a bit more detail with this Integrating Human Resource Candidate Applicant Tracking System KPI Dashboard. Use it as a tool for discussion and navigation on Candidate Applicant Tracking, KPI Dashboard, Published Vacancies, Registered Candidates. This template is free to edit as deemed fit for your organization. Therefore download it now.
-
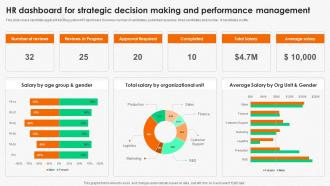 Integrating Human Resource HR Dashboard For Strategic Decision Making And Performance
This slide covers candidate applicant tracking system KPI dashboard. It involves number of candidates, published vacancies, hired candidates and number of candidates in offer. Deliver an outstanding presentation on the topic using this Integrating Human Resource HR Dashboard For Strategic Decision Making And Performance. Dispense information and present a thorough explanation of Tracking System KPI Dashboard, Published Vacancies, Performance Management, HR Dashboard using the slides given. This template can be altered and personalized to fit your needs. It is also available for immediate download. So grab it now.
-
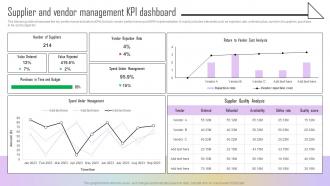 Supplier And Vendor Management KPI Dashboard Estimating ERP System
The following slide showcases the key performance indicators KPIs to track vendor performance post ERP implementation. It mainly includes elements such as rejection rate, ordered value, number of suppliers, purchase in tie and budget etc. Deliver an outstanding presentation on the topic using this Supplier And Vendor Management KPI Dashboard Estimating ERP System. Dispense information and present a thorough explanation of Vendor Rejection Rate, Spend Under Management, Cost Analysis using the slides given. This template can be altered and personalized to fit your needs. It is also available for immediate download. So grab it now.
-
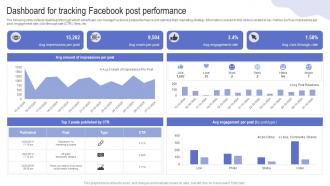 Dashboard For Tracking Facebook Post Driving Web Traffic With Effective Facebook Strategy SS V
The following slide outlines dashboard through which advertisers can manage Facebook post performance and optimize their marketing strategy. Information covered in this slide is related to key metrics such as impressions per post, engagement rate, click-through rate CTR, likes, etc. Present the topic in a bit more detail with this Dashboard For Tracking Facebook Post Driving Web Traffic With Effective Facebook Strategy SS V. Use it as a tool for discussion and navigation on Tracking Facebook Post. This template is free to edit as deemed fit for your organization. Therefore download it now.
-
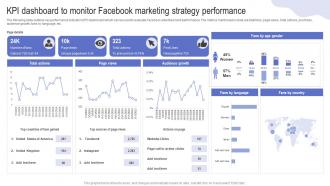 KPI Dashboard To Monitor Facebook Marketing Driving Web Traffic With Effective Facebook Strategy SS V
The following slide outlines key performance indicator KPI dashboard which can be used to evaluate Facebook advertisement performance. The metrics mentioned in slide are total fans, page views, total actions, post likes, audience growth, fans by language, etc. Present the topic in a bit more detail with this KPI Dashboard To Monitor Facebook Marketing Driving Web Traffic With Effective Facebook Strategy SS V. Use it as a tool for discussion and navigation on KPI Dashboard To Monitor, Facebook Marketing. This template is free to edit as deemed fit for your organization. Therefore download it now.
-
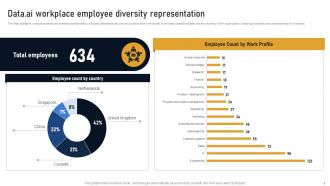 Data Ai Workplace Employee Diversity Developing Marketplace Strategy AI SS V
The slide highlights workplace employee diversity representation, including total employee count by country and work profile. It provides valuable insights into the diversity within organization, fostering inclusivity and understanding of workforce. Deliver an outstanding presentation on the topic using this Data Ai Workplace Employee Diversity Developing Marketplace Strategy AI SS V. Dispense information and present a thorough explanation of Employee, Representation, Diversity using the slides given. This template can be altered and personalized to fit your needs. It is also available for immediate download. So grab it now.
-
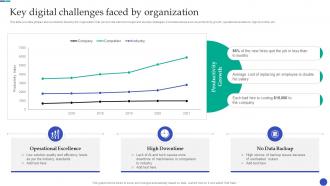 New And Advanced Tech Key Digital Challenges Faced By Organization
This slide provides glimpse about problems faced by the organization that can provide metrics to target and develop strategies. It includes issues such as productivity growth, operational excellence, high downtime, etc.Deliver an outstanding presentation on the topic using this New And Advanced Tech Key Digital Challenges Faced By Organization Dispense information and present a thorough explanation of Operational Excellence, High Downtime, No Data Backup using the slides given. This template can be altered and personalized to fit your needs. It is also available for immediate download. So grab it now.
-
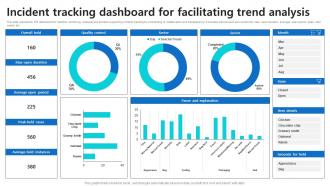 Incident Tracking Dashboard For Facilitating Trend Analysis
This slide represents KPI dashboard for real time monitoring, analysis and decision supporting incident tracking by contributing to collaboration and transparency. It includes metrics such as overall hold, max open duration, average open period, peak held cases, etc. Introducing our Incident Tracking Dashboard For Facilitating Trend Analysis set of slides. The topics discussed in these slides are Incident Tracking, Dashboard For Facilitating, Trend Analysis. This is an immediately available PowerPoint presentation that can be conveniently customized. Download it and convince your audience.
-
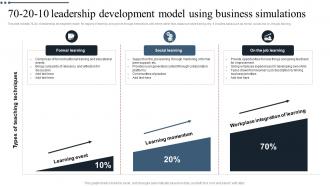 70 20 10 Leadership Development Model Using Business Simulations
This slide exhibits 70 20 10 leadership development model for majority of learning and growth through interactions with others rather than classroom style training only. It includes basis such as formal , social and on the job learning. Introducing our 70 20 10 Leadership Development Model Using Business Simulations set of slides. The topics discussed in these slides are Workplace integration of learning, On the job learning, using business simulations. This is an immediately available PowerPoint presentation that can be conveniently customized. Download it and convince your audience.
-
 Expedia Business Model Financial Projections BMC SS
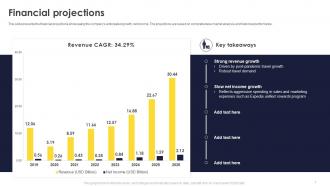
This slide presents the financial projections showcasing the companys anticipated growth, net income. The projections are based on comprehensive market analysis and historical performance. Deliver an outstanding presentation on the topic using this Expedia Business Model Financial Projections BMC SS. Dispense information and present a thorough explanation of Strong Revenue Growth, Sales And Marketing, Rewards Program, Slow Net Income Growth using the slides given. This template can be altered and personalized to fit your needs. It is also available for immediate download. So grab it now.
-
 Company Overview Real Estate Company Profile CP SS
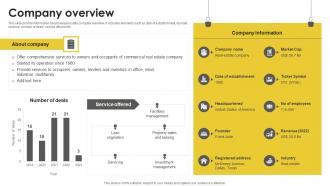
This slide provide information about release estate company overview. It includes elements such as date of establishment, founder, revenue, number of deals, service offered etc. Deliver an outstanding presentation on the topic using this Company Overview Real Estate Company Profile CP SS. Dispense information and present a thorough explanation of Comprehensive, Operation, Occupiers using the slides given. This template can be altered and personalized to fit your needs. It is also available for immediate download. So grab it now.
-
 Competitors Financial Comparison Real Estate Company Profile CP SS
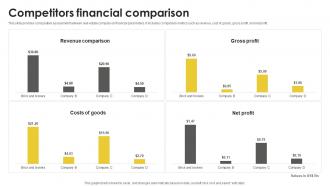
This slide provides comparative assessment between real estate company on financial parameters. It includes comparison metrics such as revenue, cost of goods, gross profit, and net profit. Present the topic in a bit more detail with this Competitors Financial Comparison Real Estate Company Profile CP SS. Use it as a tool for discussion and navigation on Financial, Comparison, Competitors. This template is free to edit as deemed fit for your organization. Therefore download it now.
-
 Examples of business processes and text boxes 5 stages parallel diagram powerpoint templates
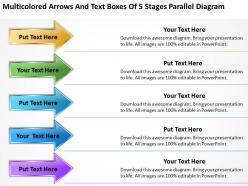
We are proud to present our examples of business processes and text boxes 5 stages parallel diagram powerpoint templates. This Business PowerPoint Diagram contains an image of multicolored arrows in horizontal manner. It shows five stages in an animated manner. This diagram is an interconnection of various components. You can change color, size and orientation of any icon to your liking.
-
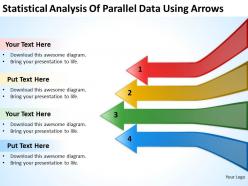 Powerpoint business statistical analysis of parallel data using arrows templates
We are proud to present our powerpoint business statistical analysis of parallel data using arrows templates. Visually support your Microsoft office PPT Presentation with our above template illustrating four steps to define and execute the plans. This diagram can be used to describe the business step-by-step workflows of components in a system. Deliver amazing presentations to mesmerize your audience.
-
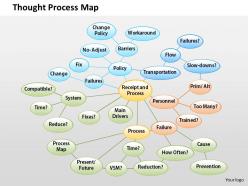 0514 thought process map powerpoint presentation
Excellent picture quality in the slides. Edit the content, area, technique and orientation of the side icons. Follow the watermark with your brand’s logo or organization's name. Explore your own images in the icons. Attend the provided directions to edit and modify the slide template. Light to download and save in the format you like. Advantageous for the business entrepreneurs, managers, and the professional presenters.
-
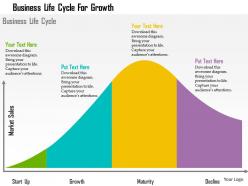 Business life cycle for growth flat powerpoint design
We are proud to present our business life cycle for growth flat powerpoint design. Explain the various stages of business growth with respect time and other factors with this PPT diagram. This diagram template contains the graphic of curve for business life cycle. Use this PPT diagram for business related presentation
-
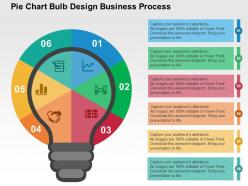 Pie chart bulb design business process flat powerpoint design
We are proud to present our pie chart bulb design business process flat powerpoint design. This power point template diagram has been crafted with graphic of pie chart and bulb design. This PPT diagram contains the concept of business process and idea representation. Use this PPT diagram for business and marketing related presentations.
-
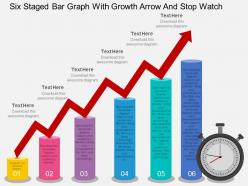 Hq six staged bar graph with growth arrow and stop watch flat powerpoint design
Presenting hq six staged bar graph with growth arrow and stop watch flat powerpoint design. Six staged bar graph diagram and growth arrow with stop watch has been used to design this power point template diagram. This PPT diagram contains the concept of time management and result analysis representation. Use this PPT diagram for business and marketing related presentations.
-
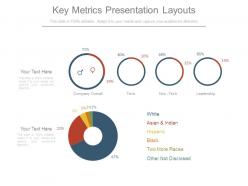 Key metrics presentation layouts
Presenting key metrics presentation layouts. This is a key metrics presentation layouts. This is a five stage process. The stages in this process are company overall, tech, non tech, leadership, white, asian and indian, hispanic.
-
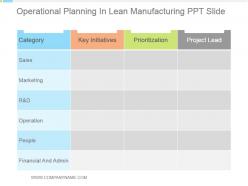 Operational planning in lean manufacturing ppt slide
Presenting operational planning in lean manufacturing ppt slide. This is a operational planning in lean manufacturing ppt slide. This is a four stage process. The stages in this process are sales, marketing, operation, financial and admin, prioritization, project lead, key initiatives.
-
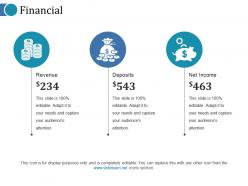 Financial ppt professional
Presenting this set of slides with name - Financial Ppt Professional. This is a three stage process. The stages in this process are Financial, Business, Management, Analysis, Marketing.
-
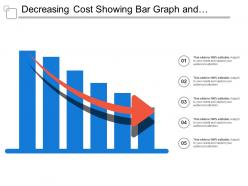 Decreasing cost showing bar graph and downward arrow
Presenting this set of slides with name - Decreasing Cost Showing Bar Graph And Downward Arrow. This is a five stage process. The stages in this process are Data Science, Information Science, Data Analysis.
-
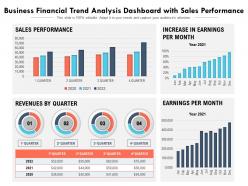 Business financial trend analysis dashboard with sales performance
Presenting this set of slides with name Business Financial Trend Analysis Dashboard With Sales Performance. The topics discussed in these slides are Sales Performance, Revenues, Increase In Earnings. This is a completely editable PowerPoint presentation and is available for immediate download. Download now and impress your audience.
-
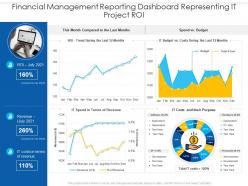 Financial management reporting dashboard representing it project roi
Presenting our well-structured Financial Management Reporting Dashboard Representing IT Project ROI. The topics discussed in this slide are Revenue, Budget, Costs. This is an instantly available PowerPoint presentation that can be edited conveniently. Download it right away and captivate your audience.
-
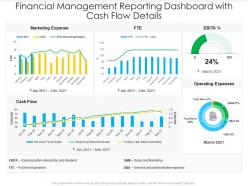 Financial management reporting dashboard with cash flow details
Introducing our Financial Management Reporting Dashboard With Cash Flow Details set of slides. The topics discussed in these slides are Marketing Expense, Cash Flow, Operating Expenses. This is an immediately available PowerPoint presentation that can be conveniently customized. Download it and convince your audience.
-
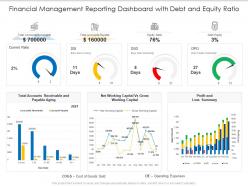 Financial management reporting dashboard with debt and equity ratio
Presenting our well-structured Financial Management Reporting Dashboard With Debt And Equity Ratio. The topics discussed in this slide are Equity Ratio, Debt Equity, Gross Working Capital. This is an instantly available PowerPoint presentation that can be edited conveniently. Download it right away and captivate your audience.
-
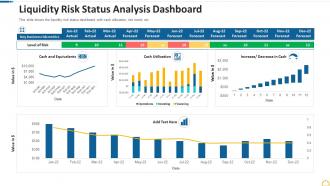 Liquidity risk status analysis dashboard
Introducing our Liquidity Risk Status Analysis Dashboard set of slides. The topics discussed in these slides are Liquidity risk status analysis dashboard. This is an immediately available PowerPoint presentation that can be conveniently customized. Download it and convince your audience.
-
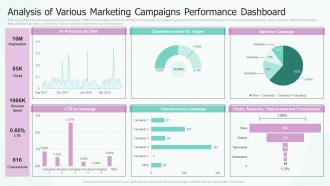 Analysis Of Various Marketing Campaigns Performance Dashboard
This slide shows dashboard presenting performance of different campaigns which would help the organization in analysing the performance of each campaign. It shows impressions by date, money spent on different campaigns, their click through rates, conversions, clicks, sessions, total events and transactions. Presenting our well structured Analysis Of Various Marketing Campaigns Performance Dashboard. The topics discussed in this slide are Analysis Of Various Marketing, Campaigns Performance Dashboard. This is an instantly available PowerPoint presentation that can be edited conveniently. Download it right away and captivate your audience.
-
 Energy Consumption Dashboard With Yearly Savings
Presenting our well-structured Energy Consumption Dashboard With Yearly Savings. The topics discussed in this slide are Availability Factor, Performance Ratio, Production Consumption. This is an instantly available PowerPoint presentation that can be edited conveniently. Download it right away and captivate your audience.
-
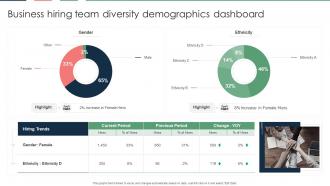 Business Hiring Team Diversity Demographics Dashboard
Presenting our well-structured Business Hiring Team Diversity Demographics Dashboard. The topics discussed in this slide are Gender, Ethnicity. This is an instantly available PowerPoint presentation that can be edited conveniently. Download it right away and captivate your audience.
-
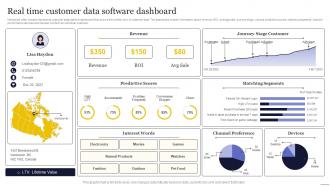 Real Time Customer Data Software Dashboard
Mentioned slide visually represents customer data platform dashboard that shows the unified view of customer data. The dashboard contain information about revenue, ROI, average sale, journey stage, various predictive scores, matching segments, channel performance devices and interest words of an individual customer. Introducing our Real Time Customer Data Software Dashboard set of slides. The topics discussed in these slides are Revenue, Journey Stage Customer, Predictive Scores, Matching Segments. This is an immediately available PowerPoint presentation that can be conveniently customized. Download it and convince your audience.
-
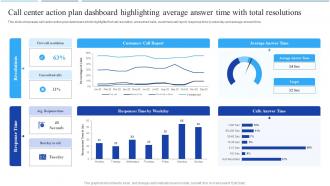 Call Center Agent Performance Call Center Action Plan Dashboard Highlighting Average Answer Time
This slide showcases call center action plan dashboard which highlights first call resolution, unresolved calls, customers call report, response time by weekday and average answer time. Deliver an outstanding presentation on the topic using this Call Center Agent Performance Call Center Action Plan Dashboard Highlighting Average Answer Time. Dispense information and present a thorough explanation of Customers Call Report, Average Answer Time, Calls Answer Time using the slides given. This template can be altered and personalized to fit your needs. It is also available for immediate download. So grab it now.
-
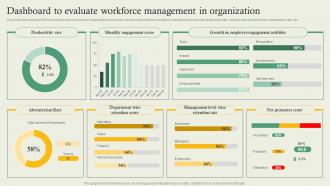 Complete Guide Of Hr Planning Dashboard To Evaluate Workforce Management
This slide showcases the KPIs that would help our business organization to track the improvements with new workforce management. It includes productivity rate, monthly engagement score, absenteeism rate, etc. Present the topic in a bit more detail with this Complete Guide Of Hr Planning Dashboard To Evaluate Workforce Management. Use it as a tool for discussion and navigation on Productivity Rate, Monthly Engagement Score. This template is free to edit as deemed fit for your organization. Therefore download it now.
-
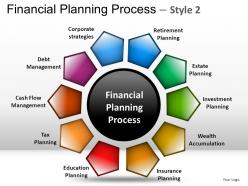 Financial planning process 2 powerpoint presentation slides
These high quality, editable pre-designed powerpoint slides and powerpoint templates have been carefully created by our professional team to help you impress your audience. Each graphic in every powerpoint slide is vector based and is 100% editable in powerpoint. Each and every property of any slide - color, size, shading etc can be modified to build an effective powerpoint presentation. Use these slides to convey complex business concepts in a simplified manner. Any text can be entered at any point in the powerpoint slide. Simply DOWNLOAD, TYPE and PRESENT!
-
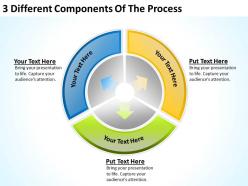 Business process diagram symbols 3 different components of the powerpoint slides
No diversion of pixels when opened on big screen. Allowed grouping or ungrouping of the objects. Access to edit the color, style, themes and the orientation of the slide icons. Trouble-free insertion of trademark in the slides. Beneficial for the marketing professionals, business owners and the Professional presenters.
-
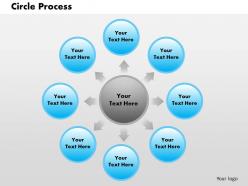 0514 circle process powerpoint presentation
We are proud to present our 0514 circle process powerpoint presentation. This circle process diagram is used in this Business Power Point Presentations. Use this template to make your presentation a visual masterpiece. It outlines the depth of your thought process.Organize your thoughts and illuminate your ideas accordingly.
-
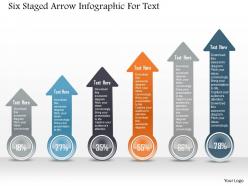 1214 six staged arrow infographic for text powerpoint template
We are proud to present our 1214 six staged arrow infographic for text powerpoint template. Six staged colored arrow info graphics diagram has been used to craft this power point template. This PPT contains the concept of business process flow and information representation. Display any process flow in your presentation with this professional PPT slide.
-
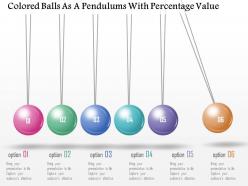 0115 colored balls as a pendulum with percentage value powerpoint template
We are proud to present our 0115 colored balls as a pendulum with percentage value powerpoint template. This power point template slide has been crafted with colored balls and percentage value. This PPT slide also contains the concept of financial data representation. This PPT can be used for finance and business related presentations.
-
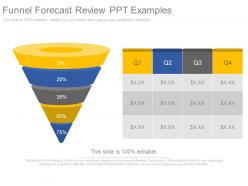 Funnel forecast review ppt examples
Presenting funnel forecast review ppt examples. This is a funnel forecast review ppt examples. This is a five stage process. The stages in this process are business, management, marketing, finance, strategy.
-
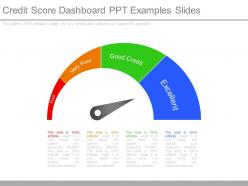 Credit score dashboard snapshot ppt examples slides
Presenting credit score dashboard ppt examples slides. This is a credit score dashboard snapshot ppt examples slides. This is a four stage process. The stages in this process are poor, very poor, good credit, excellent.
-
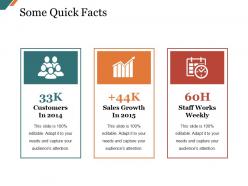 Some quick facts presentation examples
Presenting this set of slides with name - Some Quick Facts Presentation Examples. This is a three stage process. The stages in this process are Business, Marketing, Strategy, Finance, Planning.
-
 Retail banking icons
Presenting Retail Banking Icons slideshow which is completely editable. This PPT is available in both 4:3 and 16:9 aspect ratio. It is compatible with Google Slides, which makes it easily accessible at once. You can modify the color, fonts, font size, and font types of the template as per the requirement. In this template, you can insert your brand logo as well.
-
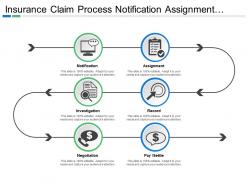 Insurance claim process notification assignment record investigation negotiation pay
Presenting this set of slides with name - Insurance Claim Process Notification Assignment Record Investigation Negotiation Pay. This is a six stage process. The stages in this process are Insurance Claim Process, Insurance Claim Steps, Insurance Claim Procedure.
-
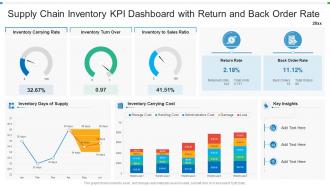 Supply chain inventory kpi dashboard with return and back order rate
Introducing our Inventory Carrying Rate, Inventory Turn Over, Inventory To Sales Ratio set of slides. The topics discussed in these slides are Inventory Carrying Rate, Inventory Turn Over, Inventory To Sales Ratio. This is an immediately available PowerPoint presentation that can be conveniently customized. Download it and convince your audience.
-
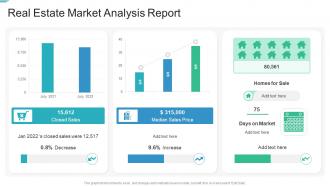 Real estate market analysis report
Presenting our well-structured Real Estate Market Analysis Report. The topics discussed in this slide are Real Estate Market Analysis Report. This is an instantly available PowerPoint presentation that can be edited conveniently. Download it right away and captivate your audience.
-
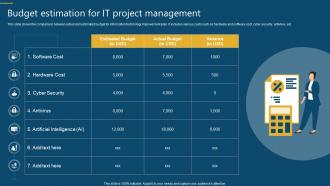 Budget Estimation For It Project Management
This slide shows the comparison between actual and estimated budget for information technology improvement plan. It includes various costs such as hardware and software cost, cyber security, antivirus, etc. Presenting our set of slides with name Budget Estimation For It Project Management. This exhibits information on one stages of the process. This is an easy-to-edit and innovatively designed PowerPoint template. So download immediately and highlight information on Cyber Security, Antivirus, Hardware Cost.
-
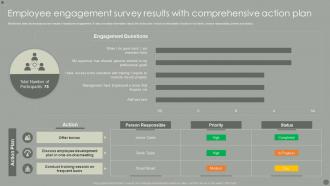 Employee Engagement Survey Results With Comprehensive Action Plan
Mentioned slide showcases survey results of employee engagement. It also provides information about the action plan which covers details of action to be taken, person responsible, priority and status. Introducing our Employee Engagement Survey Results With Comprehensive Action Plan set of slides. The topics discussed in these slides are Employee Engagement, Survey Results, Comprehensive Action Plan. This is an immediately available PowerPoint presentation that can be conveniently customized. Download it and convince your audience.
-
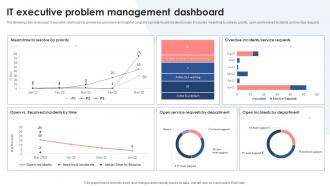 IT Executive Problem Management Dashboard
The following slide showcases IT executive dashboard to provide key personnel an insight of companys problems and resolved issues. It includes mean time to solve by priority, open and resolved incidents and overdue requests. Introducing our IT Executive Problem Management Dashboard set of slides. The topics discussed in these slides are IT Executive, Problem Management, Dashboard. This is an immediately available PowerPoint presentation that can be conveniently customized. Download it and convince your audience.
-
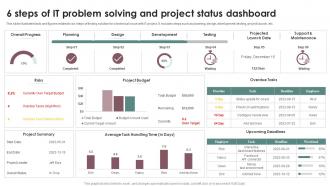 6 Steps Of It Problem Solving And Project Status Dashboard
This slide illustrates facts and figures related to six steps of finding solution for a technical issue with IT project. It includes steps such as planning, design, development, testing, project launch, etc. Presenting our well structured 6 Steps Of It Problem Solving And Project Status Dashboard. The topics discussed in this slide are Project Budget, Project Summary, Support And Maintenance. This is an instantly available PowerPoint presentation that can be edited conveniently. Download it right away and captivate your audience.
-
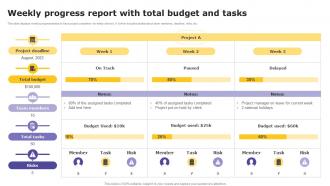 Weekly Progress Report With Total Budget And Tasks
This slide displays weekly progress status to track project completion for timely delivery. It further includes details about team members, deadline, risks, etc. Presenting our well structured Weekly Progress Report With Total Budget And Tasks. The topics discussed in this slide are Report, Budget, Tasks. This is an instantly available PowerPoint presentation that can be edited conveniently. Download it right away and captivate your audience.
-
 Brand Marketing Activities Performance Dashboard Boosting Brand Awareness Toolkit
This slide provides information regarding brand marketing activities performance dashboard in terms of visits by week, bounce rate by week, traffic sources, page views, campaigns, etc. Deliver an outstanding presentation on the topic using this Brand Marketing Activities Performance Dashboard Boosting Brand Awareness Toolkit. Dispense information and present a thorough explanation of Channels Conversion, Session Duration using the slides given. This template can be altered and personalized to fit your needs. It is also available for immediate download. So grab it now.
-
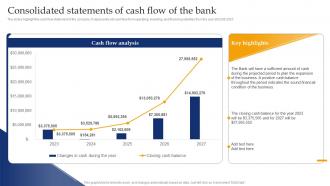 Banking Industry Business Plan Consolidated Statements Of Cash Flow Of The Bank BP SS
The slides highlight the cash flow statement of the company. It represents net cash flow from operating, investing, and financing activities from the year 2023 till 2027. Deliver an outstanding presentation on the topic using this Banking Industry Business Plan Consolidated Statements Of Cash Flow Of The Bank BP SS. Dispense information and present a thorough explanation of Consolidated Statements, Cash Flow Of The Bank, Net Cash Flow From Operating, Cash Flow Statement using the slides given. This template can be altered and personalized to fit your needs. It is also available for immediate download. So grab it now.
-
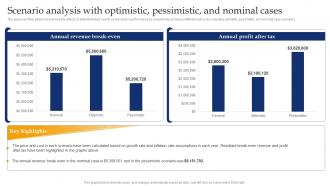 Banking Industry Business Plan Scenario Analysis With Optimistic Pessimistic And Nominal Cases BP SS
The purpose of this slide is to examine the effects of potential future events on the banks performance by considering numerous different outcomes, including optimistic, pessimistic, and nominal case scenarios. Deliver an outstanding presentation on the topic using this Banking Industry Business Plan Scenario Analysis With Optimistic Pessimistic And Nominal Cases BP SS. Dispense information and present a thorough explanation of Scenario Analysis With Optimistic, Pessimistic And Nominal Cases, Including Optimistic using the slides given. This template can be altered and personalized to fit your needs. It is also available for immediate download. So grab it now.


