Finance PowerPoint Templates, Presentation Slide Diagrams & PPT Graphics
- Sub Categories
-
- 30 60 90 Day Plan
- Advertising
- Agile Development
- Aims and Objectives
- Arrows
- Before and After
- Blockchain Bitcoin
- Boxes
- Business
- Calender
- Case Study
- Celebrations
- Certificates
- Challenges Opportunities
- Channel Distribution
- Children
- Communication
- Competitive Landscape
- Computer
- Concepts
- Construction Management
- Corporate
- Crowdfunding
- Current State Future State
- Custom PowerPoint Diagrams
- Digital Transformation
- Dos and Donts
- Economics
- Education
- Environment
- Events
- Festival
- Finance
- Financials
- Food
- Game
- Gap Analysis
- Generic
- Geographical
- Health
- Heatmaps
- Holidays
- Icons
- Input Process Output
- Internet
- Key Messages
- Key Wins
- Ladder
- Leadership
- Lists
- Lucky Draw
- Management
- Marketing
- Measuring
- Medical
- Music
- News
- Next Steps
- People Process Technology
- Pillars
- Planning
- Post-it-Notes
- Problem Statement
- Process
- Proposal Management
- Pros and Cons
- Puzzle
- Puzzles
- Recruitment Strategy
- Religion
- Research and Development
- Risk Mitigation Strategies
- Roadmap
- Selling
- Shapes
- Short Term Long Term
- Social
- Stairs
- Start Stop Continue
- Strategy
- Symbol
- Technology
- Thesis Defense Dissertation
- Timelines
- Traffic
- Transition Plan
- Transportation
- Vehicles
- Venture Capital Funding
- Warning
- Winners
- Word Cloud
-
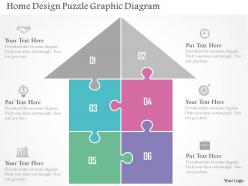 Home design puzzle graphic diagram flat powerpoint design
We are proud to present our home design puzzle graphic diagram flat powerpoint design. Graphic of home design puzzle has been used to craft this PPT diagram. This PPT diagram contains the concept of real estate growth. Use this PPT diagram and build an exclusive presentation.
-
 Finance and communication icons flat powerpoint design
User friendly and fine quality PPT templates. Customization of Presentation graphics and diagrams according to desire and need. Fit into widescreen. Effortless conversion into PDF/ JPG format. Personalisation by insertion of company trade name/ logo. Compatible with Google slides. Additional template for incorporation of desired image. Beneficial for business entities, financiers, marketers, shareholders, revenue officers, professors, teachers, students.
-
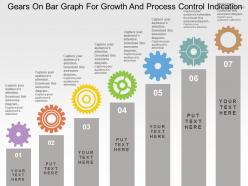 Gears on bar graph for growth and process control indication flat powerpoint design
We are proud to present our gears on bar graph for growth and process control indication flat powerpoint design. This power point template diagram has been crafted with graphic of gear on bar graph. This PPT diagram contains the concept of process control and growth indication. Use this PPT diagram and build an exclusive presentation for your viewers.
-
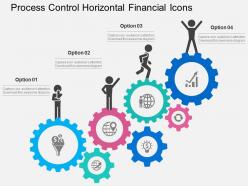 Process control horizontal financial icons flat powerpoint design
We are proud to present our process control horizontal financial icons flat powerpoint design. Concept of process control has been displayed in this power point template diagram. This PPT diagram contains the graphic of financial icons. Use this icon template for business and finance related presentations.
-
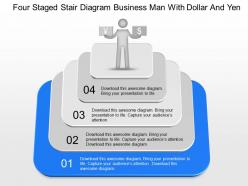 Ge four staged stair diagram business man with dollar and yen powerpoint template
Presenting ge four staged stair diagram business man with dollar and yen powerpoint template. Four staged stair diagram and business man with dollar graphics has been used to design this power point template diagram. This PPT diagram contains the concept of success and financial planning. Use this PPT diagram for business and marketing related presentations.
-
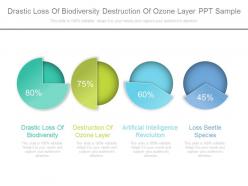 Drastic loss of biodiversity destruction of ozone layer ppt sample
Presenting drastic loss of biodiversity destruction of ozone layer ppt sample. This is a drastic loss of biodiversity destruction of ozone layer ppt sample. This is a four stage process. The stages in this process are drastic loss of biodiversity, destruction of ozone layer, artificial intelligence revolution, loss beetle species.
-
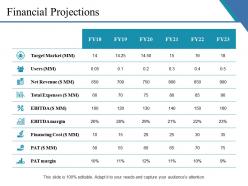 Financial projections ppt example
Presenting this set of slides with name - Financial Projections Ppt Example. This is a six stage process. The stages in this process are Financial, Investment, Marketing, Strategy, Business.
-
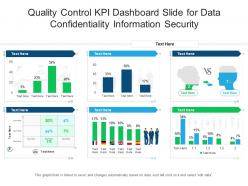 Quality control kpi dashboard slide for data confidentiality information security powerpoint template
You can use this Quality Control Kpi Dashboard Slide For Data Confidentiality Information Security Powerpoint Template to showcase the most crucial verticals of your organization or a project. This dashboard template comes with graphical representations to make the depiction of insights, data, reports, etc, very easy. It is useful in simplifying complex business concepts, allowing the viewers to make better decisions and judgments. This PowerPoint layout is specially designed for different department heads to display diverse sets of information on the topic and help make the viewers become better analysts. Therefore, this PowerPoint layout is not only resourceful, but it is also attention-grabbing and high-quality. Everything from the content and graphics used in this slide can be modified and adjusted as per your needs. It can also be reproduced in PNG, JPG, and PDF formats, which increases the user-friendliness of this layout.
-
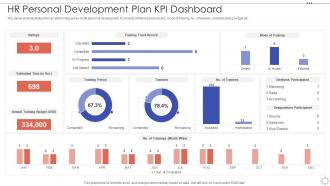 HR Personal Development Plan KPI Dashboard
The below slide illustrates the key performing areas of HR personal development. It consists of training track record, mode of training, no. of trainees, annual training budget etc. Introducing our HR Personal Development Plan KPI Dashboard set of slides. The topics discussed in these slides are Estimated Time, Annual Training Budget, Accounting. This is an immediately available PowerPoint presentation that can be conveniently customized. Download it and convince your audience.
-
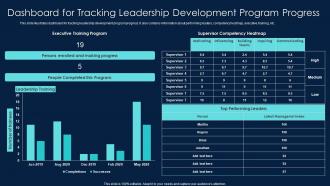 Dashboard For Tracking Leadership Development Program Progress
This slide illustrates dashboard for tracking leadership development program progress. It also contains information about performing leaders, competency heatmap, executive training, etc. Presenting our well-structured Dashboard For Tracking Leadership Development Program Progress. The topics discussed in this slide are Dashboard Tracking, Leadership Development, Program Progress. This is an instantly available PowerPoint presentation that can be edited conveniently. Download it right away and captivate your audience.
-
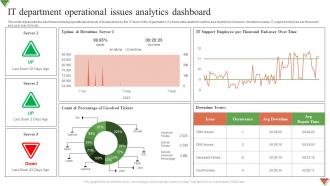 IT Department Operational Issues Analytics Dashboard
This slide represents the dashboard showing operational analysis of issues faced by the IT team of the organization. It shows data related to uptime and downtime of servers, downtime issues, IT support employee per thousand end user over time etc. Introducing our IT Department Operational Issues Analytics Dashboard set of slides. The topics discussed in these slides are Support Employee, Downtime Server, Count Percentage. This is an immediately available PowerPoint presentation that can be conveniently customized. Download it and convince your audience.
-
 IT Software Development Project Operational Analytics Dashboard
This slide represents the dashboard showing the operational analysis of the software development project undertaken by the IT team. It shows details related to overall progress, planning, design, development, testing, risks, budget, overdue tasks etc. related to the project. Presenting our well structured IT Software Development Project Operational Analytics Dashboard. The topics discussed in this slide are Overdue Tasks, Upcoming Deadlines, Project Budget. This is an instantly available PowerPoint presentation that can be edited conveniently. Download it right away and captivate your audience.
-
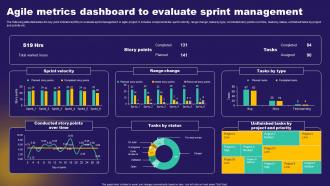 Agile Metrics Dashboard To Evaluate Sprint Management
The following slide delineates the key point indicators KPIs to evaluate sprint management in agile project. It includes components like sprint velocity, range change, tasks by type, concluded story points over time, tasks by status, unfinished tasks by project and priority etc. Introducing our Agile Metrics Dashboard To Evaluate Sprint Management set of slides. The topics discussed in these slides are Sprint Velocity, Range Change. This is an immediately available PowerPoint presentation that can be conveniently customized. Download it and convince your audience.
-
 100 pieces 10x10 rectangular jigsaw puzzle matrix powerpoint templates 0812
This template is skillfully designed and is completely editable to suit all the needs and requirements of the user. The color of the font, its size, style, and all other elements can be customized according to the user's desire The text in the PPT placeholder can be replaced with the desired information making this template highly flexible and adaptable as well. This template is also compatible with various Microsoft versions and formats like Google Slides, JPG, PDF, etc so the user will face no issue in saving it in the format of his choice.
-
 12 pieces 4x3 rectangular jigsaw puzzle matrix powerpoint templates 0812
This template is skillfully designed and is completely editable to suit all the needs and requirements of the user. The color of the font, its size, style, and all other elements can be customized according to the user's desire The text in the PPT placeholder can be replaced with the desired information making this template highly flexible and adaptable as well. This template is also compatible with various Microsoft versions and formats like Google Slides, JPG, PDF, etc so the user will face no issue in saving it in the format of his choice.
-
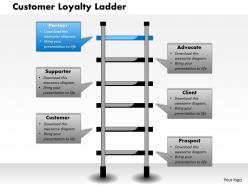 0514 customer loyalty ladder powerpoint presentation
We are proud to present our 0514 customer loyalty ladder powerpoint presentation. This customer loyalty ladder diagram can be used in planning process. This unique graphic diagram template is designed to define important stages of any business process. Create a vision of the future with your thoughts.
-
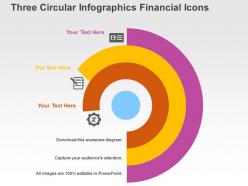 Three circular infographics financial icons flat powerpoint design
We are proud to present our three circular infographics financial icons flat powerpoint design. Graphic of three circular info graphics and financial icons has been used to craft this power point template diagram. This PPT diagram contains the concept of finance data representation. Use this PPT diagram for business and finance related presentations.
-
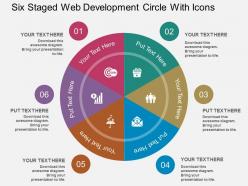 Cr six staged web development circle with icons flat powerpoint design
Presenting cr six staged web development circle with icons flat powerpoint design. Six staged web development circle with icons has been used to craft this power point template diagram. This PPT diagram contains the concept of web development techniques. Use this PPT diagram for business and technology related presentations.
-
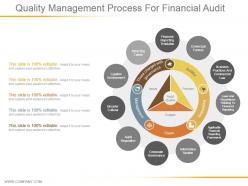 Quality management process for financial audit ppt model
Presenting quality management process for financial audit ppt model. This is a quality management process for financial audit ppt model. This is a eleven stage process. The stages in this process are financial reporting timetable, attracting talent, ligation environment, broader cultural, audit regulation.
-
 Opportunity cost time and money balance
Presenting opportunity cost time and money balance. This is a opportunity cost time and money balance. This is a two stage process. The stages in this process are alternative cost, opportunity cost, alternative price, expected return.
-
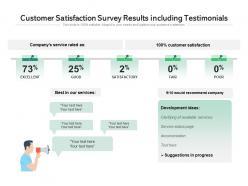 Customer Satisfaction Survey Results Including Testimonials
Presenting this set of slides with name Customer Satisfaction Survey Results Including Testimonials. This is a five stage process. The stages in this process are Excellent, Good, Satisfactory, Fair, Poor. This is a completely editable PowerPoint presentation and is available for immediate download. Download now and impress your audience.
-
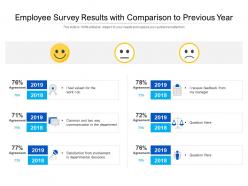 Employee survey results with comparison to previous year
Presenting this set of slides with name Employee Survey Results With Comparison To Previous Year. This is a six stage process. The stages in this process are Communication, Involvement, Departmental Decisions. This is a completely editable PowerPoint presentation and is available for immediate download. Download now and impress your audience.
-
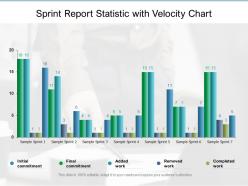 Sprint report statistic with velocity chart
Presenting this set of slides with name Sprint Report Statistic With Velocity Chart. The topics discussed in these slides are Initial Commitment, Final Commitment, Added Work, Removed Work, Completed Work. This is a completely editable PowerPoint presentation and is available for immediate download. Download now and impress your audience.
-
 Contribution icon with dollar coin and packaging box
Presenting this set of slides with name Contribution Icon With Dollar Coin And Packaging Box. This is a three stage process. The stages in this process are Contribution Icon With Dollar Coin And Packaging Box. This is a completely editable PowerPoint presentation and is available for immediate download. Download now and impress your audience.
-
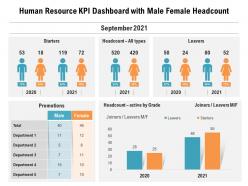 Human resource kpi dashboard with male female headcount
Presenting our well structured Human Resource KPI Dashboard With Male Female Headcount. The topics discussed in this slide are Human Resource KPI Dashboard With Male Female Headcount. This is an instantly available PowerPoint presentation that can be edited conveniently. Download it right away and captivate your audience.
-
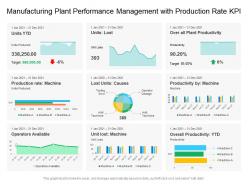 Manufacturing plant performance management with production rate kpi
Introducing our Manufacturing Plant Performance Management With Production Rate KPI set of slides. The topics discussed in these slides are Operators Available, Productivity, Target, Performance Management, Manufacturing Plant. This is an immediately available PowerPoint presentation that can be conveniently customized. Download it and convince your audience.
-
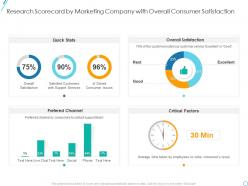 Research scorecard by marketing marketing research scorecard example
Present the topic in a bit more detail with this Research Scorecard By Marketing Marketing Research Scorecard Example. Use it as a tool for discussion and navigation on Research Scorecard By Marketing Company With Overall Consumer Satisfaction. This template is free to edit as deemed fit for your organization. Therefore download it now.
-
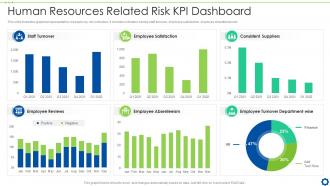 Human Resources Related Risk KPI Dashboard
This slide illustrates graphical representation of people key risk indicators. It includes indicators namely staff turnover, employee satisfaction, employee absenteeism etc. Presenting our well structured Human Resources Related Risk KPI Dashboard. The topics discussed in this slide are Staff Turnover, Employee Satisfaction, Consistent Suppliers, Employee Absenteeism. This is an instantly available PowerPoint presentation that can be edited conveniently. Download it right away and captivate your audience.
-
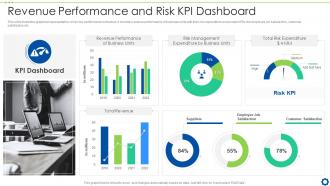 Revenue Performance And Risk KPI Dashboard Snapshot
This slide illustrates graphical representation of risk key performance indicators. It includes revenue performance of business units with their risk expenditure and people KRIs like employee job satisfaction, customer satisfaction etc. Introducing our Revenue Performance And Risk KPI Dashboard set of slides. The topics discussed in these slides are KPI Dashboard, Revenue Performance of Business Units, Risk Management Expenditure by Business Units. This is an immediately available PowerPoint presentation that can be conveniently customized. Download it and convince your audience.
-
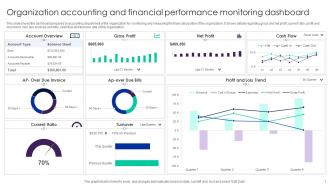 Organization Accounting And Financial Performance Monitoring Dashboard
This slide shows the dashboard prepared by accounting department of the organization for monitoring and measuring the financial position of the organization. It shows details regarding gross and net profit, current ratio, profit and loss trend, over due invoices and bills, cash flow and turnover rate of the organization. Introducing our Organization Accounting And Financial Performance Monitoring Dashboard set of slides. The topics discussed in these slides are Account Overview, Current Ratio, Net Profit. This is an immediately available PowerPoint presentation that can be conveniently customized. Download it and convince your audience.
-
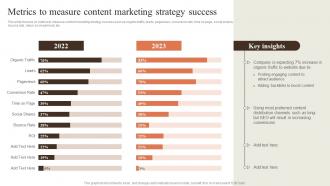 Metrics To Measure Content Marketing Strategy Creating Content Marketing Strategy
This slide focuses on metrics to measure content marketing strategy success such as organic traffic, leads, pageviews, conversion rate, time on page, social shares, bounce rate, return on investment, etc. Present the topic in a bit more detail with this Metrics To Measure Content Marketing Strategy Creating Content Marketing Strategy. Use it as a tool for discussion and navigation on Metrics To Measure, Content Marketing, Strategy Success. This template is free to edit as deemed fit for your organization. Therefore download it now.
-
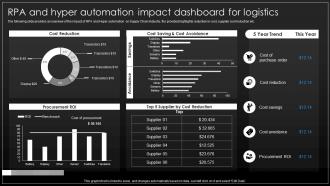 Implementation Process Of Hyper Automation RPA And Hyper Automation Impact Dashboard For Logistics
The following slide provides an overview of the impact of RPA and Hyper automation on Supply Chain Industry, the provided highlights reduction in cost, supplier cost reduction etc. Present the topic in a bit more detail with this Implementation Process Of Hyper Automation RPA And Hyper Automation Impact Dashboard For Logistics. Use it as a tool for discussion and navigation on Cost Reduction, Cost Saving, Cost Avoidance. This template is free to edit as deemed fit for your organization. Therefore download it now.
-
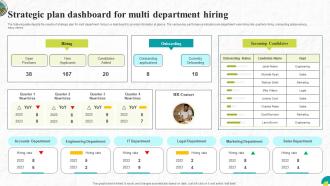 Strategic Plan Dashboard For Multi Department Hiring
The following slide depicts the results of strategic plan for multi department hiring in a dashboard to provide information at glance. The various key performance indicators are department wise hiring rate, quarterly hiring, onboarding status among many others Introducing our Strategic Plan Dashboard For Multi Department Hiring set of slides. The topics discussed in these slides are Strategic, Department, Hiring. This is an immediately available PowerPoint presentation that can be conveniently customized. Download it and convince your audience.
-
 Steps To Set Up Open Door Policy Comprehensive Communication Plan
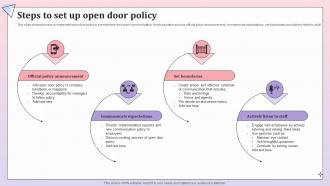
This slide shows process to implement open door policy to promote free and open communication. It include steps such as official policy announcement, communicate expectations, set boundaries and actively listen to stuff.Increase audience engagement and knowledge by dispensing information using Steps To Set Up Open Door Policy Comprehensive Communication Plan. This template helps you present information on four stages. You can also present information on Communicate Expectations, Maintain Eye Contact, Provide Implementation using this PPT design. This layout is completely editable so personaize it now to meet your audiences expectations.
-
 Global Statistics Highlighting ERP Project Success Enhancing Business Operations
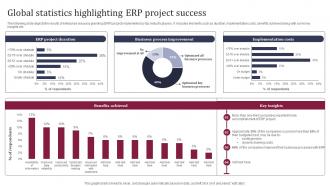
The following slide depicts the results of enterprise resource planning ERP project implemented by top industry players. It includes elements such as duration, implementation costs, benefits achieved along with some key insights etc. Present the topic in a bit more detail with this Global Statistics Highlighting ERP Project Success Enhancing Business Operations. Use it as a tool for discussion and navigation on Project Duration, Business Process Improvement, Implementation Costs. This template is free to edit as deemed fit for your organization. Therefore download it now.
-
 Review Yearly Employee Engagement Score Effective Employee Engagement
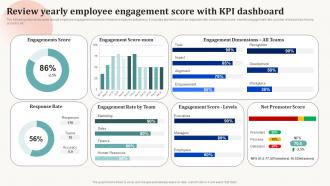
The following slide showcases annual employee engagement scores to measure employee activeness. It includes elements such as response rate, net promotor score, monthly engagement rate, number of responses, teams, accuracy etc. Deliver an outstanding presentation on the topic using this Review Yearly Employee Engagement Score Effective Employee Engagement. Dispense information and present a thorough explanation of Engagements Score, Engagement Score Mom, Engagement Dimensions using the slides given. This template can be altered and personalized to fit your needs. It is also available for immediate download. So grab it now.
-
 Business powerpoint templates animated smiley face express great emotion sales ppt slides
Use this Animated 3D PowerPoint Diagram to express the Cheerful Situation. This Diagram symbolizes Victory, Happiness, enjoyment, joviality, joy, jubilation, laughter, lightheartedness, merriment, mirth, optimism, paradise, peace of mind.
-
 Business growth graph
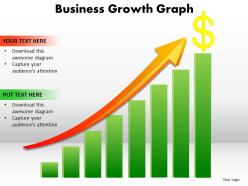
This template is skillfully designed and is completely editable to suit all the needs and requirements of the user. The color of the font, its size, style, and all other elements can be customized according to the user's desire The text in the PPT placeholder can be replaced with the desired information making this template highly flexible and adaptable as well. This template is also compatible with various Microsoft versions and formats like Google Slides, JPG, PDF, etc so the user will face no issue in saving it in the format of his choice.
-
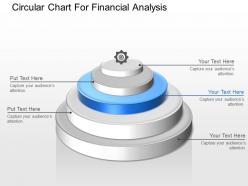 Circular chart for financial analysis powerpoint template slide
We are proud to present our circular chart for financial analysis powerpoint template slide. This power point template diagram has been crafted with graphic of circular chart. This PPT diagram contains the concept of financial analysis. Use this PPT diagram for business and finance related presentations.
-
 Budget icon dollar piggy
Presenting budget icon dollar piggy. This is a budget icon dollar piggy. This is a three stage process. The stages in this process are budget icon, fund icon, expense icon.
-
 Credit risk assessment matrix showing various risks
Presenting this set of slides with name - Credit Risk Assessment Matrix Showing Various Risks. This is a four stage process. The stages in this process are Credit Risk, Credit Control.
-
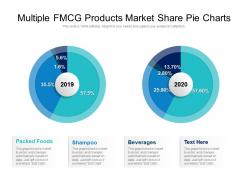 Multiple fmcg products market share pie charts
Presenting this set of slides with name Multiple FMCG Products Market Share Pie Charts. The topics discussed in these slides are Packed Foods, Shampoo, Beverages. This is a completely editable PowerPoint presentation and is available for immediate download. Download now and impress your audience.
-
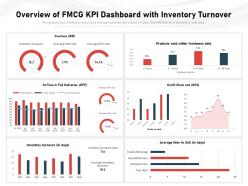 Overview of fmcg kpi dashboard with inventory turnover
Presenting this set of slides with name Overview Of FMCG KPI Dashboard With Inventory Turnover. The topics discussed in these slides are Product, Stock, Average Time. This is a completely editable PowerPoint presentation and is available for immediate download. Download now and impress your audience.
-
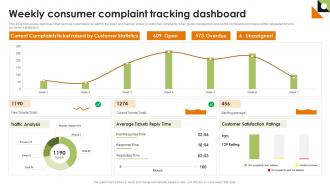 Weekly Consumer Complaint Tracking Dashboard
This slide showcases dashboard that can help organization to identify the open and overdue status of customer complaints. It can guide managers to resolve the complaints and issues within stipulated time for customer satisfaction. Presenting our well-structured Weekly Consumer Complaint Tracking Dashboard. The topics discussed in this slide are Weekly Consumer Complaint, Tracking Dashboard. This is an instantly available PowerPoint presentation that can be edited conveniently. Download it right away and captivate your audience.
-
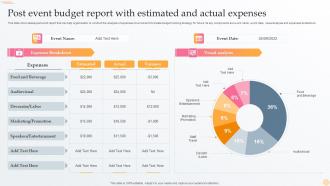 Post Event Budget Report With Estimated And Actual Expenses
This slide showcases post event report that can help organization to conduct the analysis of expenses incurred and formulate budget tracking strategy for future. Its key components are event name, event date, visual analysis and expenses breakdown Introducing our Post Event Budget Report With Estimated And Actual Expenses set of slides. The topics discussed in these slides are Post Event, Budget Report, Estimated, Actual Expenses. This is an immediately available PowerPoint presentation that can be conveniently customized. Download it and convince your audience.
-
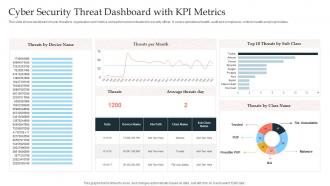 Cyber Security Threat Dashboard With KPI Metrics
This slide shows dashboard of cyber threats to organization and metrics and performance indicators for security officer. It covers operational health, audit and compliance, controls health and project status. Introducing our Cyber Security Threat Dashboard With KPI Metrics set of slides. The topics discussed in these slides are Cyber Security Threat, Dashboard, KPI Metrics. This is an immediately available PowerPoint presentation that can be conveniently customized. Download it and convince your audience.
-
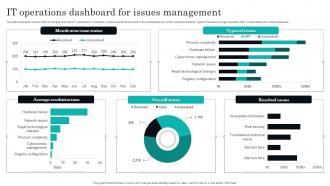 IT Operations Dashboard For Issues Management
The slide illustrates various KPIs to manage and track IT operations in business. Various elements included in the dashboard are month wise issue status, types of issues, average resolution time, overall status and resolved issues. Introducing our IT Operations Dashboard For Issues Management set of slides. The topics discussed in these slides are Overall Status, Resolved Issues, Resolution Time. This is an immediately available PowerPoint presentation that can be conveniently customized. Download it and convince your audience.
-
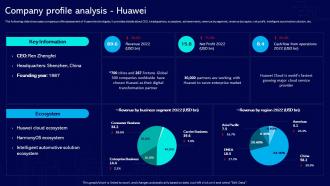 Company Profile Analysis Huawei Global Industrial Internet Of Things Market
The following slide showcases company profile assessment of Huawei technologies. It provides details about CEO, headquarters, ecosystem, achievements, revenue by segment, revenue by region, net profit, intelligent automotive solution, etc. Deliver an outstanding presentation on the topic using this Company Profile Analysis Huawei Global Industrial Internet Of Things Market. Dispense information and present a thorough explanation of Enterprise Market, Cloud Service Provider, Digital Transformation Partner using the slides given. This template can be altered and personalized to fit your needs. It is also available for immediate download. So grab it now.
-
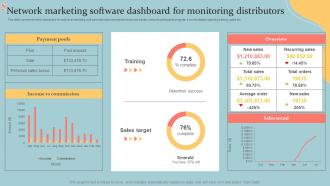 Network Marketing Software Dashboard For Monitoring Distributors Executive MLM Plan MKT SS V
This slide represents metric dashboard for multi level marketing software that helps marketers to track and monitor network participants progress. It covers details regarding training, sales etc. Present the topic in a bit more detail with this Network Marketing Software Dashboard For Monitoring Distributors Executive MLM Plan MKT SS V. Use it as a tool for discussion and navigation on Payment Pools, Overview, Sales Trend. This template is free to edit as deemed fit for your organization. Therefore download it now.
-
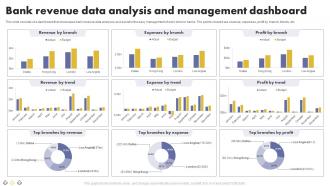 Bank Revenue Data Analysis And Management Dashboard
This slide consists of a dashboard that showcases bank revenue data analyses as it assist in the easy management of work done in banks. The points covered are revenue, expenses, profit by branch, trends, etc. Introducing our Bank Revenue Data Analysis And Management Dashboard set of slides. The topics discussed in these slides are Revenue By Branch, Expenses By Branch, Profit By Branch. This is an immediately available PowerPoint presentation that can be conveniently customized. Download it and convince your audience.
-
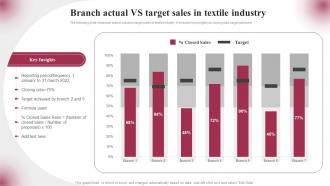 Branch Actual VS Target Sales In Textile Industry
The following slide showcase branch actual vs target sales in textile industry. It includes key insights as closing ratio, target achieved. Presenting our well structured Branch Actual VS Target Sales In Textile Industry. The topics discussed in this slide are Key Insights. This is an instantly available PowerPoint presentation that can be edited conveniently. Download it right away and captivate your audience.
-
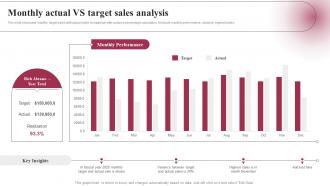 Monthly Actual VS Target Sales Analysis
This slide showcase monthly target sales with actual sales comparison with variance percentage calculation. It include monthly performance, variance, highest sales. Presenting our well structured Monthly Actual VS Target Sales Analysis. The topics discussed in this slide are Monthly Performance. This is an instantly available PowerPoint presentation that can be edited conveniently. Download it right away and captivate your audience.
-
 Global Store Count Uniqlo Company Profile Ppt Professional CP SS
Mentioned slide provides information about number of stores present globally. It includes number of restaurants present globally, years of growth, and key insights. Present the topic in a bit more detail with this Global Store Count Uniqlo Company Profile Ppt Professional CP SS. Use it as a tool for discussion and navigation on Global Store Count. This template is free to edit as deemed fit for your organization. Therefore download it now.
-
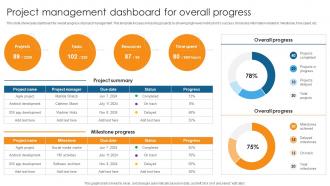 Project Management Dashboard For Overall Progress Guide On Navigating Project PM SS
This slide showcases dashboard for overall progress of project management. This template focuses on tracking projects by showing high level metrics for its success. It includes information related to milestones, time spent, etc. Deliver an outstanding presentation on the topic using this Project Management Dashboard For Overall Progress Guide On Navigating Project PM SS. Dispense information and present a thorough explanation of Resources, Spent, Projects using the slides given. This template can be altered and personalized to fit your needs. It is also available for immediate download. So grab it now.
-
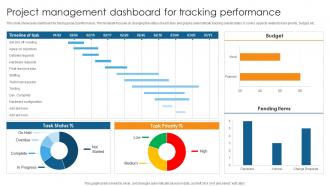 Project Management Dashboard For Tracking Guide On Navigating Project PM SS
This slide showcases dashboard for tracing project performance. This template focuses on changing the status of each task and graphs automatically tracking overall status. It covers aspects related to task priority, budget, etc. Present the topic in a bit more detail with this Project Management Dashboard For Tracking Guide On Navigating Project PM SS. Use it as a tool for discussion and navigation on Management, Tracking, Performance. This template is free to edit as deemed fit for your organization. Therefore download it now.
-
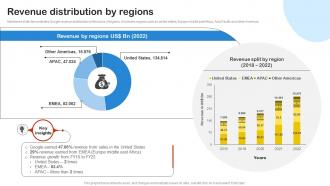 Revenue Distribution By Regions Digital Advertising And Promotion Company Profile CP SS V
Mentioned slide demonstrates Google revenue distribution on the basis of regions. It includes regions such as united states, Europe middle east Africa, Asia Pacific and other Americas. Present the topic in a bit more detail with this Revenue Distribution By Regions Digital Advertising And Promotion Company Profile CP SS V. Use it as a tool for discussion and navigation on Revenue, Google, Sales. This template is free to edit as deemed fit for your organization. Therefore download it now.
-
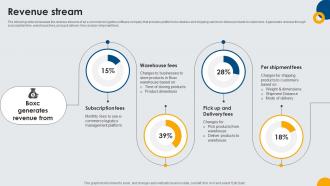 Revenue Stream International Shipping Company Investor Funding Elevator Pitch Deck
The following slide showcases the revenue streams of an e commerce logistics software company that provides platforms to retailers and shipping carriers to deliver products to customers. It generates revenue through subscription fees, warehouse fees, pickup and delivery fees and per shipment fees. Deliver an outstanding presentation on the topic using this Revenue Stream International Shipping Company Investor Funding Elevator Pitch Deck. Dispense information and present a thorough explanation of Subscription, Warehouse, Delivery using the slides given. This template can be altered and personalized to fit your needs. It is also available for immediate download. So grab it now.
-
 Dashboard Tracking Corporate Compliance Training Status
This slide showcases the dashboard monitoring compliance training status. It include details such as completion rate, non-complaint, compliance rate, etc. Introducing our Dashboard Tracking Corporate Compliance Training Status set of slides. The topics discussed in these slides are Completion Rate, Compliance Rate. This is an immediately available PowerPoint presentation that can be conveniently customized. Download it and convince your audience.
-
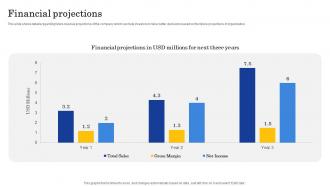 Financial Projections Finance Management Mobile Application
This slide shows details regarding future revenue projections of the company which can help investors to take better decisions based on the future projections of organization. Deliver an outstanding presentation on the topic using this Financial Projections Finance Management Mobile Application. Dispense information and present a thorough explanation of Financial Projections, USD Millions, Future Projections Organization using the slides given. This template can be altered and personalized to fit your needs. It is also available for immediate download. So grab it now.
-
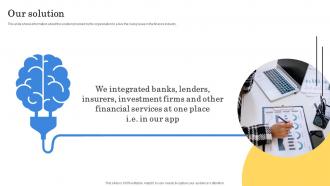 Our Solution Finance Management Mobile Application
This slide shows information about the solution provided by the organization to solve the rising issue in the finance industry. Increase audience engagement and knowledge by dispensing information using Our Solution Finance Management Mobile Application. This template helps you present information on one stages. You can also present information on Investment, Financial, Services, Organization, Information using this PPT design. This layout is completely editable so personalize it now to meet your audiences expectations.


