Finance PowerPoint Templates, Presentation Slide Diagrams & PPT Graphics
- Sub Categories
-
- 30 60 90 Day Plan
- Advertising
- Agile Development
- Aims and Objectives
- Arrows
- Before and After
- Blockchain Bitcoin
- Boxes
- Business
- Calender
- Case Study
- Celebrations
- Certificates
- Challenges Opportunities
- Channel Distribution
- Children
- Communication
- Competitive Landscape
- Computer
- Concepts
- Construction Management
- Corporate
- Crowdfunding
- Current State Future State
- Custom PowerPoint Diagrams
- Digital Transformation
- Dos and Donts
- Economics
- Education
- Environment
- Events
- Festival
- Finance
- Financials
- Food
- Game
- Gap Analysis
- Generic
- Geographical
- Health
- Heatmaps
- Holidays
- Icons
- Input Process Output
- Internet
- Key Messages
- Key Wins
- Ladder
- Leadership
- Lists
- Lucky Draw
- Management
- Marketing
- Measuring
- Medical
- Music
- News
- Next Steps
- People Process Technology
- Pillars
- Planning
- Post-it-Notes
- Problem Statement
- Process
- Proposal Management
- Pros and Cons
- Puzzle
- Puzzles
- Recruitment Strategy
- Religion
- Research and Development
- Risk Mitigation Strategies
- Roadmap
- Selling
- Shapes
- Short Term Long Term
- Social
- Stairs
- Start Stop Continue
- Strategy
- Symbol
- Technology
- Thesis Defense Dissertation
- Timelines
- Traffic
- Transition Plan
- Transportation
- Vehicles
- Venture Capital Funding
- Warning
- Winners
- Word Cloud
-
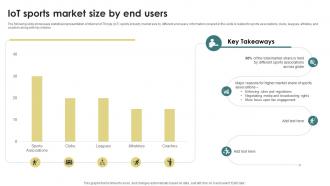 Future Of Sports IoT Sports Market Size By End Users IoT SS
Present the topic in a bit more detail with this Future Of Sports IoT Sports Market Size By End Users IoT SS Use it as a tool for discussion and navigation on Sports Associations, Enforcing Rules And Regulations, Broadcasting Rights This template is free to edit as deemed fit for your organization. Therefore download it now.
-
 Subjects on a blackboard style 1 powerpoint presentation slides
These high quality, editable pre-designed powerpoint slides and powerpoint templates have been carefully created by our professional team to help you impress your audience. Each graphic in every powerpoint slide is vector based and is 100% editable in powerpoint.Each and every property of any slide - color, size, shading etc can be modified to build an effective powerpoint presentation. Use these slides to convey complex business concepts in a simplified manner. Any text can be entered at any point in the powerpoint slide. Simply DOWNLOAD, TYPE and PRESENT
-
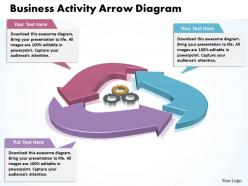 Business activity arrow diagram powerpoint templates ppt presentation slides 0812
The unique shape of the This PowerPoint diagram slide provides option to explain your idea clearly.
-
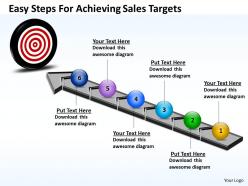 Business powerpoint templates easy steps for achieving sales targets ppt slides
This PowerPoint template shows Step Plan which consists of 6 Stages. It can be used to to show grouped or related information.
-
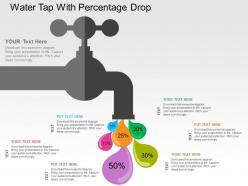 Water tap with percentage drop flat powerpoint design
We are proud to present our water tap with percentage drop flat powerpoint design. Graphic of water tap and percentage drop has been used to craft this power point template diagram. This PPT diagram contains the concept of financial interest calculation. Use this PPT diagram for business and finance related presentations.
-
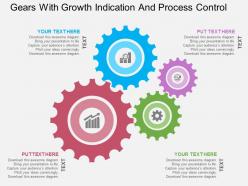 Gears with growth indication and process control flat powerpoint design
We are proud to present our gears with growth indication and process control flat powerpoint design. Graphic of gears has been used to craft this power point template diagram. This PPT diagram contains the concept of growth indication and process control .Use this PPT diagram for marketing and business related presentations.
-
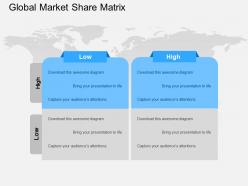 Global market share matrix flat powerpoint design
We are proud to present our global market share matrix flat powerpoint design. Graphic of matrix has been used to craft this power point template diagram. This PPT diagram contains the concept of global market share .Use this PPT diagram for global marketing and finance related presentations.
-
 Human hand with bulb head key for idea generation flat powerpoint design
We are proud to present our human hand with bulb head key for idea generation flat powerpoint design. Graphic of human hand with bulb head key has been used to craft this power point template diagram. This PPT diagram contains the concept of idea generation. Use this PPT diagram for business and management related presentations.
-
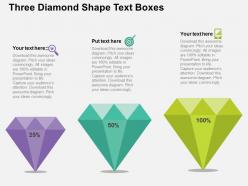 Three diamond shape text boxes flat powerpoint design
We are proud to present our three diamond shape text boxes flat powerpoint design. Three diamond shape text boxes has been used to craft this power point template diagram. This PPT diagram contains the concept of business data representation. Use this PPT diagram for business and management related presentations.
-
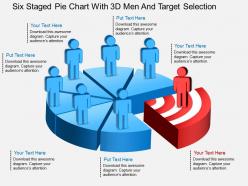 Fz six staged pie chart with 3d men and target selection powerpoint template
PowerPoint templates run smoothly with each software capable of displaying slides. Convert to JPG and PDF. Compatible with Google slides. Convenient widescreen viewing without PPT graphics pixilation. High resolution PPT graphics let you see more clearly. Highly customizable layout including font, text, color and design. This example of PPT presentation slide can be applied for businesses, educational institutes, data analytics.
-
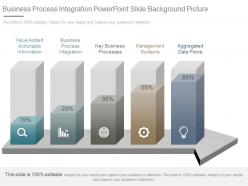 Business process integration powerpoint slide background picture
Presenting business process integration powerpoint slide background picture. This is a business process integration powerpoint slide background picture. This is a five stage process. The stages in this process are value added actionable information, business process integration, key business processes, management systems, aggregated data flows.
-
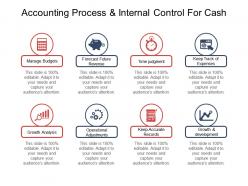 Accounting process and internal control for cash good ppt example
Presenting accounting process and internal control for cash good ppt example. This is a accounting process and internal control for cash good ppt example. This is a eight stage process. The stages in this process are accounting, book keeping, auditing.
-
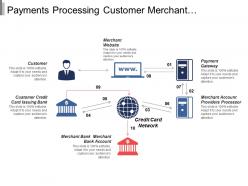 Payments processing customer merchant gateway account bank
Presenting, payments processing customer-merchant gateway account bank PPT deck. This is a flat layout for displaying a complete purchase and payment plan. This PPT template can be practiced by managers, employees and organizations, professionals from various background to present their ideas in a smart way. This slide is cooperative with Google Slides and subsequent downloading you can use it in full version and include your company's name, logo or trademark for a prime experience. You can alter the icons with the several icons available. Switch this design into jpeg or pdf form according to the demand.
-
 Money bag on hand icon
Presenting this set of slides with name Money Bag On Hand Icon. This is a one stage process. The stages in this process are Money Bag, Dollar, Coins Icon. This is a completely editable PowerPoint presentation and is available for immediate download. Download now and impress your audience.
-
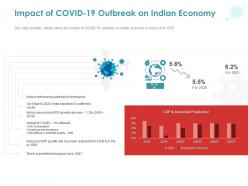 Impact of covid 19 outbreak on indian economy ppt powerpoint presentation picture
This slide provides details about the impact of COVID-19 outbreak on Indian economy in terms of its GDP. Presenting this set of slides with name Impact Of COVID 19 Outbreak On Indian Economy Ppt Powerpoint Presentation Picture. The topics discussed in these slides are GDP And Industrial Production, Industrial Production, GDP Growth Rate, Coronavirus, Credit Growth Slowdown, Disruptions In Potential Supply Side . This is a completely editable PowerPoint presentation and is available for immediate download. Download now and impress your audience.
-
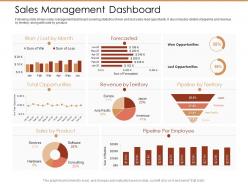 Sales management dashboard snapshot ppt powerpoint presentation icon
Following slide shows sales management dashboard covering statistics of won and lost sales lead opportunity. It also includes details of pipeline and revenue by territory along with sale by product. Presenting this set of slides with name Sales Management Dashboard snapshot Ppt Powerpoint Presentation Icon. The topics discussed in these slides are Won Opportunities, Lost Opportunities, Total Opportunities, Revenue By Territory, Pipeline By Territory. This is a completely editable PowerPoint presentation and is available for immediate download. Download now and impress your audience.
-
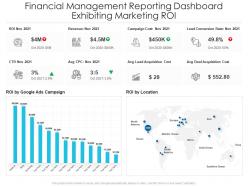 Financial management reporting dashboard exhibiting marketing roi
Presenting our well-structured Financial Management Reporting Dashboard Exhibiting Marketing ROI. The topics discussed in this slide are Acquisition Cost, Revenue, Campaign Cost. This is an instantly available PowerPoint presentation that can be edited conveniently. Download it right away and captivate your audience.
-
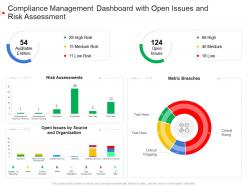 Compliance management dashboard with open issues and risk assessment
Presenting our well structured Compliance Management Dashboard With Open Issues And Risk Assessment. The topics discussed in this slide are Risk Assessments, Organization, Metric Breaches. This is an instantly available PowerPoint presentation that can be edited conveniently. Download it right away and captivate your audience.
-
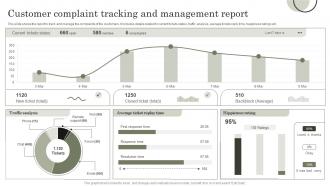 Customer Complaint Tracking And Management Report
This slide shows the report to track and manage the complaints of the customers. It includes details related to current tickets status, traffic analysis, average tickets reply time, happiness ratings etc. Presenting our well structured Customer Complaint Tracking And Management Report. The topics discussed in this slide are Traffic Analysis, Average Ticket Replay Time, Hippieness Rating. This is an instantly available PowerPoint presentation that can be edited conveniently. Download it right away and captivate your audience.
-
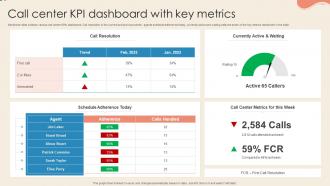 Call Center KPI Dashboard With Key Metrics
Mentioned slide outlines various call center KPIs dashboard. Call resolution in the current and previous month, agents schedule adherence today, currently active and waiting calls are some of the key metrics mentioned in the slide. Presenting our well structured Call Center KPI Dashboard With Key Metrics. The topics discussed in this slide are Call Resolution, Currently Active, Agent. This is an instantly available PowerPoint presentation that can be edited conveniently. Download it right away and captivate your audience.
-
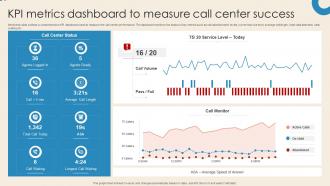 KPI Metrics Dashboard To Measure Call Center Success
Mentioned slide outlines a comprehensive KPI dashboard used to measure the call center performance. The dashboard monitors the status of key metrics such as call abandonment levels, current service level, average call length, total calls attended, calls waiting etc. Introducing our KPI Metrics Dashboard To Measure Call Center Success set of slides. The topics discussed in these slides are Volume, Agents Ready, Call Monitor. This is an immediately available PowerPoint presentation that can be conveniently customized. Download it and convince your audience.
-
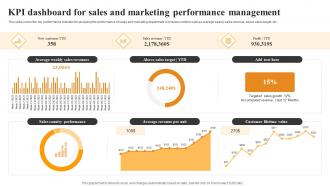 KPI Dashboard For Sales And Marketing Performance Management
This slide covers the key performance indicator for analyzing the performance of sales and marketing department. It includes metrics such as average weekly sales revenue, above sales target, etc. Presenting our well structured KPI Dashboard For Sales And Marketing Performance Management. The topics discussed in this slide are Weekly Sales Revenues, Above Sales Target, Sales Country Performance. This is an instantly available PowerPoint presentation that can be edited conveniently. Download it right away and captivate your audience.
-
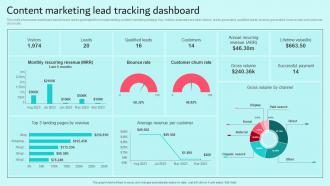 Content Marketing Lead Tracking Dashboard Brand Content Strategy Guide MKT SS V
This slide showcases dashboard used to track leads generated from implementing content marketing strategy. Key metrics evaluated are total visitors, leads generated, qualified leads, revenue generated, bounce rate and customer churn rate. Present the topic in a bit more detail with this Content Marketing Lead Tracking Dashboard Brand Content Strategy Guide MKT SS V. Use it as a tool for discussion and navigation on Customers, Annual, Revenue. This template is free to edit as deemed fit for your organization. Therefore download it now.
-
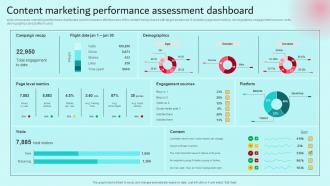 Content Marketing Performance Assessment Dashboard Brand Content Strategy Guide MKT SS V
slide showcases marketing performance dashboard used to measure effectiveness of the content being shared with target audiences. It includes page level metrics, demographics, engagement sources, visits, demographics and platform used. Deliver an outstanding presentation on the topic using this Content Marketing Performance Assessment Dashboard Brand Content Strategy Guide MKT SS V. Dispense information and present a thorough explanation of Marketing, Performance, Sources using the slides given. This template can be altered and personalized to fit your needs. It is also available for immediate download. So grab it now.
-
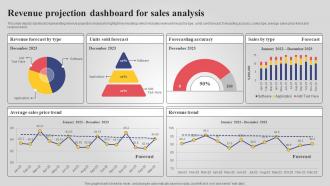 Revenue Projection Dashboard For Sales Analysis
This slide depicts dashboard representing revenue projection analysis to highlight key headings which includes revenue forecast by type, units sold forecast, forecasting accuracy, sales type, average sales price trend and revenue trend. Introducing our Revenue Projection Dashboard For Sales Analysis set of slides. The topics discussed in these slides are Revenue Forecast By Type, Units Sold Forecast. This is an immediately available PowerPoint presentation that can be conveniently customized. Download it and convince your audience.
-
 Business activity diagram planning process 7 stages powerpoint templates ppt backgrounds for slides
High resolution images. Access to instantly download. Save in the variety of formats. Work well with Google slides. Provided instructions to make changes. Instant customization allowed. Insert your company logo in the background. Useful for the business leads, owners, managers and the trade learners.
-
 Business organizational chart examples 6 stages powerpoint templates ppt backgrounds for slides
Pixel friendly resolution of the graphics. Easy to edit and save using Google slides. 100% modification of the slides allowed. Compatible with the offline softwares. Access to open on a wide screen preview. Useful for the Marketing Professionals, business leaders and the managers.
-
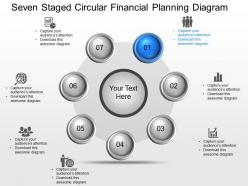 Seven staged circular financial planning diagram powerpoint template slide
Promptly conformable and downloadable PPT slides, quite suitable for finance professionals from diverse fields or areas, Editable text, font, background and PowerPoint Image, Easily convertible into PDF or JPG formats, Can be used with Google slides and on other software platforms, space option with the Presentation slide diagrams to insert the titles or subtitles as required.
-
 Investment risk monitor control process with arrows
Presenting investment risk monitor control process with arrows. This is a investment risk monitor control process with arrows. This is a four stage process. The stages in this process are investment risk, risk management, financial risk.
-
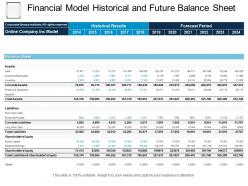 Financial model historical and future balance sheet
Presenting this set of slides with name - Financial Model Historical And Future Balance Sheet. This is a two stage process. The stages in this process are Financial Analysis, Income Statement, Balance Sheet.
-
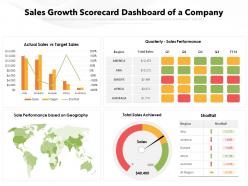 Sales growth scorecard dashboard snapshot of a company
Presenting the PowerPoint template titled Sales Growth Scorecard Dashboard Snapshot Of A Company. Use this PPT slide to deliver an informative presentation. Download it here and start editing it to match your needs. Input data and create HD visualization of graphs. You can then convert it to PNG, JPEG, and PDF formats and share and edit it with Google Slides. Avail its standard screen and widescreen sizes at the single tap.
-
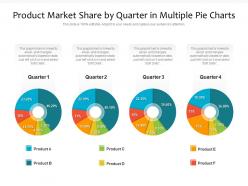 Product market share by quarter in multiple pie charts
Presenting this set of slides with name Product Market Share By Quarter In Multiple Pie Charts. The topics discussed in these slides are Product Market Share By Quarter In Multiple Pie Charts. This is a completely editable PowerPoint presentation and is available for immediate download. Download now and impress your audience.
-
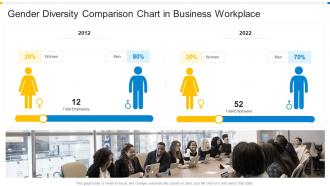 Gender diversity comparison chart in business workplace
Presenting our set of slides with Gender Diversity Comparison Chart In Business Workplace. This exhibits information on two stages of the process. This is an easy-to-edit and innovatively designed PowerPoint template. So download immediately and highlight information on Gender Diversity Comparison Chart In Business Workplace.
-
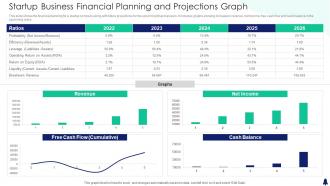 Startup Business Financial Planning And Projections Graph
This slide shows the financial planning for a startup company along with future projections for the upcoming financial years. It includes graphs showing increase in revenue, net income, free cash flow and cash balance in the upcoming years. Introducing our Startup Business Financial Planning And Projections Graph set of slides. The topics discussed in these slides are Revenue, Net Income, Free Cash Flow, Cash Balance. This is an immediately available PowerPoint presentation that can be conveniently customized. Download it and convince your audience.
-
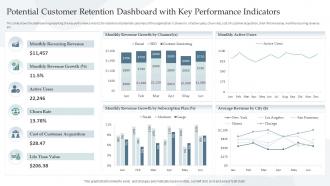 Potential Customer Retention Dashboard With Key Performance Indicators
This slide shows the dashboard representing the key performance metrics for retention of potential customers of the organization. It shows no. of active users, churn rate, cost of customer acquisition, their life time value, monthly recurring revenue etc. Introducing our Potential Customer Retention Dashboard With Key Performance Indicators set of slides. The topics discussed in these slides are Monthly Recurring Revenue, Customer Acquisition, Monthly Revenue Growth. This is an immediately available PowerPoint presentation that can be conveniently customized. Download it and convince your audience.
-
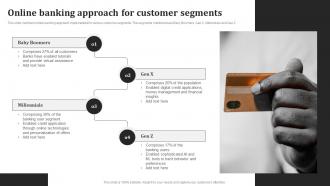 Online Banking Approach For Customer Segments
This slide mentions online banking approach implemented for various customer segments. The segments mentioned are Baby Boomers, Gen X, Millennials and Gen Z. Presenting our set of slides with name Online Banking Approach For Customer Segments. This exhibits information on four stages of the process. This is an easy-to-edit and innovatively designed PowerPoint template. So download immediately and highlight information on Baby Boomers, Millennials, Gen Z, Gen X.
-
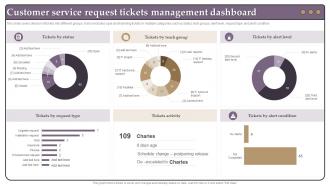 Customer Service Request Tickets Management Dashboard
This slide covers division of tickets into different groups. It also includes a pie chart dividing tickets in multiple categories such as status, tech groups, alert level, request type and alert condition. Introducing our Customer Service Request Tickets Management Dashboard set of slides. The topics discussed in these slides are Customer Service Request, Tickets Management, Dashboard. This is an immediately available PowerPoint presentation that can be conveniently customized. Download it and convince your audience.
-
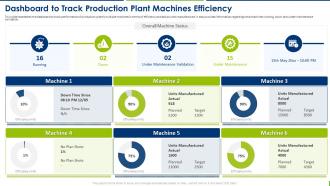 Production Plant Maintenance Management Dashboard To Track Production Plant Machines Efficiency
This slide represents the dashboard to track performance of production plants multiple machines in terms of efficiency and actual units manufactured. It also provides information regarding total machines running, down and under maintenance validation. Present the topic in a bit more detail with this Production Plant Maintenance Management Dashboard To Track Production Plant Machines Efficiency. Use it as a tool for discussion and navigation on Dashboard, Track Production, Plant Machines Efficiency. This template is free to edit as deemed fit for your organization. Therefore download it now.
-
 Fictional Representation Of Ideal Customer Persona Developing Branding Strategies
The following slide outlines the fictional model of a buyer persona. Information covered in this slide is related to customer personality, motivation, objectives, technology, issues and bio. Present the topic in a bit more detail with this Fictional Representation Of Ideal Customer Persona Developing Branding Strategies. Use it as a tool for discussion and navigation on Technology, Fictional Representation, Customer Persona. This template is free to edit as deemed fit for your organization. Therefore download it now.
-
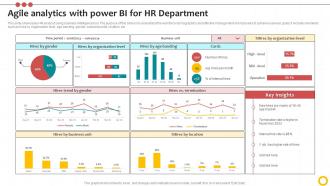 Agile Analytics With Power Bi For Hr Department
This slide showcases HR analysis using business intelligence tool. The purpose of this slide is to understand the workforce demographics and effective management of employees to achieve business goals. It includes elements such as hires by organization level, age banding, gender, business units, location, etc. Introducing our Agile Analytics With Power Bi For Hr Department set of slides. The topics discussed in these slides are Hires By Gender, Hires By Age Banding. This is an immediately available PowerPoint presentation that can be conveniently customized. Download it and convince your audience.
-
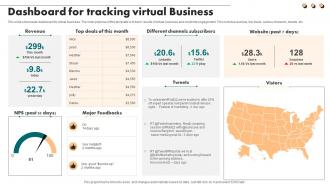 Dashboard For Tracking Virtual Business
This slide showcases dashboard for virtual business. The main purpose of this template is to track results of virtual business and customer engagement. This includes revenue, top deals, various channels, tweets, etc. Presenting our well structured Dashboard For Tracking Virtual Business. The topics discussed in this slide are Major Feedbacks, Revenue.This is an instantly available PowerPoint presentation that can be edited conveniently. Download it right away and captivate your audience.
-
 Total Deals Alibaba Company Profile Ppt Infographics CP SS
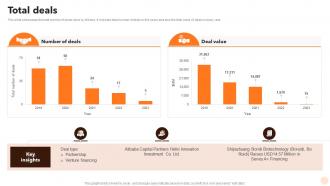
This slide showcases the total number of deals done by Alibaba. It includes total number of deals in five years and also the total value of deals in every year. Present the topic in a bit more detail with this Total Deals Alibaba Company Profile Ppt Infographics CP SS. Use it as a tool for discussion and navigation on Number Of Deals, Deal Value. This template is free to edit as deemed fit for your organization. Therefore download it now.
-
 Us Machinery And Pharmaceuticals Outbound Trade Business Plan BP SS
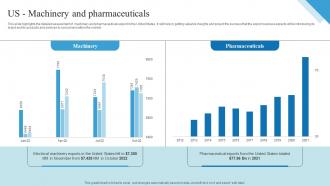
This slide highlights the detailed assessment of machinery and pharmaceuticals export in the United States. It will help in getting valuable insights and project the success that the export business expects while introducing its brand and its products and services to consumers within the market. Deliver an outstanding presentation on the topic using this Us Machinery And Pharmaceuticals Outbound Trade Business Plan BP SS Dispense information and present a thorough explanation of Machinery, Pharmaceuticals using the slides given. This template can be altered and personalized to fit your needs. It is also available for immediate download. So grab it now.
-
 Implementing Byod Policy To Enhance Employee Satisfaction Rate After Byod Implementation
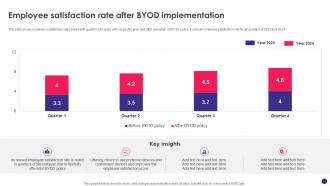
This slide shows employee satisfaction rates linked with quarters of 2 years with respect to prior and after execution of BYOD policy. It include employee satisfaction rate for all quarters of 2023 and 2024. Deliver an outstanding presentation on the topic using this Implementing Byod Policy To Enhance Employee Satisfaction Rate After Byod Implementation. Dispense information and present a thorough explanation of Employee Satisfaction Rate, BYOD Implementation, Employee Satisfaction Score using the slides given. This template can be altered and personalized to fit your needs. It is also available for immediate download. So grab it now.
-
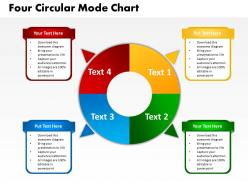 Four circular mode chart powerpoint templates graphics slides 0712
Use this graphic to represent a continuing sequence of stages, tasks, or events in a circular flow and emphasize the connection between all components.
-
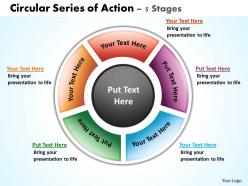 Circular series of action 5 stages powerpoint diagrams presentation slides graphics 0912
This diagram representing steps or actions in a process . Used to emphasize direction of movement and interconnections of stages in a flow.
-
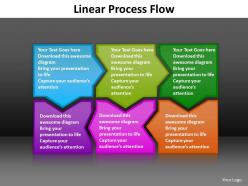 Linear process flow editable powerpoint templates infographics images 1121
This Business Oriented Chart will definitely help you to be more Successful. Use this graphics as key element in streamlining your plans.
-
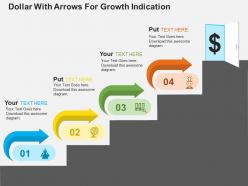 Dollar with arrows for growth indication flat powerpoint design
We are proud to present our dollar with arrows for growth indication flat powerpoint design. This power point template diagram has been crafted with graphic of dollar symbol and arrows. This PPT diagram contains the concept of growth indication. Use this PPT diagram for business and finance related presentations for your viewers.
-
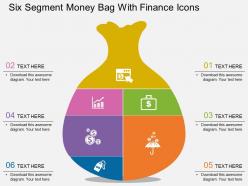 Bh six segment money bag with finance icons flat powerpoint design
Presenting bh six segment money bag with finance icons flat powerpoint design. Six segment money bag and finance icons have been used to craft this power point template diagram. This PPT diagram contains the concept of financial investment analysis. Use this PPT diagram can be used for business and finance related presentations.
-
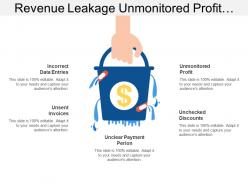 Revenue leakage unmonitored profit incorrect data entries
Presenting this set of slides with name - Revenue Leakage Unmonitored Profit Incorrect Data Entries. This is a one stage process. The stages in this process are Revenue Leakage, Capital Leakage, Income Leakage.
-
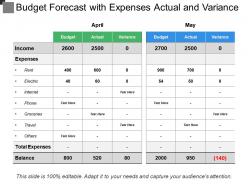 Budget forecast with expenses actual and variance
Presenting this set of slides with name - Budget Forecast With Expenses Actual And Variance. This is a two stage process. The stages in this process are Budget Forecast, Forecast Vs Actual Budget, Plan Vs Forecast.
-
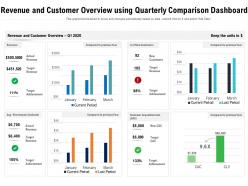 Revenue and customer overview using quarterly comparison dashboard
Presenting this set of slides with name Revenue And Customer Overview Using Quarterly Comparison Dashboard. The topics discussed in these slides are Revenue, Customer Overview, Target Achievement, Customer Acquisition Cost, Compared To Previous Year. This is a completely editable PowerPoint presentation and is available for immediate download. Download now and impress your audience.
-
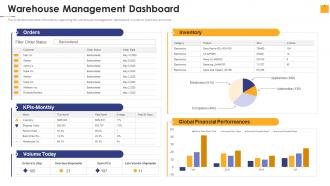 Warehouse Management Inventory Control Warehouse Management Dashboard
The slide demonstrates information regarding the warehouse management dashboard in order to track key activities. Present the topic in a bit more detail with this Warehouse Management Inventory Control Warehouse Management Dashboard. Use it as a tool for discussion and navigation on Warehouse Management Dashboard. This template is free to edit as deemed fit for your organization. Therefore download it now.
-
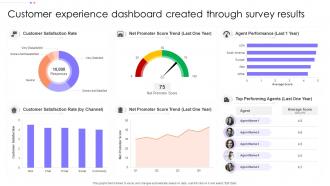 Customer Experience Dashboard Snapshot Created Through Survey Results
This graph or chart is linked to excel, and changes automatically based on data. Just left click on it and select Edit Data. Introducing our Customer Experience Dashboard Snapshot Created Through Survey Results set of slides. The topics discussed in these slides are Customer Satisfaction Rate, Agent Performance, Net Promoter, Score Trend. This is an immediately available PowerPoint presentation that can be conveniently customized. Download it and convince your audience.
-
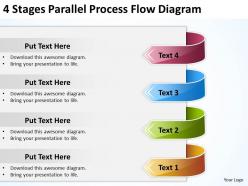 Business analysis diagrams process flow powerpoint templates ppt backgrounds for slides
We are proud to present our business analysis diagrams process flow powerpoint templates ppt backgrounds for slides. This PowerPoint Diagram shows you the Flow Diagram which consists of many steps to be covered in one Process. It is useful to explain components involved as well as the factors included in Process.
-
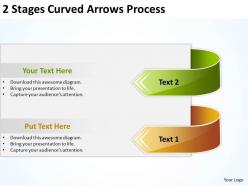 Business diagrams templates 2 stages curved arrows process powerpoint slides
We are proud to present our business diagrams templates 2 stages curved arrows process powerpoint slides. This PowerPoint slide shows parallel process arrow based diagram for strategic planning, business planning etc. You have some great folks working with you, thinking with you. A balanced approach to any situation is generally a guarantor of success.
-
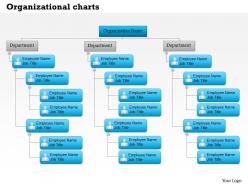 0514 organizational charts templates powerpoint presentation
We are proud to present our 0514 organizational charts templates powerpoint presentation. The template offers an excellent background to build up Organizational Chart. Give them an overview of your capability and insight into the minute details of the overall picture highlighting the interdependence at every operational level.
-
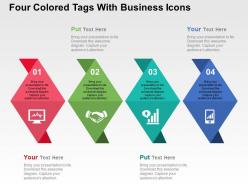 Four colored tags with business icons flat powerpoint design
We are proud to present our four colored tags with business icons flat powerpoint design. Graphic of four colored tags and business icons has been used to craft this power point template diagram. This PPT diagram contains the concept of business strategy representation. Use this PPT diagram for business and finance related presentations.
-
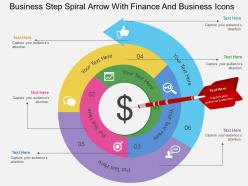 Gf business step spiral arrow with finance and business icons flat powerpoint design
Presenting gf business step spiral arrow with finance and business icons flat powerpoint design. This Power Point template diagram has been crafted with graphic of business step spiral arrow and icons. This PPT diagram contains the concept of business process flow representation. Use this PPT diagram for business and marketing related presentations.
-
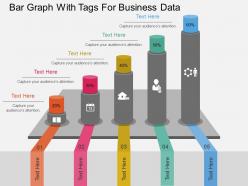 Pptx bar graph with tags for business data flat powerpoint design
Presenting pptx bar graph with tags for business data flat powerpoint design. This Power Point template diagram has been crafted with graphic of bar graph and tags icons. This PPT diagram contains the concept of business data analysis and business planning. Use this PPT diagram for business and finance related presentations.


