Finance PowerPoint Templates, Presentation Slide Diagrams & PPT Graphics
- Sub Categories
-
- 30 60 90 Day Plan
- Advertising
- Agile Development
- Aims and Objectives
- Arrows
- Before and After
- Blockchain Bitcoin
- Boxes
- Business
- Calender
- Case Study
- Celebrations
- Certificates
- Challenges Opportunities
- Channel Distribution
- Children
- Communication
- Competitive Landscape
- Computer
- Concepts
- Construction Management
- Corporate
- Crowdfunding
- Current State Future State
- Custom PowerPoint Diagrams
- Digital Transformation
- Dos and Donts
- Economics
- Education
- Environment
- Events
- Festival
- Finance
- Financials
- Food
- Game
- Gap Analysis
- Generic
- Geographical
- Health
- Heatmaps
- Holidays
- Icons
- Input Process Output
- Internet
- Key Messages
- Key Wins
- Ladder
- Leadership
- Lists
- Lucky Draw
- Management
- Marketing
- Measuring
- Medical
- Music
- News
- Next Steps
- People Process Technology
- Pillars
- Planning
- Post-it-Notes
- Problem Statement
- Process
- Proposal Management
- Pros and Cons
- Puzzle
- Puzzles
- Recruitment Strategy
- Religion
- Research and Development
- Risk Mitigation Strategies
- Roadmap
- Selling
- Shapes
- Short Term Long Term
- Social
- Stairs
- Start Stop Continue
- Strategy
- Symbol
- Technology
- Thesis Defense Dissertation
- Timelines
- Traffic
- Transition Plan
- Transportation
- Vehicles
- Venture Capital Funding
- Warning
- Winners
- Word Cloud
-
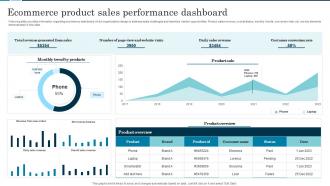 Ecommerce Product Sales Performance Dashboard
Following slide provides information regarding ecommerce dashboard which organizations design to address sales challenges and maximize market opportunities. Product sales revenue, overall status, monthly trends, conversion rate, etc. are key elements demonstrated in this slide. Introducing our Ecommerce Product Sales Performance Dashboard set of slides. The topics discussed in these slides are Daily Sales Revenue, Costumer Conversion Rate, Product Sale. This is an immediately available PowerPoint presentation that can be conveniently customized. Download it and convince your audience.
-
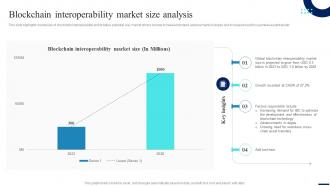 Blockchain Interoperability Market Size Analysis Connecting Ecosystems Introduction BCT SS
This slide highlights market size of blockchain interoperability and its future potential. Key market drivers include increased demand, advancements in dApps and increased need for seamless asset transfer. Present the topic in a bit more detail with this Blockchain Interoperability Market Size Analysis Connecting Ecosystems Introduction BCT SS. Use it as a tool for discussion and navigation on Global, Increasing, Development. This template is free to edit as deemed fit for your organization. Therefore download it now.
-
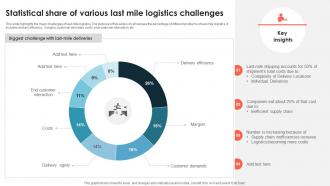 Statistical Share Of Various Last Mile Logistics Challenges Infographic Template Example
This slide highlights the major challenges of last mile logistics. The purpose of this slide is to showcase the percentage of different problems of last mile logistics. It includes delivery efficiency, margins, customer demands, costs, end customer interaction, etc. Introducing our Statistical Share Of Various Last Mile Logistics Challenges Infographic Template Example set of slides. The topics discussed in these slides are Statistical Share, Biggest Challenge, Last Mile Deliveries. This is an immediately available PowerPoint presentation that can be conveniently customized. Download it and convince your audience.
-
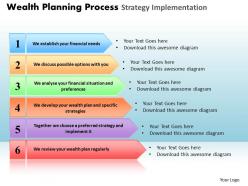 Wealth planning process strategy implementation powerpoint slides and ppt templates db
These high quality, editable pre-designed powerpoint slides and powerpoint templates have been carefully created by our professional team to help you impress your audience. Each graphic in every powerpoint slide is vector based and is 100% editable in powerpoint.Each and every property of any slide - color, size, shading etc can be modified to build an effective powerpoint presentation. Use these slides to convey complex business concepts in a simplified manner. Any text can be entered at any point in the powerpoint slide. Simply DOWNLOAD, TYPE and PRESENT
-
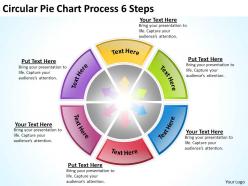 Sample business model diagram circular pie chart process 6 steps powerpoint templates
We are proud to present our sample business model diagram circular pie chart process 6 steps powerpoint templates. This diagram illustrates the foundation-based relationships in presentations dedicated to business hierarchy, business processes, stages of business processes, organizations, etc. Our PPTs will generate and maintain the level of interest you desire. They will create the impression you want to imprint on your audience.
-
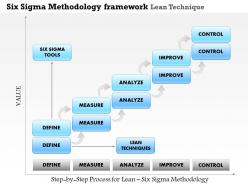 0514 six sigma methodology framework lean techniques powerpoint presentation
Must-have tool for every business presentation and professionals working in major companies. High resolution PPT graphics are not prone to pixilate when projected on bigger screens. PPT layout is amendable with respect to font text, design and color. No space-constraints while adding titles or sub-titles. Compatible with Google slides and runs smoothly with softwares. Minimal usage of storage and quick to download.
-
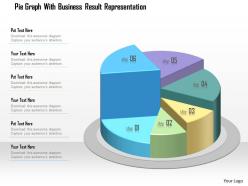 1214 pie graph with business result representation powerpoint template
We are proud to present our 1214 pie graph with business result representation powerpoint template. Pie graph has been used to design this power point template. This PPT contains the concept of business result analysis. Use this PPT for your business presentations and get good comments from your viewers.
-
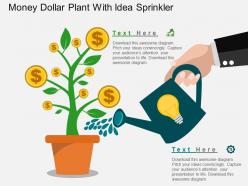 Bm money dollar plant with idea sprinkler flat powerpoint design
Presenting bm money dollar plant with idea sprinkler flat powerpoint design. This Power Point template diagram has been crafted with graphic of money dollar plant and sprinkler. This PPT diagram contains the concept of financial growth indication. Use this PPT diagram for business and finance related presentations.
-
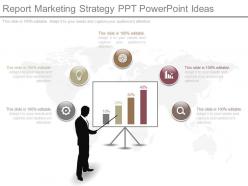 Ppt report marketing strategy ppt powerpoint ideas
Time saving PowerPoint template on part of designing and formatting. Professionally proficient PPT presentation layout. Easily editable colors, text, fonts, shapes, icons and orientation. Impressive picture quality provides high resolution output. Zero issue of pixilation when projected on wide screen. Hassle free inclusion and exclusion of company name, logo and trademark. Compatible with multiple software and formats. Marketers, strategists, business planners, students and teachers make vivid use of this slide design in their presentations.
-
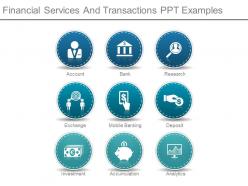 Financial services and transactions ppt examples
Presenting financial services and transactions ppt examples. This is a financial services and transactions ppt examples. This is a nine stage process. The stages in this process are account, bank, research, deposit, mobile banking, exchange, analytics, accumulation, investment.
-
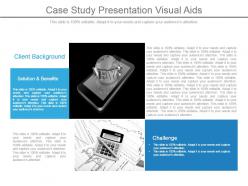 Case study presentation visual aids
Presenting case study presentation visual aids. This is a case study presentation visual aids. This is a two stage process. The stages in this process are we are client background, solution and benefits, challenge.
-
 Credit card icon images powerpoint presentation
Presenting Credit Card Icon Images PowerPoint Presentation. This PPT slide is professionally made and easily customizable. A mere click can easily edit the font style, font color, and font size. Access this presentation easily anywhere as it is compatible with Google Slides. Transform it in PDF or JPG formats. Add or delete content from the given slide as per your convenience. Present it in front of thousands of people in widescreen. It is also available in standard screen size.
-
 Revenue icon presentation background images
Presenting revenue icon presentation background images. This is a revenue icon presentation background images. This is a six stage process. The stages in this process are revenue icon, income icon, turnover icon, sales icon.
-
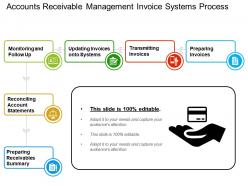 Accounts receivable management invoice systems process
Presenting accounts receivable management invoice systems process. This is a accounts receivable management invoice systems process. This is a six stage process. The stages in this process are accounts receivable management, payment claim, invoices.
-
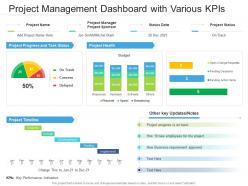 Project management dashboard snapshot with various kpis
Introducing our Project Management Dashboard Snapshot With Various KPIs set of slides. The topics discussed in these slides are Project Timeline, Project Progress, Project Health, Project Status, Analysis. This is an immediately available PowerPoint presentation that can be conveniently customized. Download it and convince your audience.
-
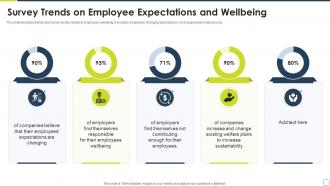 Survey Trends On Employee Expectations And Wellbeing
This slide illustrates trends and survey results related to employees wellbeing. It includes employees changing expectations, more responsible employers etc. Introducing our Survey Trends On Employee Expectations And Wellbeing set of slides. The topics discussed in these slides are Survey Trends On Employee Expectations And Wellbeing. This is an immediately available PowerPoint presentation that can be conveniently customized. Download it and convince your audience.
-
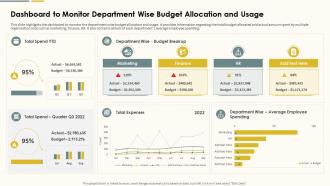 Dashboard To Monitor Department Wise Budget Action Plan For Marketing
This slide highlights the dashboard to monitor the department wise budget allocation and usage. It provides information regarding the total budget allocated and actual amount spent by multiple organization silos such as marketing, finance, HR. It also contains details of each departments average employee spending. Deliver an outstanding presentation on the topic using this Dashboard To Monitor Department Wise Budget Action Plan For Marketing. Dispense information and present a thorough explanation of Marketing, Finance, Department Wise using the slides given. This template can be altered and personalized to fit your needs. It is also available for immediate download. So grab it now.
-
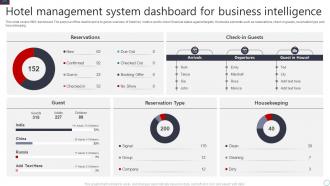 Hotel Management System Dashboard Snapshot For Business Intelligence
This slide covers HMS dashboard. The purpose of this dashboard is to get an overview of hotel key metrics and to check financial status against targets. It includes elements such as reservations, check in guests, reservation type and housekeeping. Presenting our well structured Hotel Management System Dashboard Snapshot For Business Intelligence. The topics discussed in this slide are Hotel Management, System Dashboard, Business Intelligence. This is an instantly available PowerPoint presentation that can be edited conveniently. Download it right away and captivate your audience.
-
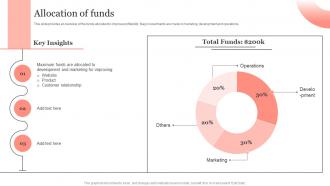 Allocation Of Funds Portable Printer Investor Fund Raising Pitch Deck
This slide provides an overview of the funds allocated to improve profitability. Major investments are made in marketing, development and operations. Present the topic in a bit more detail with this Allocation Of Funds Portable Printer Investor Fund Raising Pitch Deck. Use it as a tool for discussion and navigation on Operations, Marketing. This template is free to edit as deemed fit for your organization. Therefore download it now.
-
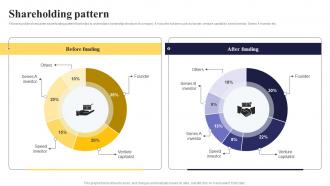 Shareholding Pattern Task Management Software Investment Pitch Deck
Following slide showcases shareholding pattern that helps to understand ownership structure of company. It includes holders such as funder, venture capitalist, seed investor, Series A investor etc. Deliver an outstanding presentation on the topic using this Shareholding Pattern Task Management Software Investment Pitch Deck. Dispense information and present a thorough explanation of Shareholding Pattern using the slides given. This template can be altered and personalized to fit your needs. It is also available for immediate download. So grab it now.
-
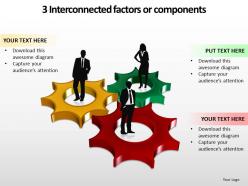 3 interconnected factors or components ppt slides templates infographics images 1121
This Animated PowerPoint Diagram shows Three Colorful Process Tables. This Diagram Signifies Three Different elements used in Business.
-
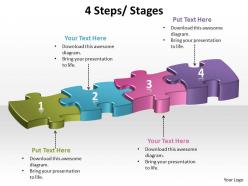 4 steps process stages powerpoint slides and ppt templates infographics images 1121
This PowerPoint Template consists of four interconnected colorful puzzles. It portrays the concept of inter-related issues in any Business activity.
-
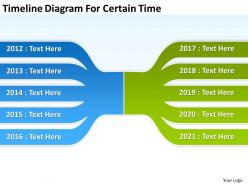 Small business network diagram timeline for certain powerpoint templates
No diversion of pixels when opened on big screen. Allowed grouping or ungrouping of the objects. Access to edit the color, style, themes and the orientation of the slide icons. Trouble-free insertion of trademark in the slides. Beneficial for the business managers, marketing individuals and the professional presenters.
-
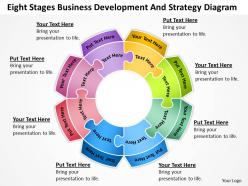 Business flow diagrams eight stages development and strategy powerpoint slides
We are proud to present our business flow diagrams eight stages development and strategy powerpoint slides. Develop competitive advantage with our above template which contains a diagram of eight stages circular jigsaw puzzles. Use this diagram for presentations on budget, business processes, stages of business processes, etc. Create captivating presentations to deliver comparative and weighted arguments.
-
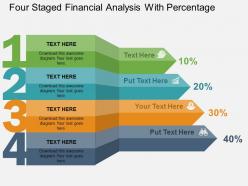 Four staged financial analysis with percentage flat powerpoint design
We are proud to present our four staged financial analysis with percentage flat powerpoint design. Four staged colored numeric banner graphic has been used to design this power point template diagram. This PPT diagram contains the concept of financial analysis and percentage representation. Use this PPT diagram for business and finance related presentations.
-
 Stock pitch for construction companies powerpoint presentation ppt slide template
Our Stock Pitch For Construction Companies Powerpoint Presentation Ppt Slide Template is the perfect way to pitch your stock. We have researched thousands of stock pitches and designed the most impactful way to convince your investors to invest in your equity.
-
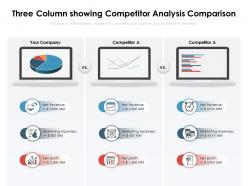 Three column showing competitor analysis comparison
Presenting this set of slides with name Three Column Showing Competitor Analysis Comparison. This is a three stage process. The stages in this process are Net Revenue, Marketing Expenses, Net Profit. This is a completely editable PowerPoint presentation and is available for immediate download. Download now and impress your audience.
-
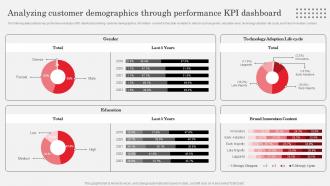 Analyzing Customer Demographics Through Performance KPI Dashboard
The following slide outlines key performance indicator KPI dashboard outlining customer demographics. Information covered in this slide is related to metrics such as gender, education level, technology adoption life cycle, and brand innovation consent. Deliver an outstanding presentation on the topic using this Analyzing Customer Demographics Through Performance KPI Dashboard. Dispense information and present a thorough explanation of Brand, Innovation, Technology using the slides given. This template can be altered and personalized to fit your needs. It is also available for immediate download. So grab it now.
-
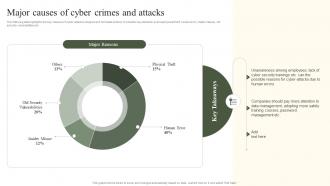 Major Causes Of Cyber Crimes And Attacks Implementing Cyber Risk Management Process
The following slide highlights the key reasons of cyber-attack to analyze and formulate actions. It includes key elements such asphysical theft, human error, insider misuse, old security vulnerabilities etc. Present the topic in a bit more detail with this Major Causes Of Cyber Crimes And Attacks Implementing Cyber Risk Management Process. Use it as a tool for discussion and navigation on Major Reasons. This template is free to edit as deemed fit for your organization. Therefore download it now.
-
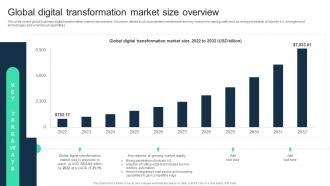 Global Digital Transformation Market Size Overview Adopting Digital Transformation DT SS
This slide covers global business digital transformation market size overview. It involves details such as projected market reach and key reasons for rapid growth such as rising penetration of industry 4.0, emergence of technologies and smart cloud capabilities. Present the topic in a bit more detail with this Global Digital Transformation Market Size Overview Adopting Digital Transformation DT SS Use it as a tool for discussion and navigation on Global Digital Transformation, Market Size This template is free to edit as deemed fit for your organization. Therefore download it now.
-
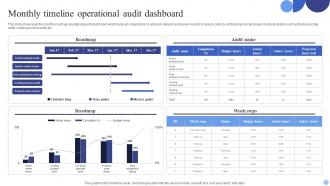 Monthly Timeline Operational Audit Dashboard
This slide showcases the monthly roadmap operational audit dashboard which helps an organization to enhance network and server security and reduce costs by addressing crucial issues. It include details such as foods example audit, costing process audit, etc. Presenting our well structured Monthly Timeline Operational Audit Dashboard. The topics discussed in this slide are Roadmap, Audit Name, Roadmap, Work Steps. This is an instantly available PowerPoint presentation that can be edited conveniently. Download it right away and captivate your audience.
-
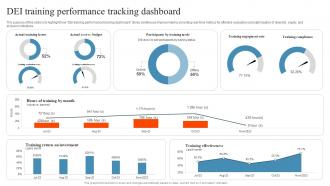 DEI Training Performance Tracking Dashboard
The purpose of this slide is to highlight how DEI training performance tracking dashboard drives continuous improvement by providing real time metrics for effective evaluation and optimization of diversity, equity, and inclusion initiatives. Presenting our well structured DEI Training Performance Tracking Dashboard. The topics discussed in this slide are Actual Training Hours, Actual Coot Vs Budget, Training Engagement Rate. This is an instantly available PowerPoint presentation that can be edited conveniently. Download it right away and captivate your audience.
-
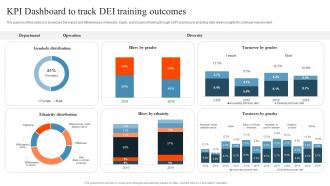 KPI Dashboard To Track DEI Training Outcomes
The purpose of this slide is to showcase the impact and effectiveness of diversity, equity, and inclusion training through a KPI Dashboard, enabling data driven insights for continual improvement. Introducing our KPI Dashboard To Track DEI Training Outcomes set of slides. The topics discussed in these slides are Turnover By Gender, Ethnicity Distribution, Turnover By Gender. This is an immediately available PowerPoint presentation that can be conveniently customized. Download it and convince your audience.
-
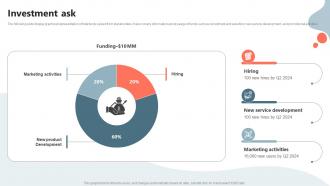 Investment Ask Shared Car Service Capital Raising Pitch Deck
The following slide display graphical representation of total funds raised from stakeholders. It also covers information about usage of funds such as recruitment and selection, new service development, and promotional activities. Present the topic in a bit more detail with this Investment Ask Shared Car Service Capital Raising Pitch Deck. Use it as a tool for discussion and navigation on Funding, Marketing Activities, Development. This template is free to edit as deemed fit for your organization. Therefore download it now.
-
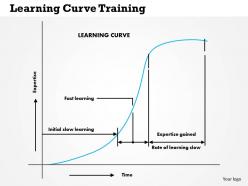 0514 learning curve training powerpoint presentation
We are proud to present our 0514 learning curve training powerpoint presentation. Learning Curve provides the very best in professional training services for large corporates as well as smaller organizations. This PPT Slide is an excellent tool to make attractive business presentation.
-
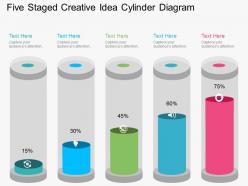 Fg five staged creative idea cylinder diagram flat powerpoint design
Presenting fg five staged creative idea cylinder diagram flat powerpoint design. Five staged cylinder diagram has been used to craft this power point template diagram. This PPT diagram contains the concept of creative business generation. Use this PPT diagram for business and marketing related presentations.
-
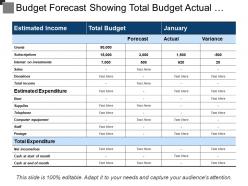 Budget forecast showing total budget actual and variance
Presenting this set of slides with name - Budget Forecast Showing Total Budget Actual And Variance. This is a three stage process. The stages in this process are Budget Forecast, Forecast Vs Actual Budget, Plan Vs Forecast.
-
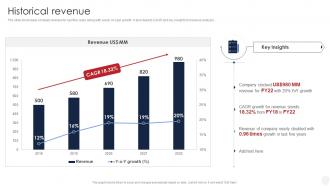 Historical Revenue Insurance Company Profile Ppt Powerpoint Presentation Gallery Slides
The slide showcases company revenue for last five years along with yearly on year growth. It also depicts CAGR and key insights for revenue analysis. Deliver an outstanding presentation on the topic using this Historical Revenue Insurance Company Profile Ppt Powerpoint Presentation Gallery Slides. Dispense information and present a thorough explanation of Revenue, Analysis, Growth using the slides given. This template can be altered and personalized to fit your needs. It is also available for immediate download. So grab it now.
-
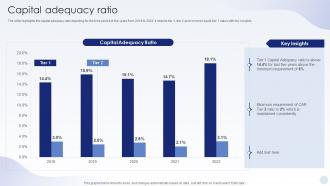 BFSI Company Profile Capital Adequacy Ratio Ppt Powerpoint Presentation Slides Master Slide
The slide highlights the capital adequacy ratio depicting for the time period of five years from 2018 to 2022. It depicts tier 1, tier 2 and common equity tier 1 ratios with key insights. Present the topic in a bit more detail with this BFSI Company Profile Capital Adequacy Ratio Ppt Powerpoint Presentation Slides Master Slide. Use it as a tool for discussion and navigation on Capital Adequacy Ratio. This template is free to edit as deemed fit for your organization. Therefore download it now.
-
 B2B Business Marketing Dashboard With Total Deals
This slide b2b business marketing and deal management dashboard. It provides information about spend per office, monthly recurring revenue MRR, revenue on ad spend ROAS, demos, deals, closed, won, etc. Introducing our B2B Business Marketing Dashboard With Total Deals set of slides. The topics discussed in these slides are B2B Business Marketing, Dashboard, Total Deals. This is an immediately available PowerPoint presentation that can be conveniently customized. Download it and convince your audience.
-
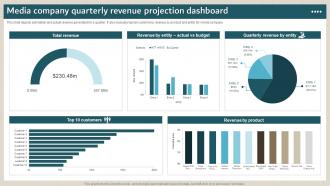 Media Company Quarterly Revenue Projection Dashboard
This slide depicts estimation and actual revenue generated for a quarter. It also includes top ten customers, revenue by product and entity for media company Presenting our well-structured Media Company Quarterly Revenue Projection Dashboard. The topics discussed in this slide are Media Company, Quarterly, Revenue Projection, Dashboard. This is an instantly available PowerPoint presentation that can be edited conveniently. Download it right away and captivate your audience.
-
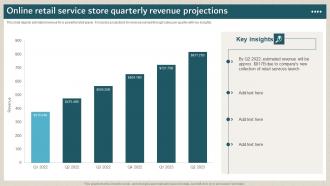 Online Retail Service Store Quarterly Revenue Projections
This slide depicts estimated revenue for a powerful retail player. It includes projections for revenue earned through sales per quarter with key insights. Introducing our Online Retail Service Store Quarterly Revenue Projections set of slides. The topics discussed in these slides are Online Retail Service, Store Quarterly, Revenue Projections. This is an immediately available PowerPoint presentation that can be conveniently customized. Download it and convince your audience.
-
 Financing Option For Funding Real Estate Flipping
This slide covers different methods to fund real estate flip. It includes multiple funding options such as cash payment, conventional financing, home equity loan and hard money lender. Introducing our premium set of slides with Financing Option For Funding Real Estate Flipping. Elucidate the four stages and present information using this PPT slide. This is a completely adaptable PowerPoint template design that can be used to interpret topics like Cash Payments, Conventional Financing, Home Equity Loans, Hard Money Lender. So download instantly and tailor it with your information.
-
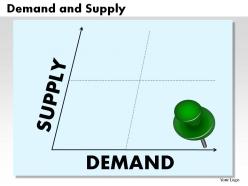 Demand and supply powerpoint presentation slides
These high quality, editable pre-designed powerpoint slides have been carefully created by our professional team to help you impress your audience. Each graphic in every slide is vector based and is 100% editable in powerpoint. Each and every property of any slide - color, size, shading etc can be modified to build an effective powerpoint presentation. Use these slides to convey complex business concepts in a simplified manner. Any text can be entered at any point in the powerpoint slide. Simply DOWNLOAD, TYPE and PRESENT!
-
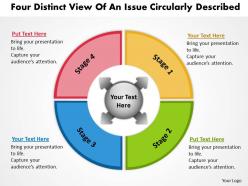 Four distinct view of an issue circularly described flow layout network powerpoint slides
We are proud to present our four distinct view of an issue circularly described flow layout network powerpoint slides. This flow chart uses circles to represent various functions, and shows the sequence and interconnection of functions with arrows. This type of chart is useful for showing circular relationships
-
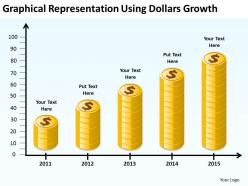 Graphical representation using dollars growth ppt powerpoint slides
We are proud to present our graphical representation using dollars growth ppt powerpoint slides. This PowerPoint slide is a graphical representation of increasing levels of business using dollars. Deliver amazing presentations to mesmerize your audience. You can easily edit the size, percentages, text, color.
-
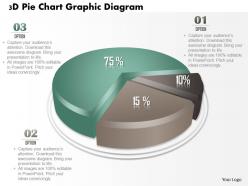 0714 business consulting 3d pie chart graphic diagram powerpoint slide template
We are proud to present our 0714 business consulting 3d pie chart graphic diagram powerpoint slide template. A 3d pie chart graphic is used to design this diagram. Display result analysis by using this 3d pie chart graphic diagram in your business presentation.
-
 0115 pie chart and magnifier for performance indication powerpoint template
Ideal for marketing professionals, business managers, entrepreneurs and big organizations. This presentation theme is totally attuned with Google slide. Easy conversion to other software’s like JPG and PDF formats. Image quality remain the unchanged even when resize the image. Change PowerPoint design’s font, text, color and design as per your manner. Easy to put in company logo, brand or name.
-
 Money investment icon ppt inspiration
Presenting money investment icon ppt inspiration. This is a money investment icon ppt inspiration. This is a one stage process. The stages in this process are investment, venture capital, funding, private equity.
-
 Insurance sales with different icons
Introducing Insurance Sales With Different Icons PPT template for insurers. The slide is fully editable and is compatible with Google Slides too. It can be saved in different file formats such as JPG, PNG, and PDF. The slide is easily available in both 4:3 and 16:9 aspect ratios. You can personalize the template as per your requirements.
-
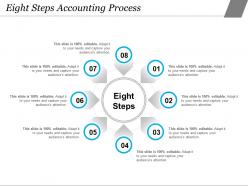 Eight steps accounting process
Presenting this set of slides with name - Eight Steps Accounting Process. This is a eight stage process. The stages in this process are Accounting Process, Accounting Cycle, Accounting Management.
-
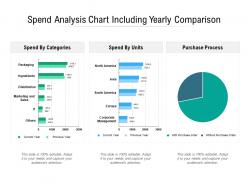 Spend analysis chart including yearly comparison
Presenting this set of slides with name Spend Analysis Chart Including Yearly Comparison. The topics discussed in these slides are Spend By Categories, Spend By Units, Purchase Process. This is a completely editable PowerPoint presentation and is available for immediate download. Download now and impress your audience.
-
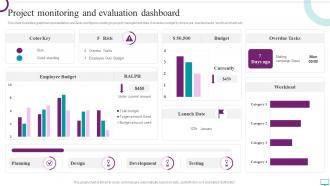 Project Monitoring And Evaluation Dashboard
This slide illustrates graphical representation and facts and figures relating to project management data. It includes budget by employee, overdue tasks, workload charts etc. Presenting our well structured Project Monitoring And Evaluation Dashboard. The topics discussed in this slide are Employee Budget, Development, Testing, Planning. This is an instantly available PowerPoint presentation that can be edited conveniently. Download it right away and captivate your audience.
-
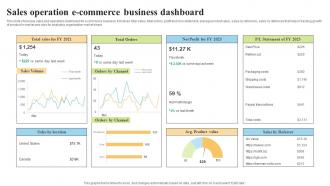 Sales Operation E Commerce Business Dashboard
This slide showcase sales and operations dashboard for e commerce business. It involves total sales, total orders, profit and loss statement, average product value, sales by reference, sales by reference that help in tracking growth of product in market and also for analyzing organization market share. Presenting our well structured Sales Operation E Commerce Business Dashboard. The topics discussed in this slide are Sales By Location, Product Value, Business Dashboard. This is an instantly available PowerPoint presentation that can be edited conveniently. Download it right away and captivate your audience.
-
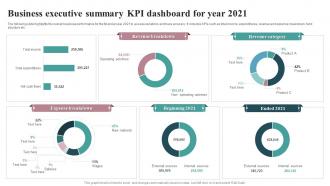 Business Executive Summary KPI Dashboard For Year 2021
The following slide highlights the overall business performance for the financial year 2021 to assess variations and trace accuracy. It includes KPIs such as total income, expenditures, revenue and expense breakdown, fund structure etc. Presenting our well structured Business Executive Summary KPI Dashboard For Year 2021. The topics discussed in this slide are Revenue Breakdown, Revenue Category, Expense Breakdown. This is an instantly available PowerPoint presentation that can be edited conveniently. Download it right away and captivate your audience.
-
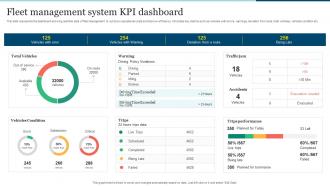 Fleet Management System KPI Dashboard
This slide represents the dashboard showing real time data of fleet management to cut down operational costs and improve efficiency. It includes key metrics such as vehicles with errors, warnings, deviation from route, total vehicles, vehicles condition etc. Introducing our Fleet Management System KPI Dashboard set of slides. The topics discussed in these slides are Total Vehicles, Vehicles Condition, Fleet Management System. This is an immediately available PowerPoint presentation that can be conveniently customized. Download it and convince your audience.
-
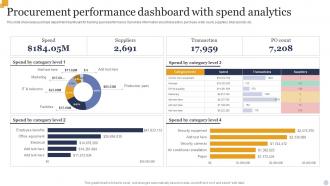 Procurement Performance Dashboard With Spend Analytics
This slide showcases purchase department dashboard for tracking spend performance. It provides information about transaction, purchase order count, suppliers, total spends, etc. Introducing our Procurement Performance Dashboard With Spend Analytics set of slides. The topics discussed in these slides are Procurement Performance Dashboard, Spend Analytics. This is an immediately available PowerPoint presentation that can be conveniently customized. Download it and convince your audience.
-
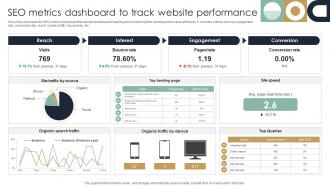 SEO Metrics Dashboard To Track Website Performance
This slide showcases the SEO metrics dashboard that assists businesses in tracking and monitoring their website performance effectively. It includes metrics such as engagement rate, conversion rate, reach, organic traffic, top queries, etc. Introducing our SEO Metrics Dashboard To Track Website Performance set of slides. The topics discussed in these slides are Track, Performance, Website. This is an immediately available PowerPoint presentation that can be conveniently customized. Download it and convince your audience.
-
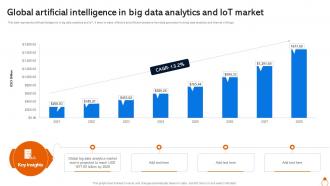 Global Artificial Intelligence In Big Data Analytics And IOT Market
This slide represents artificial intelligence in big data analytics and IoT. It aims to make effective and efficient decisions from data generated from big data analytics and internet of things. Introducing our Global Artificial Intelligence In Big Data Analytics And IOT Market set of slides. The topics discussed in these slides are Global Artificial Intelligence, Big Data Analytics This is an immediately available PowerPoint presentation that can be conveniently customized. Download it and convince your audience.
-
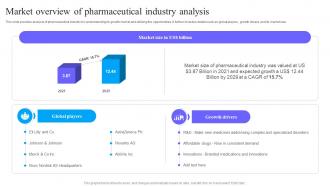 Market Overview Of Pharmaceutical Industry Analysis
This slide provides analysis of pharmaceutical industry for understanding its growth market and utilizing the opportunities. It further includes details such as global players , growth drivers and its market size. Presenting our well structured Market Overview Of Pharmaceutical Industry Analysis The topics discussed in this slide are Market Size, Growth Drivers, Global Players This is an instantly available PowerPoint presentation that can be edited conveniently. Download it right away and captivate your audience.


