Finance PowerPoint Templates, Presentation Slide Diagrams & PPT Graphics
- Sub Categories
-
- 30 60 90 Day Plan
- Advertising
- Agile Development
- Aims and Objectives
- Arrows
- Before and After
- Blockchain Bitcoin
- Boxes
- Business
- Calender
- Case Study
- Celebrations
- Certificates
- Challenges Opportunities
- Channel Distribution
- Children
- Communication
- Competitive Landscape
- Computer
- Concepts
- Construction Management
- Corporate
- Crowdfunding
- Current State Future State
- Custom PowerPoint Diagrams
- Digital Transformation
- Dos and Donts
- Economics
- Education
- Environment
- Events
- Festival
- Finance
- Financials
- Food
- Game
- Gap Analysis
- Generic
- Geographical
- Health
- Heatmaps
- Holidays
- Icons
- Input Process Output
- Internet
- Key Messages
- Key Wins
- Ladder
- Leadership
- Lists
- Lucky Draw
- Management
- Marketing
- Measuring
- Medical
- Music
- News
- Next Steps
- People Process Technology
- Pillars
- Planning
- Post-it-Notes
- Problem Statement
- Process
- Proposal Management
- Pros and Cons
- Puzzle
- Puzzles
- Recruitment Strategy
- Religion
- Research and Development
- Risk Mitigation Strategies
- Roadmap
- Selling
- Shapes
- Short Term Long Term
- Social
- Stairs
- Start Stop Continue
- Strategy
- Symbol
- Technology
- Thesis Defense Dissertation
- Timelines
- Traffic
- Transition Plan
- Transportation
- Vehicles
- Venture Capital Funding
- Warning
- Winners
- Word Cloud
-
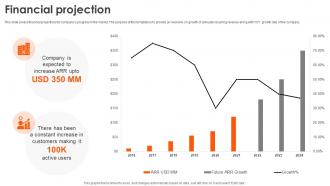 Financial Projection Zapier Investor Funding Elevator Pitch Deck
This slide covers financial projections for company progress in the market. The purpose of this template is to provide an overview on growth of annually recurring revenue along with YOY growth rate of the company. Deliver an outstanding presentation on the topic using this Financial Projection Zapier Investor Funding Elevator Pitch Deck. Dispense information and present a thorough explanation of Financial Projection, Annually Recurring Revenue, Growth Rate using the slides given. This template can be altered and personalized to fit your needs. It is also available for immediate download. So grab it now.
-
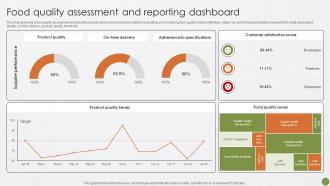 Food Quality Assessment And Reporting Food Quality Best Practices For Food Quality And Safety Management
This slide presents a food quality assessment and reporting dashboard to present real-time data for evaluating and monitoring food quality metrics effectively. Major key performance indicators covered in the slide are product, quality, on time, delivery, product, quality, trends etc. Present the topic in a bit more detail with this Food Quality Assessment And Reporting Food Quality Best Practices For Food Quality And Safety Management. Use it as a tool for discussion and navigation on Product Quality Trends, Customer Satisfaction Score, Food Quality Issues. This template is free to edit as deemed fit for your organization. Therefore download it now.
-
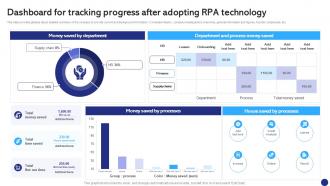 Dashboard For Tracking Progress After Robotics Process Automation To Digitize Repetitive Tasks RB SS
This slide provides glimpse about detailed summary of the company to provide current and background information. It includes mission, company headquarters, branches, general information and figures, founder, employees, etc. Present the topic in a bit more detail with this Dashboard For Tracking Progress After Robotics Process Automation To Digitize Repetitive Tasks RB SS. Use it as a tool for discussion and navigation on Department And Process, Money Saved, House Saved. This template is free to edit as deemed fit for your organization. Therefore download it now.
-
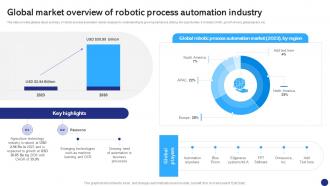 Global Market Overview Of Robotic Robotics Process Automation To Digitize Repetitive Tasks RB SS
This slide provides glimpse about summary of robotic process automation market analysis for understanding its growing market and utilizing the opportunities. It includes CAGR, growth drivers, global players, etc. Present the topic in a bit more detail with this Global Market Overview Of Robotic Robotics Process Automation To Digitize Repetitive Tasks RB SS. Use it as a tool for discussion and navigation on Agriculture Technology, Emerging Technologies, Business Processes. This template is free to edit as deemed fit for your organization. Therefore download it now.
-
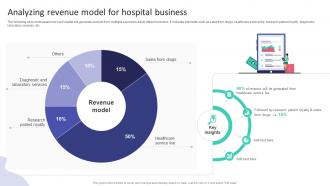 Analyzing Revenue Model For Hospital Business Hospital Startup Business Plan Revolutionizing
The following slide showcases how our hospital will generate revenue from multiple sources to easily attract investors. It includes elements such as sales from drugs, healthcare service fee, research patient royalty, diagnostic, laboratory services, etc. Deliver an outstanding presentation on the topic using this Analyzing Revenue Model For Hospital Business Hospital Startup Business Plan Revolutionizing. Dispense information and present a thorough explanation of Research Patient Royalty, Healthcare Service Fee, Sales From Drugs using the slides given. This template can be altered and personalized to fit your needs. It is also available for immediate download. So grab it now.
-
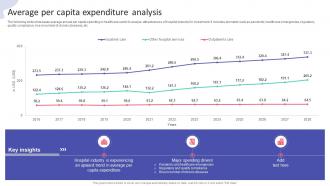 Average Per Capita Expenditure Analysis Hospital Startup Business Plan Revolutionizing
The following slide showcases average annual per capita spending in healthcare sector to analyze attractiveness of hospital industry for investment. It includes elements such as pandemic, healthcare emergencies, regulatory, quality compliance, rise in number of chronic diseases, etc. Present the topic in a bit more detail with this Average Per Capita Expenditure Analysis Hospital Startup Business Plan Revolutionizing. Use it as a tool for discussion and navigation on Average Per Capita, Expenditure Analysis. This template is free to edit as deemed fit for your organization. Therefore download it now.
-
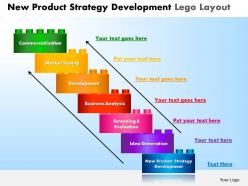 New product strategy development lego layout powerpoint slides and ppt templates db
These high quality, editable pre-designed powerpoint slides and powerpoint templates have been carefully created by our professional team to help you impress your audience. Each graphic in every powerpoint slide is vector based and is 100% editable in powerpoint.Each and every property of any slide - color, size, shading etc can be modified to build an effective powerpoint presentation. Use these slides to convey complex business concepts in a simplified manner. Any text can be entered at any point in the powerpoint slide. Simply DOWNLOAD, TYPE and PRESENT
-
 Business powerpoint templates annular illustration of 3 stages using arrow sales ppt slides
This Annular Illustration assist you in creating your project roadmap with different ways, interim goals and project steps.
-
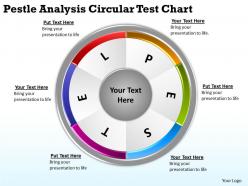 Pestle analysis circular test chart ppt powerpoint slides
Pre designed PESTLE analysis circular info graphic. Thoroughly editable content. Inclusion and exclusion of data as per individual knowledge and knowhow. High resolution PPT background with clarity for widescreen view. Useful content for business analyst, strategist, entrepreneurs, professors and students.
-
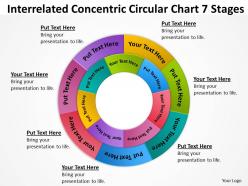 Business process flowchart concentric circular multicolored 7 stages powerpoint slides
We are proud to present our business process flowchart concentric circular multicolored 7 stages powerpoint slides. This PowerPoint Diagram contains concentric circles that represent the levels of impact. This diagram can be used to show your agenda in the increasing order of impact. Present your views using our innovative slides and be assured of leaving a lasting impression.
-
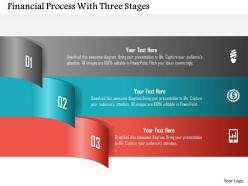 Financial process with three stages powerpoint templates
We are proud to present our financial process with three stages powerpoint templates. Three colorful tags has been used to craft this power point template. This PPT diagram contains the concept of financial process flow. This PPT diagram can be used for the process flow related topics in any financial presentation.
-
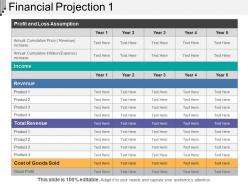 Financial projection 1 presentation outline
Presenting Financial Projection 1 Presentation Outline. This slide can be altered as per the requirement. It is easily available in both standard and widescreen. You can customize the color, font, font size and font types of the slide. Can be converted into various formats like JPG, PDF and PNG. This template is easily adaptable to Google Slides.
-
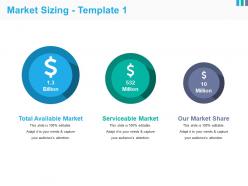 Market sizing powerpoint slide
Presenting this set of slides with name - Market Sizing Powerpoint Slide. This is a three stage process. The stages in this process are Total Available Market, Serviceable Market, Our Market Share.
-
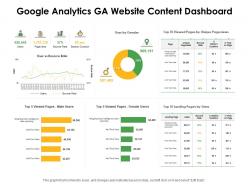 Google analytics ga website content dashboard snapshot ppt powerpoint presentation icon templates
Presenting this set of slides with name Google Analytics GA Website Content Dashboard Snapshot Ppt Powerpoint Presentation Icon Templates. The topics discussed in these slides are Session Duration, Business Intelligence, Data Reporting. This is a completely editable PowerPoint presentation and is available for immediate download. Download now and impress your audience.
-
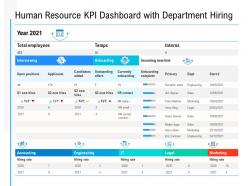 Human resource kpi dashboard with department hiring
Introducing our Human Resource KPI Dashboard With Department Hiring set of slides. The topics discussed in these slides are Marketing, Onboarding, Employees. This is an immediately available PowerPoint presentation that can be conveniently customized. Download it and convince your audience.
-
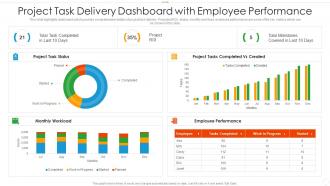 Project task delivery dashboard snapshot with employee performance
This slide highlights dashboard which provides comprehensive details of project task delivery. Projected ROI, status, monthly workload, employee performance are some of the key metrics which can be shown in this slide.Introducing our Project Task Delivery Dashboard Snapshot With Employee Performance set of slides. The topics discussed in these slides are Project Task Delivery Dashboard With Employee Performance. This is an immediately available PowerPoint presentation that can be conveniently customized. Download it and convince your audience.
-
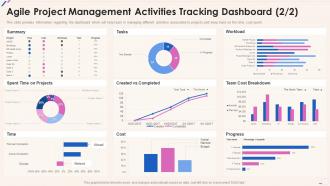 Agile Playbook Agile Project Management Activities Tracking Dashboard
This slide provides information regarding the dashboard which will help team in managing different activities associated to projects and keep track on the time, cost spent. Present the topic in a bit more detail with this Agile Playbook Agile Project Management Activities Tracking Dashboard. Use it as a tool for discussion and navigation on Workload, Spent Time On Projects, Progress, Cost, Time, Created Vs Completed. This template is free to edit as deemed fit for your organization. Therefore download it now.
-
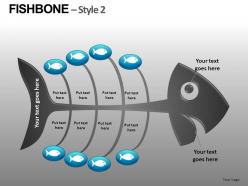 Fishbone style 2 powerpoint presentation slides db
Each graphic in very Fishbone PowerPoint slide background is vector based. 100% editable. Each and every property of any slide - color, size, shading etc can be modified to build an effective PowerPoint presentation. Use these slides to convey complex business concepts in a simplified manner. Any text can be entered at any point in the PowerPoint slide. Impressive high resolution visuals. Compatible with multiple format options and software options. Used by business analysts, strategists, managerial team and MBA students.
-
 Accounts receivable management icons
Presenting accounts receivable management icons. This is a accounts receivable management icons. This is a three stage process. The stages in this process are accounts receivable management, payment claim, invoices.
-
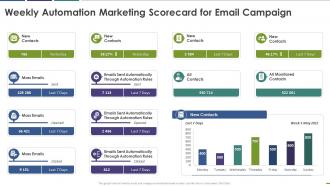 Weekly automation marketing scorecard for email campaign
This graph or chart is linked to excel, and changes automatically based on data. Just left click on it and select Edit Data. Deliver an outstanding presentation on the topic using this Weekly Automation Marketing Scorecard For Email Campaign. Dispense information and present a thorough explanation of Mass Emails, New Contacts, Automation Rules, Mass Emails using the slides given. This template can be altered and personalized to fit your needs. It is also available for immediate download. So grab it now.
-
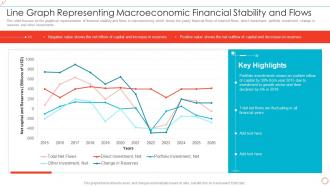 Line Graph Representing Macroeconomic Financial Stability And Flows
This slide focuses on the graphical representation of financial stability and flows in macroeconomy which shows the yearly financial flows of total net flows, direct investment, portfolio investment, change in reserves and other investments. Introducing our Line Graph Representing Macroeconomic Financial Stability And Flows set of slides. The topics discussed in these slides are Total Net Flows, Direct Investment, Net, Portfolio Investment, Net, 2015 To 2025. This is an immediately available PowerPoint presentation that can be conveniently customized. Download it and convince your audience.
-
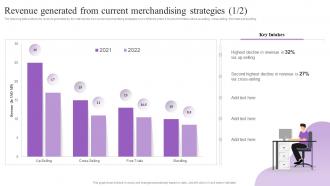 Revenue Generated From Current Merchandising Strategies Increasing Brand Loyalty
The following slide outlines the revenue generated by the retail stores from current merchandising strategies in two different years. It covers information about up selling, cross selling, free trials and bundling. Deliver an outstanding presentation on the topic using this Revenue Generated From Current Merchandising Strategies Increasing Brand Loyalty. Dispense information and present a thorough explanation of Revenue Generated, Current Merchandising, Strategies using the slides given. This template can be altered and personalized to fit your needs. It is also available for immediate download. So grab it now.
-
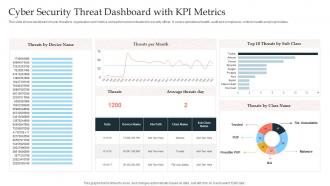 Cyber Security Threat Dashboard With KPI Metrics
This slide shows dashboard of cyber threats to organization and metrics and performance indicators for security officer. It covers operational health, audit and compliance, controls health and project status. Introducing our Cyber Security Threat Dashboard With KPI Metrics set of slides. The topics discussed in these slides are Cyber Security Threat, Dashboard, KPI Metrics. This is an immediately available PowerPoint presentation that can be conveniently customized. Download it and convince your audience.
-
 Emergent Strategy KPI Dashboard For Construction Industry
Following slide show casing the various construction business emergent strategy KPI which assist in increased capacity for change adaptation and the ability to act rapidly on new possibilities to gain an advantage. Introducing our Emergent Strategy KPI Dashboard For Construction Industry set of slides. The topics discussed in these slides are Emergent Strategy, KPI Dashboard, Construction Industry. This is an immediately available PowerPoint presentation that can be conveniently customized. Download it and convince your audience.
-
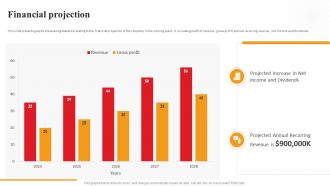 Financial Projection Arcus Investor Funding Elevator Pitch Deck
This slide presents graphs showcasing statistics relating to the financial projection of the company in the coming years. It includes growth of revenue, gross profit, annual recurring revenue, net income and dividends. Present the topic in a bit more detail with this Financial Projection Arcus Investor Funding Elevator Pitch Deck. Use it as a tool for discussion and navigation on Financial Projection, Growth Of Revenue, Gross Profit, Annual Recurring Revenue. This template is free to edit as deemed fit for your organization. Therefore download it now.
-
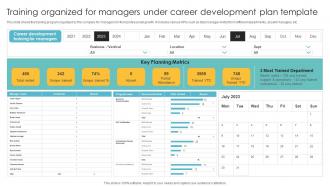 Training Organized For Managers Under Career Development Plan Template
This slide shows the training program organized by the company for managers for their professional growth. It includes various KPIs such as total manager invited from different departments, absent managers, etc. Introducing our Training Organized For Managers Under Career Development Plan Template set of slides. The topics discussed in these slides are Key Planning Metrics, Most Trained Department, Training For Managers. This is an immediately available PowerPoint presentation that can be conveniently customized. Download it and convince your audience.
-
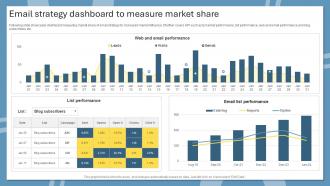 Email Strategy Dashboard To Measure Market Share
Following slide showcases dashboard measuring market share of email strategy for increased market influence. It further covers KPI such as Email list performance, list performance, web and email performance and blog subscribers, etc. Introducing our Email Strategy Dashboard To Measure Market Share set of slides. The topics discussed in these slides are People, Content, Strategies. This is an immediately available PowerPoint presentation that can be conveniently customized. Download it and convince your audience.
-
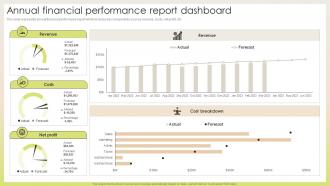 Annual Financial Performance Report Dashboard
This slide represents annual financial performance report which includes key components such as revenue, costs, net profit, etc Introducing our Annual Financial Performance Report Dashboard set of slides. The topics discussed in these slides are Revenue, Costs, Net Profit. This is an immediately available PowerPoint presentation that can be conveniently customized. Download it and convince your audience.
-
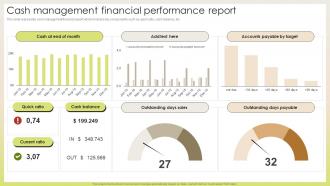 Cash Management Financial Performance Report
This slide represents cash management financial report which includes key components such as quick ratio, cash balance, etc Introducing our Cash Management Financial Performance Report set of slides. The topics discussed in these slides are Cash At End Of Month, Outstanding Days Payable. This is an immediately available PowerPoint presentation that can be conveniently customized. Download it and convince your audience.
-
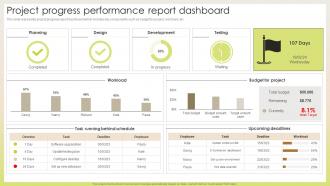 Project Progress Performance Report Dashboard
This slide represents project progress report dashboard which includes key components such as budget for project, workload, etc Presenting our well structured Project Progress Performance Report Dashboard. The topics discussed in this slide are Planning, Design, Development. This is an instantly available PowerPoint presentation that can be edited conveniently. Download it right away and captivate your audience.
-
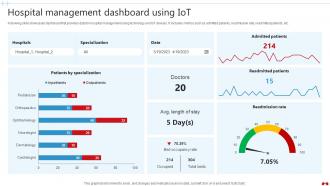 Hospital Management Dashboard Using Transforming Healthcare Industry Through Technology IoT SS V
Following slide showcases dashboard that provides data for hospital management using technology and IoT devices. It includes metrics such as admitted patients, readmission rate, readmitted patients, etc. Present the topic in a bit more detail with this Hospital Management Dashboard Using Transforming Healthcare Industry Through Technology IoT SS V. Use it as a tool for discussion and navigation on Admitted Patients, Readmitted Patients, Readmission Rate. This template is free to edit as deemed fit for your organization. Therefore download it now.
-
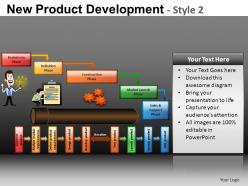 New product development 2 powerpoint presentation slides db
These high quality, editable pre-designed powerpoint slides and powerpoint templates have been carefully created by our professional team to help you impress your audience. Each graphic in every powerpoint slide is vector based and is 100% editable in powerpoint. Each and every property of any slide - color, size, shading etc can be modified to build an effective powerpoint presentation. Use these slides to convey complex business concepts in a simplified manner. Any text can be entered at any point in the powerpoint slide. Simply DOWNLOAD, TYPE and PRESENT!
-
 Business powerpoint templates animated smiley faces with different emotion sales ppt slides
Use this Animated 3D PowerPoint Diagram to express affection, affinity, agreement, association, attachment, attraction, closeness, coalition, comity, company, consideration, devotion, empathy, esteem, familiarity, favor, friendliness, fusion, good will, harmony, intimacy, league, love, pact, sociability, solidarity, and understanding.
-
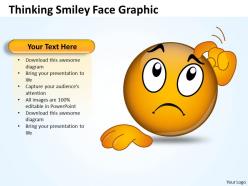 Business powerpoint templates thinking smiley face graphic sales ppt slides
This PowerPoint Diagram shows you the Designs of Confused emoticons expressing their Situation. This Diagram signifies the concept of thinking, frustration, fuddle, mess up, mislead, mortify, muddle, mystify, obscure, perplex, perturb, puzzle, shame, stir up, trouble, unhinge, unsettle, upset, and worry.
-
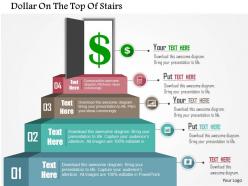 0115 dollar on the top of stairs powerpoint template
Simple steps for an instant download. Project on wide screen without worrying about PPT images getting pixelated. Insert your brand name, logo, tagline etc. No constraint on length of text in titles and subtitles. Fully modifiable size and orientation of PPT infographics. Runs effortlessly with other software and easily convertible to PDF or JPG formats.
-
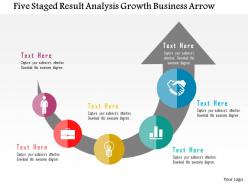 Five staged result analysis growth business arrow flat powerpoint design
We are proud to present our five staged result analysis growth business arrow flat powerpoint design. Five staged arrow info graphics has been used to craft this power point template diagram. This PPT diagram contains the concept of result analysis and growth. Use this PPT diagram for management and business related presentation.
-
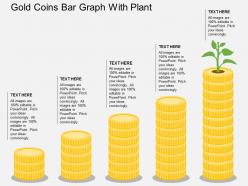 Gold coins bar graph with plant flat powerpoint design
We are proud to present our gold coins bar graph with plant flat powerpoint design. Graphic of gold coins and bar graph with plant has been used to craft this power point template diagram. This PPT diagram contains the concept of result analysis. Use this PPT diagram for business and marketing target related presentations.
-
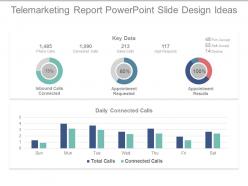 Telemarketing report powerpoint slide design ideas
Presenting telemarketing report powerpoint slide design ideas. This is a telemarketing report powerpoint slide design ideas. This is a three stage process. The stages in this process are phone calls, connected calls, sales calls, appt requests, phone calls, connected calls, sales calls, appt requests, inbound calls, connected, appointment requested, appointment results, daily connected calls.
-
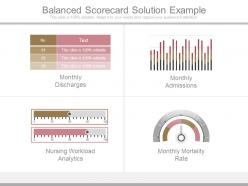 Balanced scorecard solution example
Presenting balanced scorecard solution example. This is a balanced scorecard solution example. This is a four stage process. The stages in this process are monthly discharges, monthly admissions, nursing workload analytics, monthly mortality rate.
-
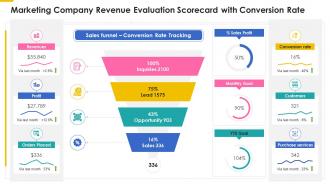 Marketing company revenue evaluation scorecard conversion rate ppt slides ideas
Present the topic in a bit more detail with this Marketing Company Revenue Evaluation Scorecard Conversion Rate Ppt Slides Ideas. Use it as a tool for discussion and navigation on Sales Funnel, Conversion Rate Tracking, Profit, Revenues, Orders Placed. This template is free to edit as deemed fit for your organization. Therefore download it now.
-
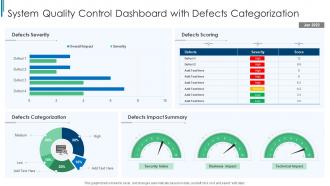 System Quality Control Dashboard Snapshot With Defects Categorization
This graph or chart is linked to excel, and changes automatically based on data. Just left click on it and select edit data. Presenting our well structured System Quality Control Dashboard Snapshot With Defects Categorization. The topics discussed in this slide are Defects Severity, Defects Scoring, Defects Impact Summary, Defects Categorization. This is an instantly available PowerPoint presentation that can be edited conveniently. Download it right away and captivate your audience.
-
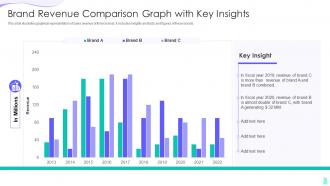 Brand Revenue Comparison Graph With Key Insights
This slide illustrates graphical representation of sales revenue of three brands. It includes insights and facts and figures of these brands. Present the topic in a bit more detail with this Brand Revenue Comparison Graph With Key Insights. Use it as a tool for discussion and navigation on Brand Revenue Comparison Graph With Key Insights. This template is free to edit as deemed fit for your organization. Therefore download it now.
-
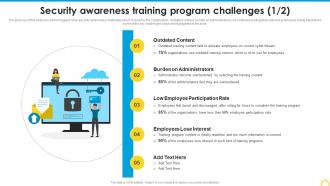 Security Awareness Training Program Challenges Building A Security Awareness Program
The purpose of this slide is to exhibit biggest cyber security awareness challenges which is faced by the organization. Outdated content, burden on administrators, low employee participation rate and employees losing interest are some of the key challenges which are highlighted in the slide. Present the topic in a bit more detail with this Security Awareness Training Program Challenges Building A Security Awareness Program. Use it as a tool for discussion and navigation on Outdated Content, Burden Administrators, Employee Participation Rate. This template is free to edit as deemed fit for your organization. Therefore download it now.
-
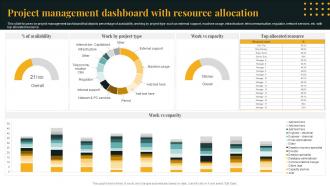 Project Management Dashboard With Resource Allocation
This slide focuses on project management dashboard that depicts percentage of availability, working by project type such as external support, machine usage, infrastructure, telecommunication, regulator, network services, etc. with top allocated resource. Introducing our Project Management Dashboard With Resource Allocation set of slides. The topics discussed in these slides are Work Vs Capacity, Work By Project Type, Top Allocated Resource This is an immediately available PowerPoint presentation that can be conveniently customized. Download it and convince your audience.
-
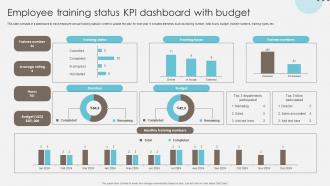 Employee Training Status KPI Dashboard With Budget
This slide consists of a dashboard to track employee annual training status in order to update the plan for next year. It includes elements such as training number, total hours, budget, trainee numbers, training types, etc. Presenting our well structured Employee Training Status KPI Dashboard With Budget. The topics discussed in this slide are Training Status, Budget, Employee Training. This is an instantly available PowerPoint presentation that can be edited conveniently. Download it right away and captivate your audience.
-
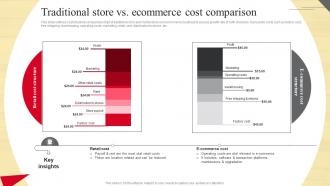 Traditional Store Vs Ecommerce Strategic Guide To Move Brick And Mortar Strategy SS V
This slide outlines cost structure comparison chart of traditional brick and mortar store and ecommerce business to assess growth rate of both channels. It presents costs such as factory cost, free shipping, warehousing, operating costs, marketing, retail, rent, distribution to stores, etc. Present the topic in a bit more detail with this Traditional Store Vs Ecommerce Strategic Guide To Move Brick And Mortar Strategy SS V. Use it as a tool for discussion and navigation on Traditional, Ecommerce, Cost. This template is free to edit as deemed fit for your organization. Therefore download it now.
-
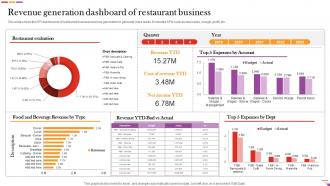 Revenue Generation Dashboard Of Restaurant Business Digital And Offline Restaurant
This slide shows the KPI dashboards of restaurant business revenue generation to generate more leads. It includes KPIs such as total sales, margin ,profit, etc. Present the topic in a bit more detail with this Revenue Generation Dashboard Of Restaurant Business Digital And Offline Restaurant Use it as a tool for discussion and navigation on Restaurant Evaluation, Revenue, Restaurant Business This template is free to edit as deemed fit for your organization. Therefore download it now.
-
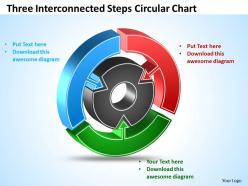 Three interconnected steps circular chart powerpoint templates ppt presentation slides 812
This Chart is a simple template that provides a graphical, time-phased overview of a continuing sequence of stages in a circular flow
-
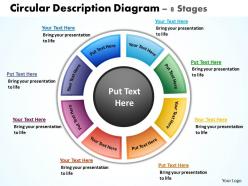 Circular description diagram 8 stages powerpoint diagrams presentation slides graphics 0912
A wonderful graphics to display time-phased overview of a continuing sequence of stages, tasks, or events in a circular flow
-
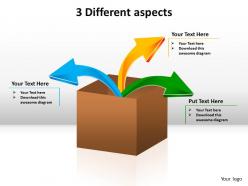 3 different aspects powerpoint slides templates infographics images 1121
This PowerPoint Diagram shows Three Colorful Arrows Coming Out of the Box in different Directions. This Diagram Signifies Three Different Aspects of life, Business, Sports, Family etc.
-
 Three level benefit and cost diagram flat powerpoint design
We are proud to present our three level benefit and cost diagram flat powerpoint design. Graphic of three level benefit and cost has been used to craft this power point template. This PPT diagram contains the concept of profit calculation. Use this diagram for finance and business presentations.
-
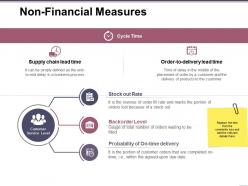 Nonfinancial measures ppt ideas
Presenting Nonfinancial Measures PPT Ideas PowerPoint slide. This PPT layout is Google Slides compatible. You can download this PowerPoint theme in various formats like PDF, JPG and PNG. As this PPT slide is customizable, you can modify the color, font size, font type, and shapes. This PowerPoint template is available in both 4:3 and 16:9 aspect ratios.
-
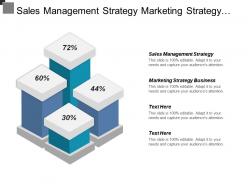 Sales management strategy marketing strategy for business brand awareness cpb
Presenting this set of slides with name - Sales Management Strategy Marketing Strategy For Business Brand Awareness Cpb. This is an editable four stages graphic that deals with topics like Sales Management Strategy, Marketing Strategy For Business, Brand Awareness to help convey your message better graphically. This product is a premium product available for immediate download and is 100 percent editable in Powerpoint. Download this now and use it in your presentations to impress your audience.
-
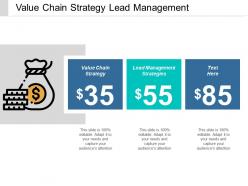 Value chain strategy lead management strategies collaborative strategy cpb
This is an editable three stages graphic that deals with topics like Value Chain Strategy, Lead Management Strategies, Collaborative Strategy to help convey your message better graphically. This product is a premium product available for immediate download, and is 100 percent editable in Powerpoint. Download this now and use it in your presentations to impress your audience.
-
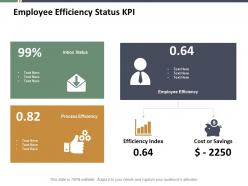 Employee efficiency status kpi ppt summary infographics
Presenting this set of slides with name - Employee Efficiency Status Kpi Ppt Summary Infographics. This is a four stage process. The stages in this process are Business, Management, Marketing.
-
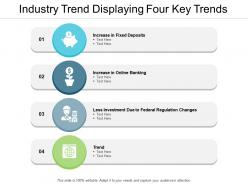 Industry trend displaying four key trends
Presenting this set of slides with name Industry Trend Displaying Four Key Trends. This is a four stage process. The stages in this process are Industry Trends, Online Banking, Centralized Network. This is a completely editable PowerPoint presentation and is available for immediate download. Download now and impress your audience.
-
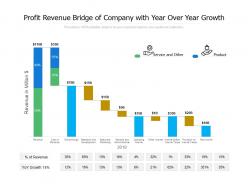 Profit revenue bridge of company with year over year growth
Presenting this set of slides with name Profit Revenue Bridge Of Company With Year Over Year Growth. The topics discussed in these slides are Revenue, Cost Of Revenue, Gross Margin, Research And Development, Sales And Marketing, General And Administrative, Operating Income. This is a completely editable PowerPoint presentation and is available for immediate download. Download now and impress your audience.
-
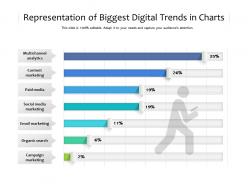 Representation of biggest digital trends in charts
Presenting this set of slides with name Representation Of Biggest Digital Trends In Charts. The topics discussed in these slides are Multichannel Analytics, Content Marketing, Email Marketing, Paid Media, Social Media Marketing, Campaign Marketing. This is a completely editable PowerPoint presentation and is available for immediate download. Download now and impress your audience.
-
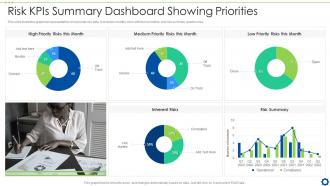 Risk KPIs Summary Dashboard Snapshot Showing Priorities
This slide illustrates graphical representation of corporate risk data. It includes monthly risks with their priorities, and risk summary quarter wise. Introducing our Risk KPIs Summary Dashboard Snapshot Showing Priorities set of slides. The topics discussed in these slides are High Priority Risks this Month, Medium Priority Risks this Month, Low Priority Risks this Month . This is an immediately available PowerPoint presentation that can be conveniently customized. Download it and convince your audience.
-
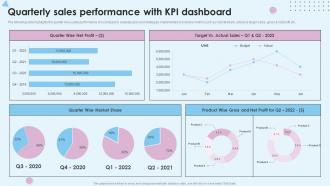 Quarterly Sales Performance With KPI Dashboard
The following slide highlights the quarter wise sales performance of a company to evaluate plan and strategies implemented. It includes metrics such as market share, actual vs target sales, gross and net profit etc. Introducing our Quarterly Sales Performance With KPI Dashboard set of slides. The topics discussed in these slides are Quarterly Sales Performance, KPI Dashboard. This is an immediately available PowerPoint presentation that can be conveniently customized. Download it and convince your audience.


