Finance PowerPoint Templates, Presentation Slide Diagrams & PPT Graphics
- Sub Categories
-
- 30 60 90 Day Plan
- Advertising
- Agile Development
- Aims and Objectives
- Arrows
- Before and After
- Blockchain Bitcoin
- Boxes
- Business
- Calender
- Case Study
- Celebrations
- Certificates
- Challenges Opportunities
- Channel Distribution
- Children
- Communication
- Competitive Landscape
- Computer
- Concepts
- Construction Management
- Corporate
- Crowdfunding
- Current State Future State
- Custom PowerPoint Diagrams
- Digital Transformation
- Dos and Donts
- Economics
- Education
- Environment
- Events
- Festival
- Finance
- Financials
- Food
- Game
- Gap Analysis
- Generic
- Geographical
- Health
- Heatmaps
- Holidays
- Icons
- Input Process Output
- Internet
- Key Messages
- Key Wins
- Ladder
- Leadership
- Lists
- Lucky Draw
- Management
- Marketing
- Measuring
- Medical
- Music
- News
- Next Steps
- People Process Technology
- Pillars
- Planning
- Post-it-Notes
- Problem Statement
- Process
- Proposal Management
- Pros and Cons
- Puzzle
- Puzzles
- Recruitment Strategy
- Religion
- Research and Development
- Risk Mitigation Strategies
- Roadmap
- Selling
- Shapes
- Short Term Long Term
- Social
- Stairs
- Start Stop Continue
- Strategy
- Symbol
- Technology
- Thesis Defense Dissertation
- Timelines
- Traffic
- Transition Plan
- Transportation
- Vehicles
- Venture Capital Funding
- Warning
- Winners
- Word Cloud
-
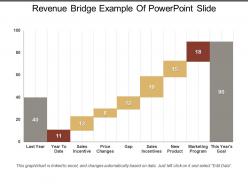 Revenue bridge example of powerpoint slide
Presenting this set of slides with name - Revenue Bridge Example Of Powerpoint Slide. This is a seven stage process. The stages in this process are Revenue Bridge, Income Bridge, Earnings Bridge.
-
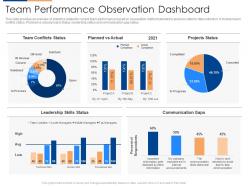 Team performance observation dashboard snapshot organizational team building program
This slide provides an overview of statistics related to current team performance based on observation method selected in previous slide for data collection. It involves team conflict status, Planned vs actual project status, leadership status and communication gap status. Present the topic in a bit more detail with this Team Performance Observation Dashboard snapshot Organizational Team Building Program. Use it as a tool for discussion and navigation on Team Performance Observation Dashboard. This template is free to edit as deemed fit for your organization. Therefore download it now.
-
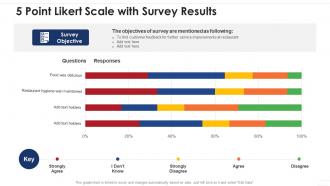 5 point likert scale with survey results key
Presenting our well structured 5 Point Likert Scale With Survey Results Key. The topics discussed in this slide are Service Improvements, Customer Feedback, Survey Objective. This is an instantly available PowerPoint presentation that can be edited conveniently. Download it right away and captivate your audience.
-
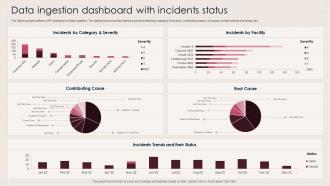 Data Ingestion Dashboard Snapshot With Incidents Status
The following slide outlines a KPI dashboard of data ingestion. The dashboard covers key metrics such as incidents by category and severity, contributing cause, root cause, incident trends and status, etc. Introducing our Data Ingestion Dashboard Snapshot With Incidents Status set of slides. The topics discussed in these slides are Data Ingestion, Dashboard, Incidents Status. This is an immediately available PowerPoint presentation that can be conveniently customized. Download it and convince your audience.
-
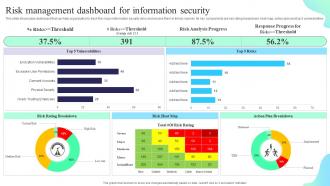 Risk Management Dashboard For Information Security Formulating Cybersecurity Plan
This slide showcases dashboard that can help organization to track the major information security risks and resolve them in timely manner. Its key components are risk rating breakdown, heat map, action plan and top 5 vulnerabilities. Deliver an outstanding presentation on the topic using this Risk Management Dashboard For Information Security Formulating Cybersecurity Plan. Dispense information and present a thorough explanation of Risk Management, Dashboard, Information Security using the slides given. This template can be altered and personalized to fit your needs. It is also available for immediate download. So grab it now.
-
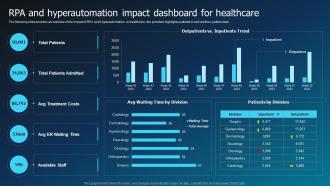 RPA And Hyperautomation Impact Dashboard For Healthcare Hyperautomation Industry Report
The following slide provides an overview of the impact of RPA and Hyperautomation on healthcare, the provided highlights patients in and out time, patient data. Present the topic in a bit more detail with this RPA And Hyperautomation Impact Dashboard For Healthcare Hyperautomation Industry Report. Use it as a tool for discussion and navigation on Total Patients, Available Staff, Patients By Division. This template is free to edit as deemed fit for your organization. Therefore download it now.
-
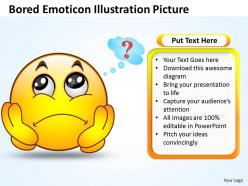 Business powerpoint templates bored emoticon illustration picture sales ppt slides
This PowerPoint Diagram shows you the many types of bored emoticons expressing your feelings. This Diagram signifies disinterest, dull, fatigue, inattentive, sick and tired, spiritless, tired, turned off.
-
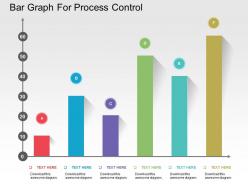 Bar graph for process control flat powerpoint design
We are proud to present our bar graph for process control flat powerpoint design. This power point template diagram has been crafted with graphic of bar graph. This diagram template contains the concept of process control. Use this PPT diagram for business and marketing process related presentations.
-
 Investment planning icon ppt images
Presenting investment planning icon ppt images. This is a investment planning icon ppt images. This is a eight stage process. The stages in this process are investment, venture capital, funding, private equity.
-
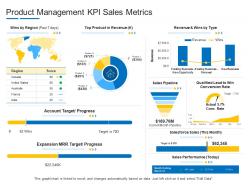 Product management kpi sales metrics product channel segmentation ppt summary
Deliver an outstanding presentation on the topic using this Product Management KPI Sales Metrics Product Channel Segmentation Ppt Summary. Dispense information and present a thorough explanation of Revenue, Sales Performance, Account Target, Progress, Sales Pipeline using the slides given. This template can be altered and personalized to fit your needs. It is also available for immediate download. So grab it now.
-
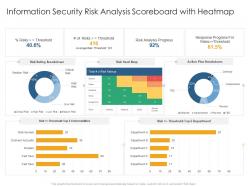 Information security risk analysis scoreboard with heatmap information security risk scorecard
Present the topic in a bit more detail with this Information Security Risk Analysis Scoreboard With Heatmap Information Security Risk Scorecard. Use it as a tool for discussion and navigation on Risk Rating Breakdown, Risk Heat Map, Action Plan Breakdown. This template is free to edit as deemed fit for your organization. Therefore download it now.
-
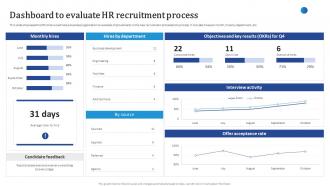 Dashboard To Evaluate HR Recruitment Process Streamlining HR Recruitment Process
This slide showcases the KPIs that would help a business organization to evaluate improvements in the new recruitment and selection process. It includes hires per month, hires by department, etc. Deliver an outstanding presentation on the topic using this Dashboard To Evaluate HR Recruitment Process Streamlining HR Recruitment Process. Dispense information and present a thorough explanation of Objectives, Interview Activity, Offer Acceptance using the slides given. This template can be altered and personalized to fit your needs. It is also available for immediate download. So grab it now.
-
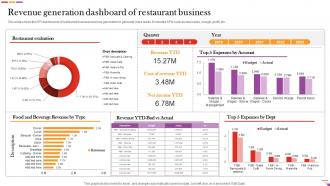 Revenue Generation Dashboard Of Restaurant Business Digital And Offline Restaurant
This slide shows the KPI dashboards of restaurant business revenue generation to generate more leads. It includes KPIs such as total sales, margin ,profit, etc. Present the topic in a bit more detail with this Revenue Generation Dashboard Of Restaurant Business Digital And Offline Restaurant Use it as a tool for discussion and navigation on Restaurant Evaluation, Revenue, Restaurant Business This template is free to edit as deemed fit for your organization. Therefore download it now.
-
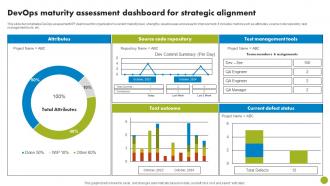 DevOps Maturity Assessment Dashboard For Strategic Alignment
This slide demonstrates DevOps assessment KPI dashboard for organizations current maturity level, strengths, weaknesses and areas for improvement. It includes metrics such as attributes, source code repository, test management tools, etc. Introducing our DevOps Maturity Assessment Dashboard For Strategic Alignment set of slides. The topics discussed in these slides are Source Code Repository, Test Management Tools, Current Defect Status. This is an immediately available PowerPoint presentation that can be conveniently customized. Download it and convince your audience.
-
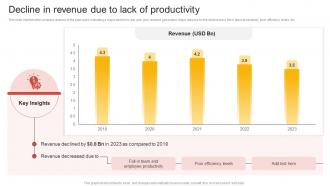 Decline In Revenue Due To Lack Of Comprehensive Guide Of Team Restructuring
This slide mentions the company revenue of the past years indicating a major decline in year over year revenue generation. Major reasons for the decline are a fall in team productivity, poor efficiency levels, etc. Present the topic in a bit more detail with this Decline In Revenue Due To Lack Of Comprehensive Guide Of Team Restructuring. Use it as a tool for discussion and navigation on Revenue, Productivity, Efficiency. This template is free to edit as deemed fit for your organization. Therefore download it now.
-
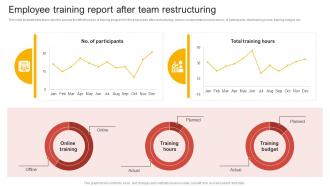 Employee Training Report After Team Comprehensive Guide Of Team Restructuring
This slide illustrates the team report to assess the effectiveness of training program for the employees after restructuring. various components involved are no. of participants, total training hours, training budget, etc. Present the topic in a bit more detail with this Employee Training Report After Team Comprehensive Guide Of Team Restructuring. Use it as a tool for discussion and navigation on Training, Budget, Report. This template is free to edit as deemed fit for your organization. Therefore download it now.
-
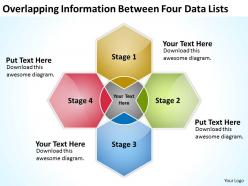 Business diagram examples overlapping information between four data lists powerpoint templates
We are proud to present our business diagram examples overlapping information between four data lists powerpoint templates. Business PowerPoint Diagram demonstrates stages of business process, direct interaction between parts of production process and overlapping. Our PPTs are effectively color coded to priorities your plans. They automatically highlight the sequence of events you desire.
-
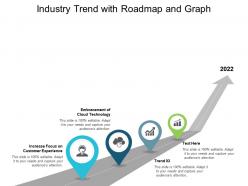 Industry trend with roadmap and graph
Presenting this set of slides with name Industry Trend With Roadmap And Graph. This is a four stage process. The stages in this process are Industry Trends, Online Banking, Centralized Network. This is a completely editable PowerPoint presentation and is available for immediate download. Download now and impress your audience.
-
 Portfolio management system scorecard with budgeted and total cost
Present the topic in a bit more detail with this Portfolio Management System Scorecard With Budgeted And Total Cost. Use it as a tool for discussion and navigation on Portfolio, Management, Scorecard. This template is free to edit as deemed fit for your organization. Therefore download it now.
-
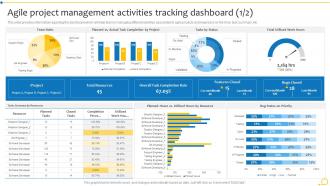 Agile Project Management Activities Tracking Dashboard Agile Initiation Playbook
This slide provides information regarding the dashboard which will help team in managing different activities associated to agile projects and keep track on the time, task summary, etc. Present the topic in a bit more detail with this Agile Project Management Activities Tracking Dashboard Agile Initiation Playbook. Use it as a tool for discussion and navigation on Team Roles, Project, Total Resources. This template is free to edit as deemed fit for your organization. Therefore download it now.
-
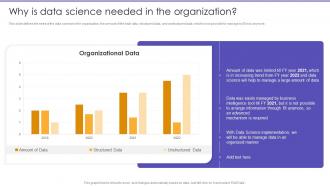 Why Is Data Science Needed In The Organization Information Science Ppt Infographics
This slide defines the need of the data science in the organization, the amount of the total data, structured data, and unstructured data, which is not possible to manage by BI tool anymore. Present the topic in a bit more detail with this Why Is Data Science Needed In The Organization Information Science Ppt Infographics. Use it as a tool for discussion and navigation on Science Needed, Organization. This template is free to edit as deemed fit for your organization. Therefore download it now.
-
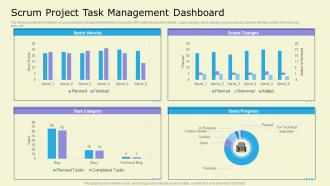 Scrum Project Task Management Dashboard
The following slide demonstrates scrum project task management dashboard. It includes information about sprint velocity, scope changes, tasks category, tasks progress, planned, finished, added, removed, bug, story, etc. Presenting our well structured Scrum Project Task Management Dashboard. The topics discussed in this slide are Scrum Project, Task Management, Dashboard. This is an instantly available PowerPoint presentation that can be edited conveniently. Download it right away and captivate your audience.
-
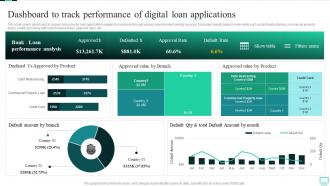 Dashboard To Track Performance Of Digital Loan Applications Omnichannel Banking Services
This slide covers dashboard to assess outcomes for loan applications applied by customer through various omnichannel banking services. It includes results based on elements such as debt restructuring, commercial property loans, credit card along with branch based loans, approval rates, etc. Deliver an outstanding presentation on the topic using this Dashboard To Track Performance Of Digital Loan Applications Omnichannel Banking Services. Dispense information and present a thorough explanation of Performance Analysis, Product, Dashboard using the slides given. This template can be altered and personalized to fit your needs. It is also available for immediate download. So grab it now.
-
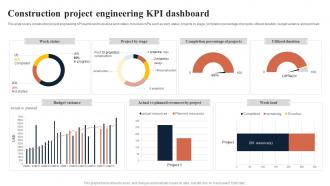 Construction Project Engineering KPI Dashboard
This slide covers construction project engineering KPI dashboard to analyse work status. It involves KPIs such as work status, projects by stage, completion percentage of projects, utilized duration, budget variance and workload. Introducing our Construction Project Engineering KPI Dashboard set of slides. The topics discussed in these slides are Work Status, Project By Stage, Utilized Duration. This is an immediately available PowerPoint presentation that can be conveniently customized. Download it and convince your audience.
-
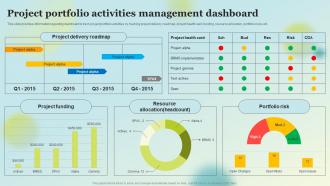 Project Portfolio Activities Management Dashboard Stakeholders Involved In Project Coordination
This slide provides information regarding dashboard to track project portfolio activities by tracking project delivery roadmap, project health card, funding, resource allocation, portfolio risks, etc. Deliver an outstanding presentation on the topic using this Project Portfolio Activities Management Dashboard Stakeholders Involved In Project Coordination. Dispense information and present a thorough explanation of Project, Activities, Management using the slides given. This template can be altered and personalized to fit your needs. It is also available for immediate download. So grab it now.
-
 Learning And Development Cost Analysis Dashboard
This slide showcases a dashboard for cost analysis of learning and development. It also includes key indicators such as total and unique trained, total invited, training cost, cost YTD, cost per employee, expensive programs, etc. Presenting our well structured Learning And Development Cost Analysis Dashboard. The topics discussed in this slide are Business, Vertical, Location. This is an instantly available PowerPoint presentation that can be edited conveniently. Download it right away and captivate your audience.
-
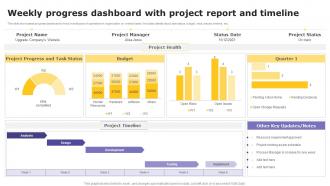 Weekly Progress Dashboard With Project Report And Timeline
This slide showcases progress dashboard to track overall pace of operations in organization on weekly basis. It includes details about task status, budget, risks, issues, timeline, etc. Introducing our Weekly Progress Dashboard With Project Report And Timeline set of slides. The topics discussed in these slides are Progress, Report, Timeline. This is an immediately available PowerPoint presentation that can be conveniently customized. Download it and convince your audience.
-
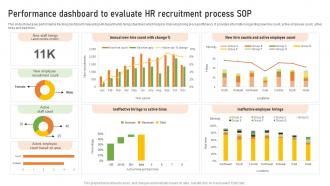 Performance Dashboard To Evaluate HR Recruitment Process Sop
This slide showcases performance tracking dashboard measuring HR departments hiring objectives which helps in improving hiring process efficiency. It provides information regarding new hire count, active employee count, active hires and bad hires. Introducing our Performance Dashboard To Evaluate HR Recruitment Process Sop set of slides. The topics discussed in these slides are Ineffective Employee Hirings, Active Employee Count, Recruitment Process. This is an immediately available PowerPoint presentation that can be conveniently customized. Download it and convince your audience.
-
 Economic growth powerpoint presentation slides
These high quality, editable pre-designed powerpoint slides and powerpoint templates have been carefully created by our professional team to help you impress your audience. Each graphic in every powerpoint slide is vector based and is 100% editable in powerpoint. Each and every property of any slide - color, size, shading etc can be modified to build an effective powerpoint presentation. Use these slides to convey complex business concepts in a simplified manner. Any text can be entered at any point in the powerpoint slide. Simply DOWNLOAD, TYPE and PRESENT
-
 Business workflow diagram 3d illustration of planning process 5 stages powerpoint slides
We are proud to present our business workflow diagram 3d illustration of planning process 5 stages powerpoint slides. Use this diagram for proposed projects and project plans. It features an image of circular jigsaw puzzles consisting of five stages. Describe your methods with this process diagram for PowerPoint.
-
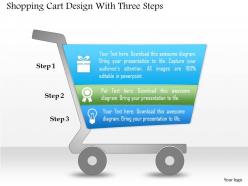 0514 shopping cart design with three steps powerpoint presentation
Presentation design provide accurate and error free information. PPT slide crafted to fulfil your marketing management needs. The design has notable excellence and accuracy for your corporate presentations. Offers modification in icons, colors, text, fonts, etc. as per your requirements. Adjustable presentation designs as can be shared in standard and widescreen view. Easy to download and insert it your presentation.
-
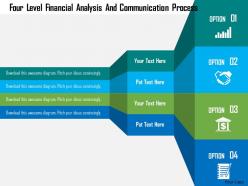 Four level financial analysis and communication process flat powerpoint design
We are proud to present our four level financial analysis and communication process flat powerpoint design. This power point template diagram has been crafted with graphic of four level. This PPT diagram contains the concept of financial analysis and communication process. Use this PPT diagram for finance related presentations.
-
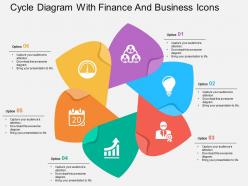 Cycle diagram with finance and business icons flat powerpoint design
User friendly and fine quality PPT templates. Customization of Presentation graphics and diagrams according to desire and need. Fit into widescreen. Effortless conversion into PDF/ JPG format. Personalisation by insertion of company trade name/ logo. Compatible with Google slides. Beneficial for business entities, financiers, marketers, shareholders, revenue officers, professors, teachers, students.
-
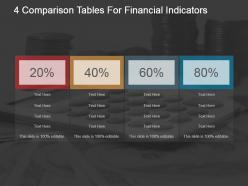 4 comparison tables for financial indicators powerpoint graphics
Presenting 4 Comparison Tables For Financial Indicators PowerPoint Graphics slide. The slide is fully customizable in PowerPoint. The colors of background and table can be changed as per your requirement. The presentation content can replace the dummy text. The font style, size and colors can be altered. Company name and logo can be inserted with ease. The template is suitable for use in Google Slides too. It is available in 4:3 and 16:9 aspect ratios. High resolution ensures good quality. It can be downloaded easily.
-
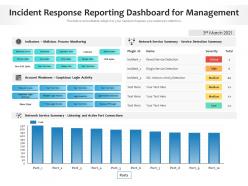 Incident response reporting dashboard for management
Presenting our well-structured Incident Response Reporting Dashboard For Management. The topics discussed in this slide are Indicators, Malicious, Process Monitoring, Account Weakness, Suspicious Login Activity. This is an instantly available PowerPoint presentation that can be edited conveniently. Download it right away and captivate your audience.
-
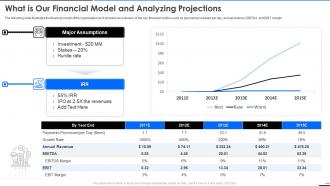 Square what is our financial model and analyzing projections ppt slides pictures
The following slide illustrates the financial model of the organization as it provides an overview of the key financial metrics such as payment processed per day, annual revenue, EBITDA and EBIT margin. Present the topic in a bit more detail with this Square What Is Our Financial Model And Analyzing Projections Ppt Slides Pictures. Use it as a tool for discussion and navigation on Major Assumptions, IRR, Growth Rate, Annual Revenue, EBITDA Margin, 2021. This template is free to edit as deemed fit for your organization. Therefore download it now.
-
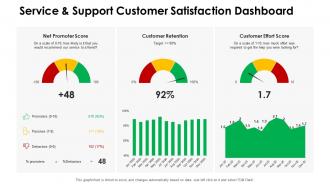 Dashboards by function service and support customer satisfaction dashboard
Deliver an outstanding presentation on the topic using this Dashboards By Function Service And Support Customer Satisfaction Dashboard. Dispense information and present a thorough explanation of Service And Support Customer Satisfaction Dashboard using the slides given. This template can be altered and personalized to fit your needs. It is also available for immediate download. So grab it now.
-
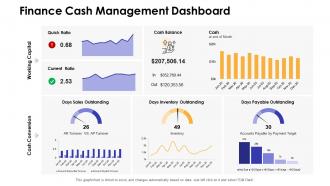 Finance cash management dashboard dashboards snapshot by function
Present the topic in a bit more detail with this Finance Cash Management Dashboard Dashboards Snapshot By Function. Use it as a tool for discussion and navigation on Finance Cash Management Dashboard . This template is free to edit as deemed fit for your organization. Therefore download it now.
-
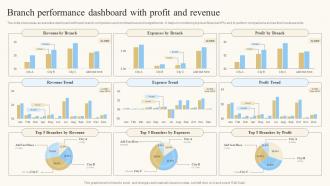 Branch Performance Dashboard With Profit And Revenue
The slide showcases an executive dashboard with bank branch comparison and combined real and budget trends . It helps in monitoring top level financial KPIs and to perform comparisons across their business units. Introducing our Branch Performance Dashboard With Profit And Revenue set of slides. The topics discussed in these slides are Profit Trend, Expense Trend, Revenue Trend. This is an immediately available PowerPoint presentation that can be conveniently customized. Download it and convince your audience.
-
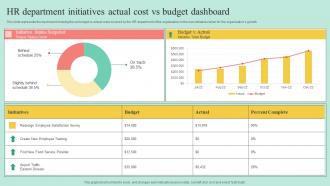 HR Department Initiatives Actual Cost Vs Budget Dashboard
This slide represents the dashboard showing the set budget vs actual costs incurred by the HR department of the organization in the new initiatives taken for the organizations growth. Presenting our well structured HR Department Initiatives Actual Cost Vs Budget Dashboard. The topics discussed in this slide are Initiative Status Snapshot, Project Status Count, Initiative Total Budget. This is an instantly available PowerPoint presentation that can be edited conveniently. Download it right away and captivate your audience.
-
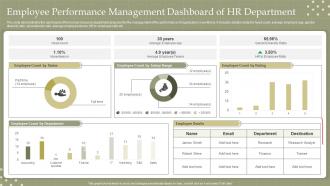 Employee Performance Management Dashboard Of HR Department
This slide demonstrates the dashboard of the human resource department prepared for the management of the performance of organizations workforce. It includes details related to head count, average employee age, gender diversity ratio, absenteeism rate, average employee tenure, HR to employee ratio etc. Introducing our Employee Performance Management Dashboard Of HR Department set of slides. The topics discussed in these slides are Employee Performance, Management Dashboard, Hr Department. This is an immediately available PowerPoint presentation that can be conveniently customized. Download it and convince your audience.
-
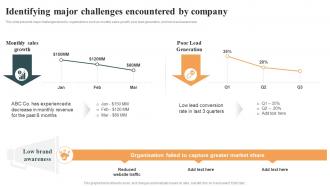 Identifying Major Challenges Optimizing Cold Calling Process To Maximize SA SS
This slide presents major challenges faced by organizations such as monthly sales growth, poor lead generation, and low brand awareness. Deliver an outstanding presentation on the topic using this Identifying Major Challenges Optimizing Cold Calling Process To Maximize SA SS. Dispense information and present a thorough explanation of Decrease, Market, Reduced using the slides given. This template can be altered and personalized to fit your needs. It is also available for immediate download. So grab it now.
-
 Liquid in a glass sphere ppt 2
This template is skillfully designed and is completely editable to suit all the needs and requirements of the user. The color of the font, its size, style, and all other elements can be customized according to the user's desire The text in the PPT placeholder can be replaced with the desired information making this template highly flexible and adaptable as well. This template is also compatible with various Microsoft versions and formats like Google Slides, JPG, PDF, etc so the user will face no issue in saving it in the format of his choice.
-
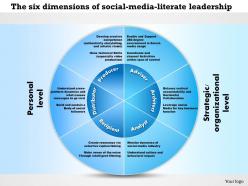 0514 the six dimensions of social media literate leadership nf powerpoint presentation
Pre-designed social media literate PowerPoint Slide Scheme. This design is available both in standard and widescreen view. Simple to transform into JPEG or PDF document and is easily downloadable PPT design to insert data and share. Available in high-quality analysis display. Fully adjustable with Google slides. Useful for business people, researchers, analysts, marketers, etc. Quickly Add or remove text as per the trade requirement.
-
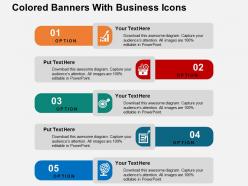 Colored banners with business icons flat powerpoint design
The PPT images offer compatibility with Google templates. High resolution icons for clear message delivery. An easy access to make the desired changes or edit it anyways. Wide screen view of the slides. Easy conversion into JPG or PDF format. Unique and informational content. Valuable for business professionals, sales representatives, marketing professionals, students and selling investigators.
-
 Mobile banking image layout
Presenting this set of slides with name - Mobile Banking Image Layout. This is a one stage process. The stages in this process are Mobile Banking, Online Banking, Mobile Payment.
-
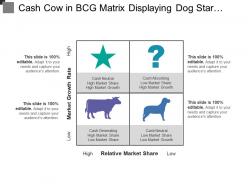 Cash cow in bcg matrix displaying dog star question and cow
Presenting this set of slides with name - Cash Cow In Bcg Matrix Displaying Dog Star Question And Cow. This is a four stage process. The stages in this process are Cash Cow, Business Venture, Cash Flow.
-
 Stock Pitch Fast Food Services Powerpoint Presentation Ppt Slide Template
Introducing Stock Pitch Fast Food Services PowerPoint Presentation Ppt Slide Template. This complete PPT deck is 25 slides long. All the templates can be customized by editing text, font, background, color, and pattern. You can also convert the PPT format into PNG, PDF, and JPG within seconds. The presentation is compatible with Google Slides. Advanced accessibility features make it suitable for widescreen as well as standard screen formats.
-
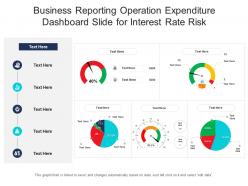 Business reporting operation expenditure dashboard slide for interest rate risk powerpoint template
This is a Business Reporting Operation Expenditure Dashboard Slide For Interest Rate Risk Powerpoint Template that you can use to present real-time information about your business. With a variety of graphical representations that are in-line with the current trends, this is a great way to display quantified data and stats. This is also a great PowerPoint slide to make informed decisions based on the data and results depicted. Since this template can accommodate a lot of statistical information in one-go it can be put to use by different department heads of the organization. This PPT slide can also be used to present a thorough discussion on various KPIs, all excel-linked and susceptible to innumerable changes. Thus helping in the portrayal of calculative data in a highly professional format. Not only this, but it can also be reproduced in JPG, PNG, and PDF formats. Therefore, reinvent the wheel by downloading this PPT slide now.
-
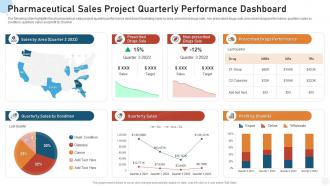 Pharmaceutical sales project quarterly performance dashboard
Presenting our well structured Pharmaceutical Sales Project Quarterly Performance Dashboard. The topics discussed in this slide are Sales By Area, Quarterly Sales By Condition, Quarterly Sales. This is an instantly available PowerPoint presentation that can be edited conveniently. Download it right away and captivate your audience.
-
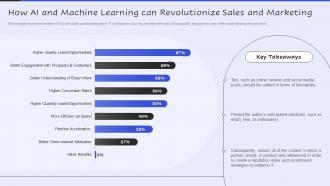 How Ai And Machine Learning Can Revolutionize Servicenow Performance Analytics
This template covers the benefits of AI for the Sales and Marketing team. AI and Machine Learning benefits in the area of lead quality, engagement, and better understanding of buyer intent. Deliver an outstanding presentation on the topic using this How Ai And Machine Learning Can Revolutionize Servicenow Performance Analytics. Dispense information and present a thorough explanation of AI And Machine Learning, Revolutionize Sales And Marketing using the slides given. This template can be altered and personalized to fit your needs. It is also available for immediate download. So grab it now.
-
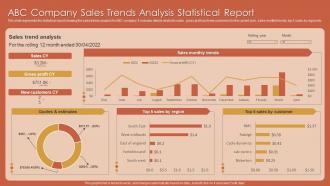 ABC Company Sales Trends Analysis Statistical Report
Introducing our ABC Company Sales Trends Analysis Statistical Report set of slides. The topics discussed in these slides are ABC Company Sales, Trends Analysis, Statistical Report. This is an immediately available PowerPoint presentation that can be conveniently customized. Download it and convince your audience.
-
 KPI Dashboard For Supplier Monitoring Strategic Approach For Supplier Upskilling
The slide depicts the KPI dashboard for the supplier monitoring. It provides information regarding the monthly purchase value, number of contracted suppliers, scheduled and completed audits along with vendors quality performance. Deliver an outstanding presentation on the topic using this KPI Dashboard For Supplier Monitoring Strategic Approach For Supplier Upskilling. Dispense information and present a thorough explanation of KPI Dashboard, Supplier Monitoring, Suppliers Categories using the slides given. This template can be altered and personalized to fit your needs. It is also available for immediate download. So grab it now.
-
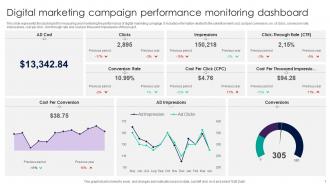 Digital Marketing Campaign Performance Monitoring Dashboard
This slide represents the dashboard for measuring and monitoring the performance of digital marketing campaign. It includes information related to the advertisement cost, cost per conversion, no. of clicks, conversion rate, impressions, cost per click, click through rate and cost per thousand impressions of the project. Presenting our well structured Digital Marketing Campaign Performance Monitoring Dashboard. The topics discussed in this slide are Impressions, Conversion Rate, Cost Per Conversion. This is an instantly available PowerPoint presentation that can be edited conveniently. Download it right away and captivate your audience.
-
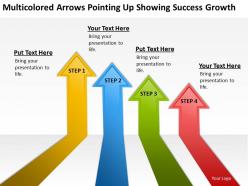 Work flow business process diagram arrows pointing up showing success growth powerpoint slides
We are proud to present our work flow business process diagram arrows pointing up showing success growth powerpoint slides. The above template displays a diagram of multicolored arrows pointing upwards to show business success and growth. Use this diagram for marketing process. The structure of our templates allows you to effectively highlight the key issues concerning the growth of your business.
-
 Cost revenue icon with hand
Presenting Cost Revenue Icon With Hand PowerPoint design. Now download it here and start editing it right away. You can edit it with your teammates using Google Slides. This PPT presentation is easy to convert to PNG, JPEG, and PDF formats without having its graphics depleted in the process. Upon downloading here, you can avail its standard screen and widescreen sizes. So hurry up and start downloading from below.
-
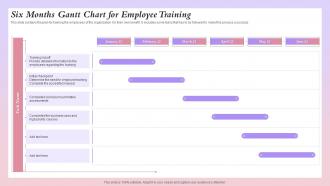 Six Months Gantt Chart For Employee Training
This slide contains the plan for training the employees of the organization for their own benefit. It includes some tasks that has to be followed to make this process a success. Introducing our Six Months Gantt Chart For Employee Training that is designed to showcase some of the vital components that will help you create timelines, roadmaps, and project plans. In addition, also communicate your project durations, milestones, tasks, subtasks, dependencies, and other attributes using this well-structured Six Months Gantt Chart For Employee Training template. You can also exhibit preeminence against time by deploying this easily adaptable slide to your business presentation. Our experts have designed this template in such a way that it is sure to impress your audience. Thus, download it and steer your project meetings, meetups, and conferences.
-
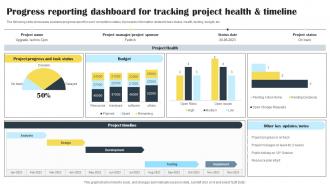 Progress Reporting Dashboard For Tracking Project Health And Timeline
The following slide showcases business progress report for work completion status. It presents information related to task status, health, testing, budget, etc. Introducing our Progress Reporting Dashboard For Tracking Project Health And Timeline set of slides. The topics discussed in these slides are Project Manager, Budget, Project Progress. This is an immediately available PowerPoint presentation that can be conveniently customized. Download it and convince your audience.
-
 Evaluating Projected Vs Actual Sales Adopting Sales Risks Management Strategies
The following slide depicts the evaluation of existing sales performance to set future standards and determine opportunities for improvement. It mainly includes key performance indicators KPIssuch as pipeline, forecast, attainment, gap etc. Deliver an outstanding presentation on the topic using this Evaluating Projected Vs Actual Sales Adopting Sales Risks Management Strategies. Dispense information and present a thorough explanation of Forecast, Attainment, Gap using the slides given. This template can be altered and personalized to fit your needs. It is also available for immediate download. So grab it now.
-
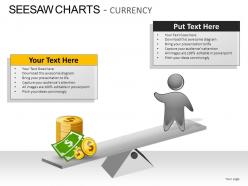 Seesaw charts currency powerpoint presentation slides
These high quality, editable pre-designed powerpoint slides and powerpoint templates have been carefully created by our professional team to help you impress your audience. Each graphic in every powerpoint slide is vector based and is 100% editable in powerpoint.Each and every property of any slide - color, size, shading etc can be modified to build an effective powerpoint presentation. Use these slides to convey complex business concepts in a simplified manner. Any text can be entered at any point in the powerpoint slide. Simply DOWNLOAD, TYPE and PRESENT


