Finance PowerPoint Templates, Presentation Slide Diagrams & PPT Graphics
- Sub Categories
-
- 30 60 90 Day Plan
- Advertising
- Agile Development
- Aims and Objectives
- Arrows
- Before and After
- Blockchain Bitcoin
- Boxes
- Business
- Calender
- Case Study
- Celebrations
- Certificates
- Challenges Opportunities
- Channel Distribution
- Children
- Communication
- Competitive Landscape
- Computer
- Concepts
- Construction Management
- Corporate
- Crowdfunding
- Current State Future State
- Custom PowerPoint Diagrams
- Digital Transformation
- Dos and Donts
- Economics
- Education
- Environment
- Events
- Festival
- Finance
- Financials
- Food
- Game
- Gap Analysis
- Generic
- Geographical
- Health
- Heatmaps
- Holidays
- Icons
- Input Process Output
- Internet
- Key Messages
- Key Wins
- Ladder
- Leadership
- Lists
- Lucky Draw
- Management
- Marketing
- Measuring
- Medical
- Music
- News
- Next Steps
- People Process Technology
- Pillars
- Planning
- Post-it-Notes
- Problem Statement
- Process
- Proposal Management
- Pros and Cons
- Puzzle
- Puzzles
- Recruitment Strategy
- Religion
- Research and Development
- Risk Mitigation Strategies
- Roadmap
- Selling
- Shapes
- Short Term Long Term
- Social
- Stairs
- Start Stop Continue
- Strategy
- Symbol
- Technology
- Thesis Defense Dissertation
- Timelines
- Traffic
- Transition Plan
- Transportation
- Vehicles
- Venture Capital Funding
- Warning
- Winners
- Word Cloud
-
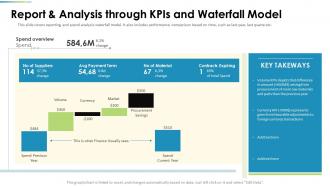 Procurement Analysis Report And Analysis Through KPIS And Waterfall Model Ppt Icons
This slide covers reporting and spend analysis waterfall model. It also includes performance comparison based on time, such as last year, last quarte etc. Deliver an outstanding presentation on the topic using this Procurement Analysis Report And Analysis Through KPIS And Waterfall Model Ppt Icons. Dispense information and present a thorough explanation of Report And Analysis Through KPIS And Waterfall Model using the slides given. This template can be altered and personalized to fit your needs. It is also available for immediate download. So grab it now.
-
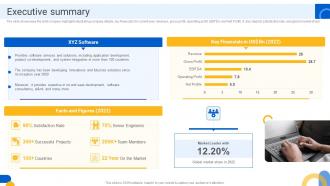 Executive Summary Software And Application Development Company Profile
The slide showcases the brief company highlights illustrating company details, key financials for current year revenue, gross profit, operating profit, EBITDA and Net Profit. It also depicts satisfaction rate, and global market share. Present the topic in a bit more detail with this Executive Summary Software And Application Development Company Profile. Use it as a tool for discussion and navigation on Satisfaction Rate, Successful Projects, Team Members, Senior Engineers. This template is free to edit as deemed fit for your organization. Therefore download it now.
-
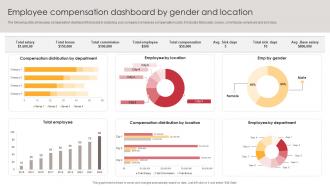 Employee Compensation Dashboard By Gender And Location
The following slide showcases compensation dashboard that assist in analyzing your companys employee compensation costs. It includes total salary, bonus, commission, employee and sick days. Presenting our well structured Employee Compensation Dashboard By Gender And Location. The topics discussed in this slide are Compensation Distribution, Compensation Dashboard, Gender And Location. This is an instantly available PowerPoint presentation that can be edited conveniently. Download it right away and captivate your audience.
-
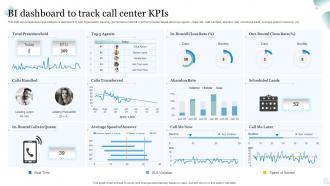 BI Dashboard To Track Call Center KPIS
This slide showcases business intelligence dashboard to help organization track key performance metrics. It further includes details about top agents, close rate, calls handled, abandon rate, scheduled leads, average speed of answer, etc. Presenting our well structured BI Dashboard To Track Call Center KPIS. The topics discussed in this slide are Abandon Rate, Calls Transferred, Premium Sold. This is an instantly available PowerPoint presentation that can be edited conveniently. Download it right away and captivate your audience.
-
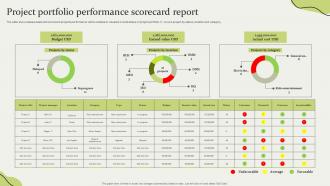 Project Portfolio Performance Scorecard Report
The slide showcaseses a balanced scorecard projects performance which enables to visualize overall status of project portfolio. It covers project by status, location abd category. presenting our well structured project portfolio performance scorecard report. the topics discussed in this slide are budget, earned value, actual cost. this is an instantly available powerpoint presentation that can be edited conveniently. download it right away and captivate your audience.
-
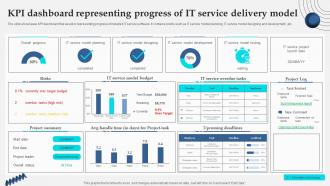 Kpi Dashboard Representing Progress Of It Service Delivery Model
The slide showcases KPI dashboard that assist in representing progress of installed IT service software. It contains points such as IT service model planning, IT service model designing and development, etc. Presenting our well structured Kpi Dashboard Representing Progress Of It Service Delivery Model. The topics discussed in this slide are Currently Over Target Budget, Overdue Tasks.This is an instantly available PowerPoint presentation that can be edited conveniently. Download it right away and captivate your audience.
-
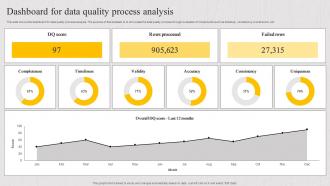 Dashboard For Data Quality Process Analysis
This slide shows the dashboard for data quality process analysis. The purpose of this template is to showcase the data quality process through evaluation of components such as timelines, consistency overall score, etc. Presenting our well structured Dashboard For Data Quality Process Analysis. The topics discussed in this slide are Completeness, Timeliness, Validity, Accuracy, Consistency. This is an instantly available PowerPoint presentation that can be edited conveniently. Download it right away and captivate your audience.
-
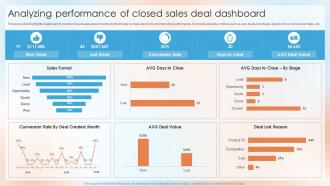 Analyzing Performance Of Closed Sales Deal Dashboard Top Sales Closing Techniques SA SS
Following slide highlights dashboard to monitor closed sales deal of company that helps to make decisions on improving performance. It includes pipeline metrics such as won deals, lost deals, days to close, conversion rates, etc. Present the topic in a bit more detail with this Analyzing Performance Of Closed Sales Deal Dashboard Top Sales Closing Techniques SA SS. Use it as a tool for discussion and navigation on Deal Value, Deal Lost Reason. This template is free to edit as deemed fit for your organization. Therefore download it now.
-
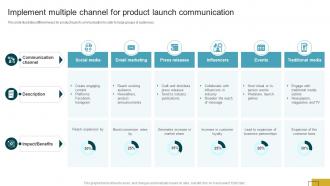 Product Launch Communication Implement Multiple Channel For Product Launch Communication
This slide illustrates different ways for product launch communication to cater to large groups of audiences. Present the topic in a bit more detail with this Product Launch Communication Implement Multiple Channel For Product Launch Communication Use it as a tool for discussion and navigation on Medium, Details, Channels This template is free to edit as deemed fit for your organization. Therefore download it now.
-
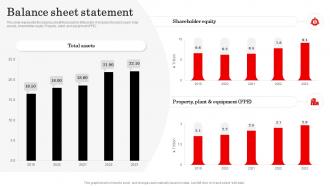 Balance Sheet Statement Mitsubishi Company Profile CP SS
This slide represents the balance sheet financials for Mitsubishi. It includes the last 5 years total assets, shareholder equity, Property, plant, and equipment PPE. Present the topic in a bit more detail with this Balance Sheet Statement Mitsubishi Company Profile CP SS Use it as a tool for discussion and navigation on Shareholder Equity, Total Assets, Property, Plant and Equipment This template is free to edit as deemed fit for your organization. Therefore download it now.
-
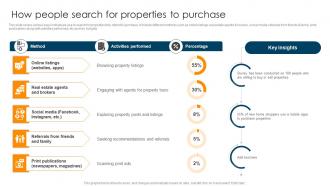 How People Search For Properties To Purchase Ultimate Guide To Understand Role BCT SS
This slide covers various ways individuals use to search for properties they intend to purchase. It include different methods such as online listings, real estate agents and brokers, social media, referrals from friends and family, print publications along with activities performed, etc and key insights. Deliver an outstanding presentation on the topic using this How People Search For Properties To Purchase Ultimate Guide To Understand Role BCT SS. Dispense information and present a thorough explanation of Method, Activities Performed, Percentage using the slides given. This template can be altered and personalized to fit your needs. It is also available for immediate download. So grab it now.
-
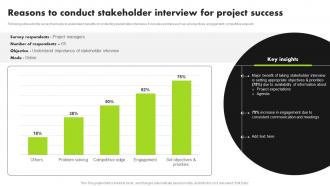 Strategic Approach For Developing Stakeholder Reasons To Conduct Stakeholder Interview For Project
Following slide exhibits survey that helps to understand benefits of conducting stakeholder interviews. It includes pointers such as set objectives, engagement, competitive edge etc. Deliver an outstanding presentation on the topic using this Strategic Approach For Developing Stakeholder Reasons To Conduct Stakeholder Interview For Project. Dispense information and present a thorough explanation of Stakeholder Interview, Project Success, Engagement, Competitive Edge using the slides given. This template can be altered and personalized to fit your needs. It is also available for immediate download. So grab it now.
-
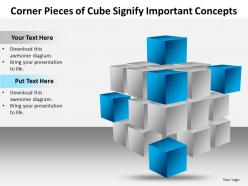 Corner pieces of cube signify important concets powerpoint templates images 1121
Use this 3D PowerPoint Diagram to represent the important concepts of the corner points in Business activity. It signifies box, difficulty, dilemma, distress, fix, hole, impasse, impediment, jam, knot, pickle, plight etc.
-
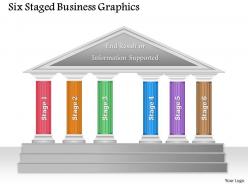 0314 business ppt diagram six staged business graphics powerpoint template
We are proud to present our 0314 business ppt diagram six staged business graphics powerpoint template. Use our 0314 Business Ppt Diagram Six Staged Business Graphics Powerpoint Template and nail the day. Lead your team show them the way. Our management are building a great reputation. Of being the driving force of a good presentation.
-
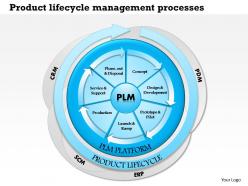 0514 product lifecycle management processes powerpoint presentation
Stunning layout pictures as can be revamped by your need. Stupendous quality layout visuals with marvelous show. Contents of slide blueprint absolutely amendable to the degree. Numerous choices like JPG and PDF for saving the presentation diagram. Easy extension or removal of undesirable parts as indicated by your advantage. PPT diagram downloadable with different centers and stages. Slide outlines are discernible in regular and large screen see.
-
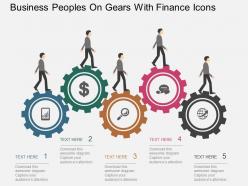 Business peoples on gears with finance icons flat powerpoint desgin
Presentation slide is beneficial for staff, clients, managers and financial management. Flexible action buttons available to perform operations easily. Shapes can be interconnected using connectors and connection pointers. PowerPoint presentation supports filling background in a different color from the text. PPT diagram is compatible with Microsoft 2010 and 2013 versions. High color resolution offered by PPT.
-
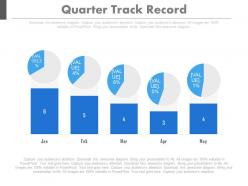 Use quarter percentage track record powerpoint slides
Presenting use quarter percentage track record powerpoint slides. This Power Point template slide has been crafted with graphic of percentage icons. This PPT slide contains the concept of data record analysis. Use this PPT slide for business and sales related presentations.
-
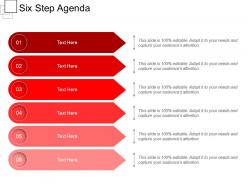 Six step agenda
Presenting this set of slides with name - Six Step Agenda. This is a six stage process. The stages in this process are Red Ribbon, Red Banners.
-
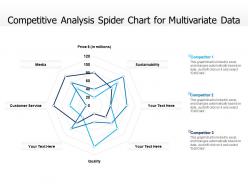 Competitive analysis spider chart for multivariate data
Presenting this set of slides with name Competitive Analysis Spider Chart For Multivariate Data. The topics discussed in these slides are Media, Customer Service, Price Millions, Sustainability, Quality, Competitor. This is a completely editable PowerPoint presentation and is available for immediate download. Download now and impress your audience.
-
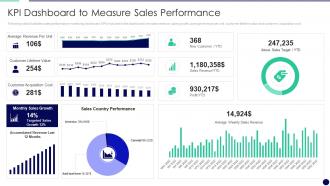 KPI Dashboard To Measure Sales Performance Effectively Managing The Relationship
Following slide illustrates sales performance monitoring dashboard. KPIs included in the dashboard are sales revenue, sales growth, average revenue per unit, customer lifetime value and customer acquisition cost. Deliver an outstanding presentation on the topic using this KPI Dashboard To Measure Sales Performance Effectively Managing The Relationship. Dispense information and present a thorough explanation of KPI Dashboard To Measure Sales Performance using the slides given. This template can be altered and personalized to fit your needs. It is also available for immediate download. So grab it now.
-
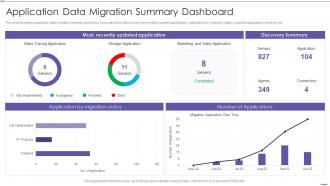 Application Data Migration Summary Dashboard Snapshot
This slide illustrates application data migration summary dashboard Snapshot. It provides information about most recently updated applications, applications by migration status, migrated applications over time, etc. Introducing our Application Data Migration Summary Dashboard set of slides. The topics discussed in these slides are Sales Tracing Application, Marketing, Discovery Summary. This is an immediately available PowerPoint presentation that can be conveniently customized. Download it and convince your audience.
-
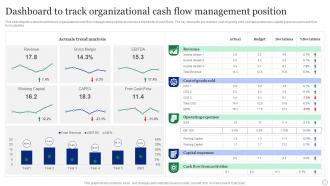 Dashboard To Track Organizational Cash Flow Management Position
This slide depicts a dashboard to track organizational cash flow management position and analyse the trends of cash flows. The key elements are revenue, cost of goods sold, operating expenses, capital expenses and cash flow from activities. Introducing our Dashboard To Track Organizational Cash Flow Management Position set of slides. The topics discussed in these slides are Actuals Trend Analysis, Organizational, Management Position. This is an immediately available PowerPoint presentation that can be conveniently customized. Download it and convince your audience.
-
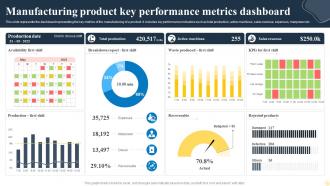 Manufacturing Product Key Performance Metrics Dashboard
This slide represents the dashboard representing the key metrics of the manufacturing of a product. It includes key performance indicators such as total production, active machines, sales revenue, expenses, manpower etc. Presenting our well structured Manufacturing Product Key Performance Metrics Dashboard. The topics discussed in this slide are Manufacturing Product, Performance Metrics Dashboard. This is an instantly available PowerPoint presentation that can be edited conveniently. Download it right away and captivate your audience.
-
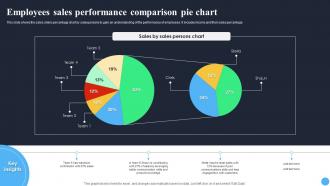 Employees Sales Performance Comparison Pie Chart
This slide shows the sales share percentage chart by salespersons to gain an understanding of the performance of employees. It includes teams and their sales percentage. Presenting our well structured Employees Sales Performance Comparison Pie Chart. The topics discussed in this slide are Sales By Sales, Persons Chart, Pie Chart. This is an instantly available PowerPoint presentation that can be edited conveniently. Download it right away and captivate your audience.
-
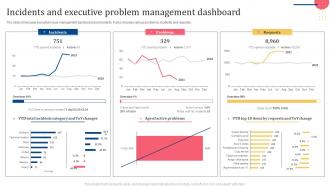 Incidents And Executive Problem Management Dashboard
The slide showcases executive issue management dashboard and incidents. It also includes various problems, incidents and requests. Introducing our Incidents And Executive Problem Management Dashboard set of slides. The topics discussed in these slides are Incidents, Problems, Requests. This is an immediately available PowerPoint presentation that can be conveniently customized. Download it and convince your audience.
-
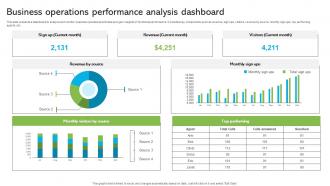 Business Operations Performance Analysis Dashboard
This slide presents a dashboard to analyze and monitor business operational activities and gain insights of functional performance. It includes key components such as revenue, sigh ups, visitors, revenue by source, monthly sign ups, top performing agents, etc. Introducing our Business Operations Performance Analysis Dashboard set of slides. The topics discussed in these slides are Monthly Visitors, Top Performing, Support Agents. This is an immediately available PowerPoint presentation that can be conveniently customized. Download it and convince your audience.
-
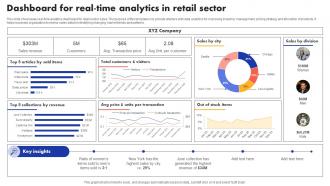 Dashboard For Real Time Analytics In Retail Sector
This slide showcases real-time analytics dashboard for retail sector sales. The purpose of this template is to provide retailers with data analytics for improving inventory management, pricing strategy and allocation of products. It helps business organization to review sales data for identifying changing market trends and patterns. Introducing our Dashboard For Real Time Analytics In Retail Sector set of slides. The topics discussed in these slides are Sold Items, Units Per Transaction. This is an immediately available PowerPoint presentation that can be conveniently customized. Download it and convince your audience.
-
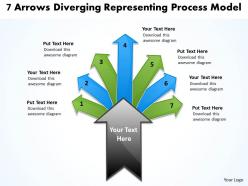 7 arrows diverging representing process model charts and networks powerpoint templates
We are proud to present our 7 arrows diverging representing process model charts and networks powerpoint templates. This diagram is perfect for illustrating a divergence. The single arrow from which the individual arrows flow is large enough to hold text, making this arrow a place to describe the divergence activity.
-
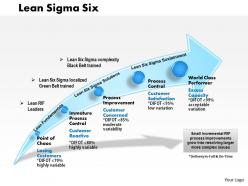 0514 lean sigma six powerpoint presentation
Awesome use of colors and innovatively designed. Absolutely modifiable presentation image as some elements are editable. Easiness of personalization with your company name and logo. PPT illustration can be downloaded easy with no trouble. Transmute into JPG and PDF format. Access to similar designs with different nodes and stages as required. Dexterously shaped PowerPoint infographic. PowerPoint slide can be projected in standard and widescreen view.
-
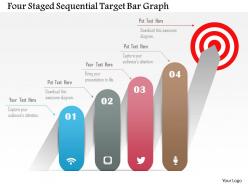 0115 four staged sequential target bar graph powerpoint template
Easy to use and download PPT template. PowerPoint Slide is compatible with Google Slide. Presentation is provided with access to convert into JPG or PDF formats. Picture quality remain same even when showed in wide screen mode. Access provided to customize the PPT diagrams through different colors, size, and font etc.
-
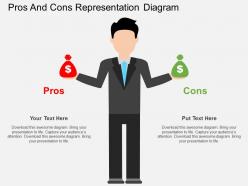 Pros and cons representation diagram flat powerpoint design
We are proud to present our pros and cons representation diagram flat powerpoint design. This power point template diagram has been crafted with graphic of business man with texts. This PPT diagram contains the concept of pros and cons. Use this PPT diagram for business and marketing related presentations.
-
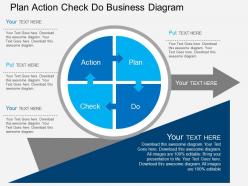 Ij plan action check do business diagram flat powerpoint design
Presentation slides are fully compatible with Google slides. PPT template design can be shared in standard and widescreen view. 100% modified PowerPoint design to enable customization. Quick to download and share. Easily convertible into JPEG and PDF document. Suitable for every corporate team.
-
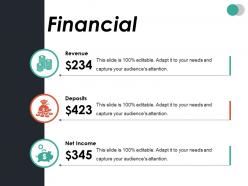 Financial ppt summary professional
Presenting this set of slides with name - Financial Ppt Summary Professional. This is a three stage process. The stages in this process are Finance, Business, Marketing, Strategy, Icons.
-
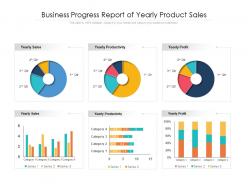 Business progress report of yearly product sales
Presenting this set of slides with name Business Progress Report Of Yearly Product Sales. The topics discussed in these slides are Yearly Sales, Yearly Productivity, Yearly Profit. This is a completely editable PowerPoint presentation and is available for immediate download. Download now and impress your audience.
-
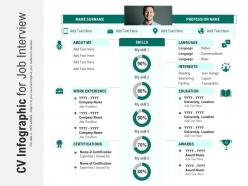 Cv infographic for job interview
Presenting our well structured CV Infographic For Job Interview. The topics discussed in this slide are Work Experience, Education, Interests, Language, Awards, Certifications. This is an instantly available PowerPoint presentation that can be edited conveniently. Download it right away and captivate your audience.
-
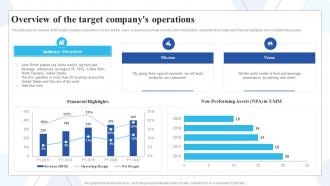 Overview Of The Target Companys Operations Buy Side Of Merger And Acquisition Ppt Summary Pictures
This slide gives an overview of the target companys operations. For the last five years, a business summary contains a firm introduction, mission and vision statement, financial highlights, and non performing assets. Deliver an outstanding presentation on the topic using this Overview Of The Target Companys Operations Buy Side Of Merger And Acquisition Ppt Summary Pictures. Dispense information and present a thorough explanation of Industry Overview, Target Companys, Operations using the slides given. This template can be altered and personalized to fit your needs. It is also available for immediate download. So grab it now.
-
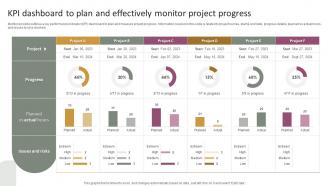 KPI Dashboard To Plan And Effectively Monitor Project Progress
Mentioned slide outlines a key performance indicator KPI dashboard to plan and measure project progress. Information covered in this slide is related to project names, start and end date, progress details, planned vs actual hours, and issues and risks involved. Introducing our KPI Dashboard To Plan And Effectively Monitor Project Progress set of slides. The topics discussed in these slides are KPI Dashboard To Plan, Effectively Monitor, Project Progress. This is an immediately available PowerPoint presentation that can be conveniently customized. Download it and convince your audience.
-
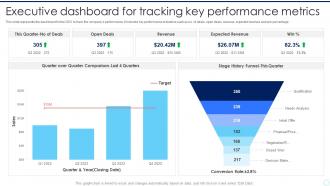 Executive Dashboard For Tracking Key Performance Metrics
This slide represents the dashboard for the CEO to track the companys performance. It includes key performance indicators such as no. of deals, open deals, revenue, expected revenue and win percentage. Presenting our well structured Executive Dashboard For Tracking Key Performance Metrics. The topics discussed in this slide are Open Deals, Revenue, Expected Revenue, Performance Metrics. This is an instantly available PowerPoint presentation that can be edited conveniently. Download it right away and captivate your audience.
-
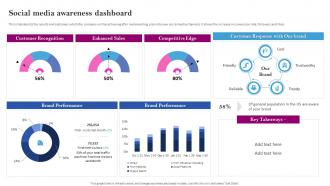 Social Media Branding Social Media Awareness Dashboard
This slide depicts the results and outcomes which the company will be achieving after implementing plan into new social media channels. It shows the increase in conversion rate, followers and likes. Deliver an outstanding presentation on the topic using this Social Media Branding Social Media Awareness Dashboard. Dispense information and present a thorough explanation of Social Media Awareness, Dashboard, Trustworthy, Brand Performance using the slides given. This template can be altered and personalized to fit your needs. It is also available for immediate download. So grab it now.
-
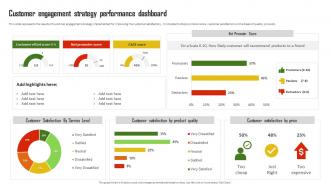 Customer Communication And Engagement Customer Engagement Strategy Performance Dashboard
This slide represents the results of customer engagement strategy implemented for improving the customer satisfaction. It includes the Net promoter score, customer satisfaction on the basis of quality, price etc. Deliver an outstanding presentation on the topic using this Customer Communication And Engagement Customer Engagement Strategy Performance Dashboard. Dispense information and present a thorough explanation of Customer Engagement, Strategy Performance, Dashboard using the slides given. This template can be altered and personalized to fit your needs. It is also available for immediate download. So grab it now.
-
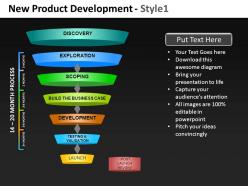 New product development 1 powerpoint presentation slides db
These high quality, editable pre-designed powerpoint slides and powerpoint templates have been carefully created by our professional team to help you impress your audience. Each graphic in every powerpoint slide is vector based and is 100% editable in powerpoint. Each and every property of any slide - color, size, shading etc can be modified to build an effective powerpoint presentation. Use these slides to convey complex business concepts in a simplified manner. Any text can be entered at any point in the powerpoint slide. Simply DOWNLOAD, TYPE and PRESENT!
-
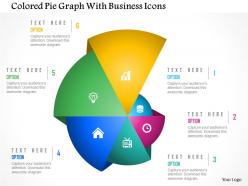 Colored pie graph with business icons powerpoint template
We are proud to present our colored pie graph with business icons powerpoint template. Graphic of colored pie graph and icons has been used to craft this PPT diagram. This PPT diagram contains the concept of business informationand result analysis . Use this PPT diagram for business and marketing presentations.
-
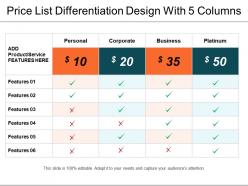 Price list differentiation design with 5 columns
Presenting price list differentiation design with 5 columns. This is a price list differentiation design with 5 columns. This is a four stage process. The stages in this process are price list table with 4 boxes, price list differentiation design with 5 columns, price list diversification table with 4 columns, service price list with service type and 4 columns.
-
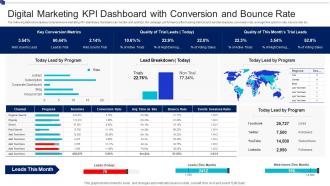 Digital Marketing KPI Dashboard With Conversion And Bounce Rate
The following slide showcases a comprehensive marketing KPI dashboard. Marketers can monitor and optimize the campaign performance after tracking metrics such as total sessions, conversion rate, average time spent on site, bounce rate etc. Presenting our well structured Digital Marketing KPI Dashboard With Conversion And Bounce Rate. The topics discussed in this slide are Today Lead By Program, Lead Breakdown, Today Lead By Program. This is an instantly available PowerPoint presentation that can be edited conveniently. Download it right away and captivate your audience.
-
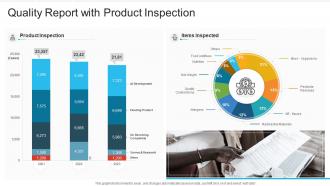 Quality Report With Product Inspection
This graph or chart is linked to excel, and changes automatically based on data. Just left click on it and select edit data. Introducing our Quality Report With Product Inspection set of slides. The topics discussed in these slides are Product Inspection, Items Inspected, Food Additives, Micro Organisms, Pesticide Residues, Radioactive Materials. This is an immediately available PowerPoint presentation that can be conveniently customized. Download it and convince your audience.
-
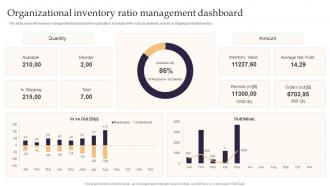 Organizational Inventory Ratio Management Dashboard
This slide shows the inventory management dashboard of an organization. It includes KPIs such as available, reorder, in shipping and total inventory. Introducing our Organizational Inventory Ratio Management Dashboard set of slides. The topics discussed in these slides are Organizational, Inventory, Ratio Management, Dashboard. This is an immediately available PowerPoint presentation that can be conveniently customized. Download it and convince your audience.
-
 Cost Management Dashboard Snapshot Cloud Complexity Challenges And Solution
This slide covers dashboard platform for the resource organization, resource security, auditing, and cost. It also includes reporting, dashboards, budgets, optimizations, etc. Deliver an outstanding presentation on the topic using this Cost Management Dashboard Cloud Complexity Challenges And Solution. Dispense information and present a thorough explanation of Entity Summary, Potential Savings, Cost By Service using the slides given. This template can be altered and personalized to fit your needs. It is also available for immediate download. So grab it now.
-
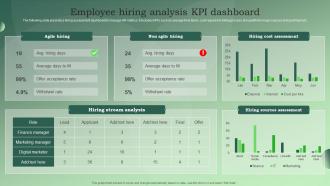 Employee Hiring Analysis KPI Dashboard
The following slide presents a hiring assessment dashboard to manage HR metrics. It includes KPIs such as average time taken, cost required in hiring process along with the major sources of recruitment etc. Introducing our Employee Hiring Analysis KPI Dashboard set of slides. The topics discussed in these slides are Agile Hiring, Non Agile Hiring, Hiring Cost Assessment. This is an immediately available PowerPoint presentation that can be conveniently customized. Download it and convince your audience.
-
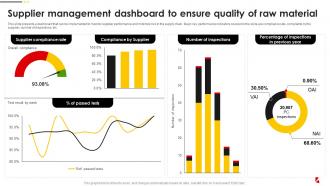 Supplier Management Dashboard To Ensure Food Quality And Safety Management Guide
This slide presents a dashboard that can be implemented to monitor supplier performance and minimize risk in the supply chain. Major key performance indicators covered in the slide are compliance rate, complaints by the supplier, number of inspections, etc. Deliver an outstanding presentation on the topic using this Supplier Management Dashboard To Ensure Food Quality And Safety Management Guide. Dispense information and present a thorough explanation of Ensure, Quality, Material using the slides given. This template can be altered and personalized to fit your needs. It is also available for immediate download. So grab it now.
-
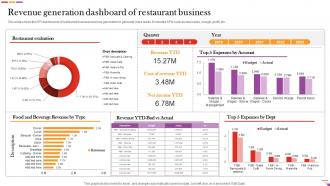 Revenue Generation Dashboard Of Restaurant Business Digital And Offline Restaurant
This slide shows the KPI dashboards of restaurant business revenue generation to generate more leads. It includes KPIs such as total sales, margin ,profit, etc. Present the topic in a bit more detail with this Revenue Generation Dashboard Of Restaurant Business Digital And Offline Restaurant Use it as a tool for discussion and navigation on Restaurant Evaluation, Revenue, Restaurant Business This template is free to edit as deemed fit for your organization. Therefore download it now.
-
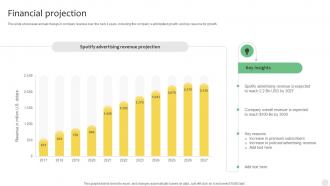 Financial Projection Digital Music Platform Business Model
This slide showcases annual change in company revenue over the next 4 years, including the companys anticipated growth, and key reasons for growth. Present the topic in a bit more detail with this Financial Projection Digital Music Platform Business Model Use it as a tool for discussion and navigation on Spotify Advertising, Revenue Projection This template is free to edit as deemed fit for your organization. Therefore download it now.
-
 Guide Of Industrial Digital Transformation KPI Dashboard To Assess Sales Performance
This slide covers KPI dashboard to analyze sales performance of retail store. It involves details such as total sales revenue, number of customers, average transaction price and average unit per customer. Present the topic in a bit more detail with this Guide Of Industrial Digital Transformation KPI Dashboard To Assess Sales Performance. Use it as a tool for discussion and navigation on KPI Dashboard, Assess Sales Performance, Transaction Price, Sales Revenue. This template is free to edit as deemed fit for your organization. Therefore download it now.
-
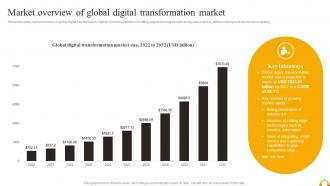 Guide Of Industrial Digital Transformation Market Overview Of Global Digital Transformation Market
This slide covers market overview of global digital transformation market. It involves evolution of cutting edge technologies such as big data analytics, artificial intelligence and cloud computing. Deliver an outstanding presentation on the topic using this Guide Of Industrial Digital Transformation Market Overview Of Global Digital Transformation Market. Dispense information and present a thorough explanation of Market Overview, Global Digital Transformation Market, Artificial Intelligence, Cloud Computing using the slides given. This template can be altered and personalized to fit your needs. It is also available for immediate download. So grab it now.
-
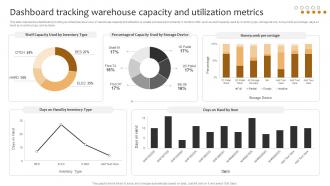 Dashboard Tracking Warehouse Capacity And Utilization Implementing Cost Effective Warehouse Stock
This slide represents a dashboard providing an enterprise-level view of warehouse capacity and utilization to enable process improvements. It monitors KPIs such as shelf capacity used by inventory type, storage device, honeycomb percentage, days on hand by inventory type, and by items. Present the topic in a bit more detail with this Dashboard Tracking Warehouse Capacity And Utilization Implementing Cost Effective Warehouse Stock. Use it as a tool for discussion and navigation on Dashboard Tracking Warehouse, Capacity And Utilization. This template is free to edit as deemed fit for your organization. Therefore download it now.
-
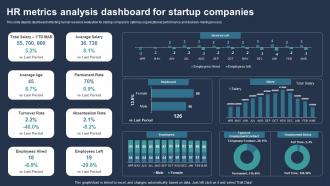 HR Metrics Analysis Dashboard For Startup Companies
This slide depicts dashboard reflecting human resource evaluation for startup company to optimize organizational performance and decision making process. Presenting our well structured HR Metrics Analysis Dashboard For Startup Companies. The topics discussed in this slide are Average Age, Permanent Rate, Absenteeism Rate, Turnover Rate. This is an instantly available PowerPoint presentation that can be edited conveniently. Download it right away and captivate your audience.
-
 Inventory Audit Dashboard For Analyzing Supplier Performance
This slide illustrates KPI or dashboard of inventory audit and includes metrics preceding month until stock outage, inventory check, in stock, returns, etc. Presenting our well structured Inventory Audit Dashboard For Analyzing Supplier Performance. The topics discussed in this slide are Inventory Check, In Stock, Monthly Return Rate. This is an instantly available PowerPoint presentation that can be edited conveniently. Download it right away and captivate your audience.
-
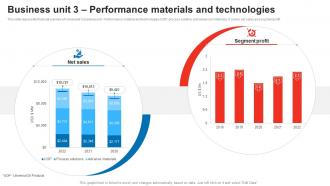 Business Unit 3 Performance Materials And Technologies Honeywell Company Profile CP SS
This slide represents financial overview of Honeywells business unit Performance material and technologies UOP, process solution, and advanced materials. It covers net sales and segment profit. Deliver an outstanding presentation on the topic using this Business Unit 3 Performance Materials And Technologies Honeywell Company Profile CP SS Dispense information and present a thorough explanation of Net Sales, Segment Profit using the slides given. This template can be altered and personalized to fit your needs. It is also available for immediate download. So grab it now.
-
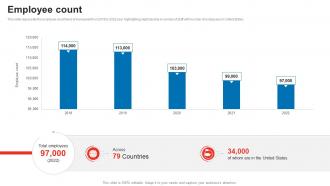 Employee Count Honeywell Company Profile CP SS
This slide represents the employee count trend of Honeywell from 2018 to 2022 year highlighting slight decline in number of staff with number of employees in United States. Present the topic in a bit more detail with this Employee Count Honeywell Company Profile CP SS. Use it as a tool for discussion and navigation on Social, Environment, Governance. This template is free to edit as deemed fit for your organization. Therefore download it now.
-
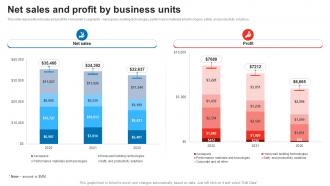 Net Sales And Profit By Business Units Honeywell Company Profile CP SS
This slide represents net sales and profit for Honeywells segments Aerospace, building technologies, performance materials And technologies, safety, and productivity solutions. Present the topic in a bit more detail with this Net Sales And Profit By Business Units Honeywell Company Profile CP SS Use it as a tool for discussion and navigation on Net Sales, Profit This template is free to edit as deemed fit for your organization. Therefore download it now.
-
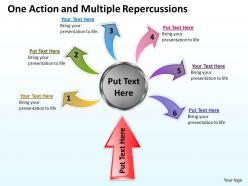 One action and multiple repercussions powerpoint slides presentation diagrams templates
We are proud to present our one action and multiple repercussions powerpoint slides presentation diagrams templates. Create visually stunning and define your PPT Presentations in a unique and inspiring manner using our above template. One action leads to multiple effects. It graphically illustrates the relationship between a given outcome and all the factors that influence the outcome. Use them to help you organise the logic of your views.


