Finance PowerPoint Templates, Presentation Slide Diagrams & PPT Graphics
- Sub Categories
-
- 30 60 90 Day Plan
- Advertising
- Agile Development
- Aims and Objectives
- Arrows
- Before and After
- Blockchain Bitcoin
- Boxes
- Business
- Calender
- Case Study
- Celebrations
- Certificates
- Challenges Opportunities
- Channel Distribution
- Children
- Communication
- Competitive Landscape
- Computer
- Concepts
- Construction Management
- Corporate
- Crowdfunding
- Current State Future State
- Custom PowerPoint Diagrams
- Digital Transformation
- Dos and Donts
- Economics
- Education
- Environment
- Events
- Festival
- Finance
- Financials
- Food
- Game
- Gap Analysis
- Generic
- Geographical
- Health
- Heatmaps
- Holidays
- Icons
- Input Process Output
- Internet
- Key Messages
- Key Wins
- Ladder
- Leadership
- Lists
- Lucky Draw
- Management
- Marketing
- Measuring
- Medical
- Music
- News
- Next Steps
- People Process Technology
- Pillars
- Planning
- Post-it-Notes
- Problem Statement
- Process
- Proposal Management
- Pros and Cons
- Puzzle
- Puzzles
- Recruitment Strategy
- Religion
- Research and Development
- Risk Mitigation Strategies
- Roadmap
- Selling
- Shapes
- Short Term Long Term
- Social
- Stairs
- Start Stop Continue
- Strategy
- Symbol
- Technology
- Thesis Defense Dissertation
- Timelines
- Traffic
- Transition Plan
- Transportation
- Vehicles
- Venture Capital Funding
- Warning
- Winners
- Word Cloud
-
 Four puzzles with idea bar graph team management icons flat powerpoint design
Widescreen presentation visuals do not pixelate. All the elements of the slide background can be tailored to individual need. The presentation template can be incorporated in any of the desired format (JPEG/PDF). Guidance for editing of the PPT visual diagram is provided for assistance. Easy to edit and customize PPT graphics. Compatible with all software and can be saved in any format (JPEG/JPG/PDF). Useful tool for students, business analysts and professionals of any and every industry.
-
 Cash icon showing money bills with coins and dollar signs
Presenting this set of slides with name - Cash Icon Showing Money Bills With Coins And Dollar Signs. This is a four stage process. The stages in this process are Cash Icon, Money Icon, Income Icon.
-
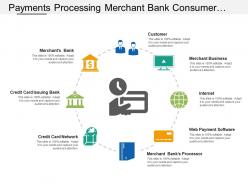 Payments processing merchant bank consumer internet network
Presenting this set of slides with name - Payments Processing Merchant Bank Consumer Internet Network. This is a eight stage process. The stages in this process are Payment Processing, Instalment Processing, Premium Processing.
-
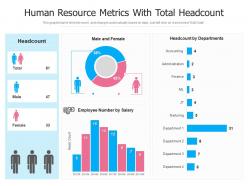 Human resource metrics with total headcount
Presenting our well-structured Human Resource Metrics With Total Headcount. The topics discussed in this slide are Human Resource Metrics With Total Headcount. This is an instantly available PowerPoint presentation that can be edited conveniently. Download it right away and captivate your audience.
-
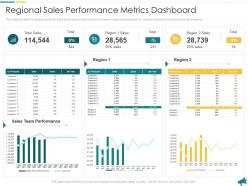 Regional sales performance metrics dashboard approach for local economic development planning
This slide provides the glimpse about the sales performance metrics which focuses on regional sales based on customer demands and sales team performance. Deliver an outstanding presentation on the topic using this Regional Sales Performance Metrics Dashboard Approach For Local Economic Development Planning. Dispense information and present a thorough explanation of Regional Sales Performance Metrics Dashboard using the slides given. This template can be altered and personalized to fit your needs. It is also available for immediate download. So grab it now.
-
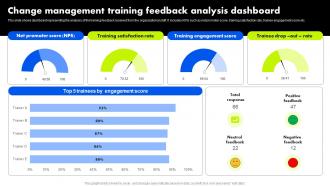 Change Management Training Feedback Analysis Dashboard Organizational Change Management
This slide shows dashboard representing the analysis of the training feedback received from the organizational staff. It includes KPIs such as net promoter score, training satisfaction rate, trainee engagement score etc. Present the topic in a bit more detail with this Change Management Training Feedback Analysis Dashboard Organizational Change Management. Use it as a tool for discussion and navigation on Change Management, Training Feedback, Analysis Dashboard. This template is free to edit as deemed fit for your organization. Therefore download it now.
-
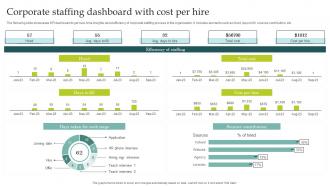 Corporate Staffing Dashboard With Cost Per Hire
The following slide showcases KPI dashboard to get real time insights about efficiency of corporate staffing process in the organization. It includes elements such as hired, days to fill, sources contribution, etc. Introducing our Corporate Staffing Dashboard With Cost Per Hire set of slides. The topics discussed in these slides are Cost, Dashboard, Staffing. This is an immediately available PowerPoint presentation that can be conveniently customized. Download it and convince your audience.
-
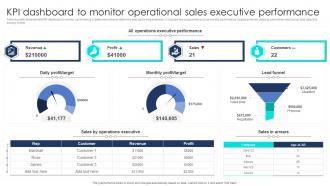 KPI Dashboard To Monitor Operational Sales Executive Performance
Following slide demonstrates KPI dashboard to monitor performance of sales executives to determine best performing employee. It includes key components such as monthly performance, targets achieved, sales by executives, lead funnel, total daily and monthly profits. Introducing our KPI Dashboard To Monitor Operational Sales Executive Performance set of slides. The topics discussed in these slides are Operational, Sales, Performance. This is an immediately available PowerPoint presentation that can be conveniently customized. Download it and convince your audience.
-
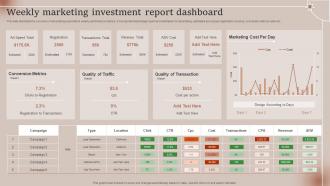 Weekly Marketing Investment Report Dashboard
This slide illustrates the overview of advertising expenditure weekly performance metrics. It incorporate total budget spent and estimated for advertising, estimated and actual registration,revenue, conversion metrics rates etc. Introducing our Weekly Marketing Investment Report Dashboard set of slides. The topics discussed in these slides are Ad Spend Total, Transactions Total This is an immediately available PowerPoint presentation that can be conveniently customized. Download it and convince your audience.
-
 Business puzzle graph powerpoint templates ppt presentation slides 0812
This PowerPoint slide shows 3 puzzles diagram. There is a lot of space available for writing your text. You can easily edit the size, position, text, color.
-
 0414 business consulting diagram layout of info graphic advertising powerpoint slide template
We are proud to present our 0414 business consulting diagram layout of info graphic advertising powerpoint slide template. Our 0414 Business consulting diagram Layout Of Info Graphic Advertising PowerPoint slide template Powerpoint Templates are the strands of your mental loom. Weave them together and produce a magical tapestry. Our Business Powerpoint Templates provide windows to your brilliant mind. Open them to your audience and impress them with your knowledge.
-
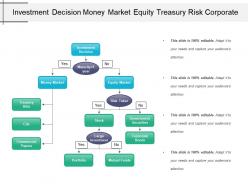 Investment decision money market equity treasury risk corporate
Presenting this set of slides with name - Investment Decision Money Market Equity Treasury Risk Corporate. This is a four stage process. The stages in this process are Investment Decision, Investment Analysis, Financial Management.
-
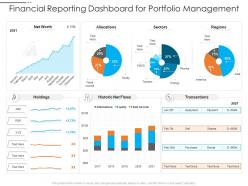 Financial reporting dashboard for portfolio management
Presenting our well-structured Financial Reporting Dashboard For Portfolio Management. The topics discussed in this slide are Allocations, Regions, Transactions. This is an instantly available PowerPoint presentation that can be edited conveniently. Download it right away and captivate your audience.
-
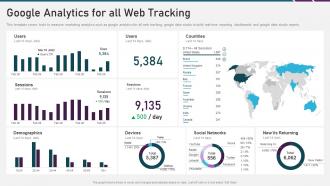 Digital marketing playbook google analytics for all web tracking
This template covers tools to measure marketing analytics such as google analytics for all web tracking, google data studio to build real time reporting dashboards and google data studio reports. Present the topic in a bit more detail with this Digital Marketing Playbook Google Analytics For All Web Tracking. Use it as a tool for discussion and navigation on Demographics, Social Networks, New Vs Returning, Devices. This template is free to edit as deemed fit for your organization. Therefore download it now.
-
 Healthcare Big Data Assessment Dashboard Snapshot
This slide displays the data of healthcare sector showing the total number of patients in the hospital, average treatment cost and waiting time. It also shows the outpatient and impatient trends. Introducing our Healthcare Big Data Assessment Dashboard Snapshot set of slides. The topics discussed in these slides are Total Patients, Total Admission, Avg Treatment Costs. This is an immediately available PowerPoint presentation that can be conveniently customized. Download it and convince your audience.
-
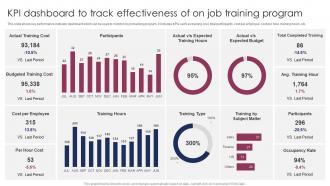 KPI Dashboard To Track Effectiveness Of On Job Training Program
This slide shows key performance indicator dashboard which can be used to monitor on job training program. It includes KPIs such as training cost, total participants, cost per employee, cost per hour, training hours, etc. Presenting our well structured KPI Dashboard To Track Effectiveness Of On Job Training Program. The topics discussed in this slide are Actual Training Cost, Budgeted Training Cost, Cost Per Employee. This is an instantly available PowerPoint presentation that can be edited conveniently. Download it right away and captivate your audience.
-
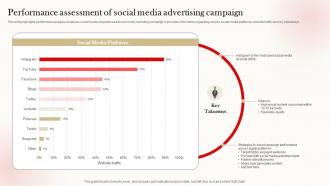 Performance Assessment Of Social Media Advertising Campaign
This slide highlights performance analysis of various social media channels used to promote marketing campaign. It provides information regarding various social media platforms, website traffic and key takeaways. Introducing our Performance Assessment Of Social Media Advertising Campaign set of slides. The topics discussed in these slides are Performance, Assessment, Media. This is an immediately available PowerPoint presentation that can be conveniently customized. Download it and convince your audience.
-
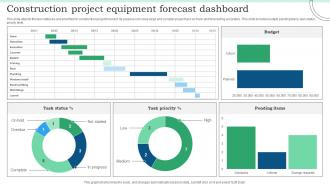 Construction Project Equipment Forecast Dashboard
This slide depicts the task statuses and priorities for construction project forecast. Its purpose is to keep large and complex project task on track and forecasting accurately. This slide includes budget, pending tasks, task status, priority level. Presenting our well structured Construction Project Equipment Forecast Dashboard. The topics discussed in this slide are Task Status, Pending Items. This is an instantly available PowerPoint presentation that can be edited conveniently. Download it right away and captivate your audience.
-
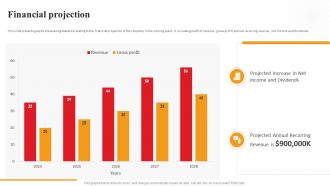 Financial Projection Arcus Investor Funding Elevator Pitch Deck
This slide presents graphs showcasing statistics relating to the financial projection of the company in the coming years. It includes growth of revenue, gross profit, annual recurring revenue, net income and dividends. Present the topic in a bit more detail with this Financial Projection Arcus Investor Funding Elevator Pitch Deck. Use it as a tool for discussion and navigation on Financial Projection, Growth Of Revenue, Gross Profit, Annual Recurring Revenue. This template is free to edit as deemed fit for your organization. Therefore download it now.
-
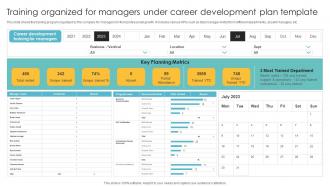 Training Organized For Managers Under Career Development Plan Template
This slide shows the training program organized by the company for managers for their professional growth. It includes various KPIs such as total manager invited from different departments, absent managers, etc. Introducing our Training Organized For Managers Under Career Development Plan Template set of slides. The topics discussed in these slides are Key Planning Metrics, Most Trained Department, Training For Managers. This is an immediately available PowerPoint presentation that can be conveniently customized. Download it and convince your audience.
-
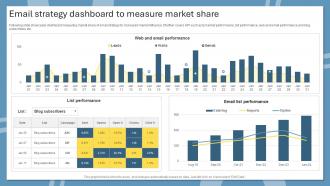 Email Strategy Dashboard To Measure Market Share
Following slide showcases dashboard measuring market share of email strategy for increased market influence. It further covers KPI such as Email list performance, list performance, web and email performance and blog subscribers, etc. Introducing our Email Strategy Dashboard To Measure Market Share set of slides. The topics discussed in these slides are People, Content, Strategies. This is an immediately available PowerPoint presentation that can be conveniently customized. Download it and convince your audience.
-
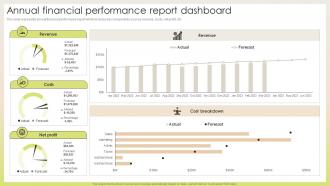 Annual Financial Performance Report Dashboard
This slide represents annual financial performance report which includes key components such as revenue, costs, net profit, etc Introducing our Annual Financial Performance Report Dashboard set of slides. The topics discussed in these slides are Revenue, Costs, Net Profit. This is an immediately available PowerPoint presentation that can be conveniently customized. Download it and convince your audience.
-
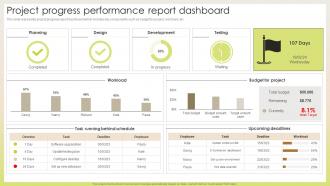 Project Progress Performance Report Dashboard
This slide represents project progress report dashboard which includes key components such as budget for project, workload, etc Presenting our well structured Project Progress Performance Report Dashboard. The topics discussed in this slide are Planning, Design, Development. This is an instantly available PowerPoint presentation that can be edited conveniently. Download it right away and captivate your audience.
-
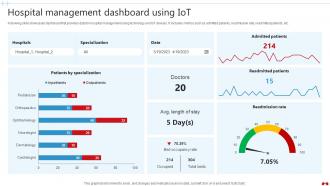 Hospital Management Dashboard Using Transforming Healthcare Industry Through Technology IoT SS V
Following slide showcases dashboard that provides data for hospital management using technology and IoT devices. It includes metrics such as admitted patients, readmission rate, readmitted patients, etc. Present the topic in a bit more detail with this Hospital Management Dashboard Using Transforming Healthcare Industry Through Technology IoT SS V. Use it as a tool for discussion and navigation on Admitted Patients, Readmitted Patients, Readmission Rate. This template is free to edit as deemed fit for your organization. Therefore download it now.
-
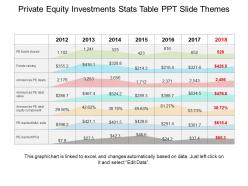 Private equity investments stats table ppt slide themes
Presenting private equity investments stats table ppt slide themes. This is a private equity investments stats table ppt slide themes. This is a seven stage process. The stages in this process are investment, venture capital, funding, private equity.
-
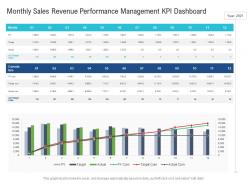 Monthly sales revenue performance management kpi dashboard
Presenting our well-structured Monthly Sales Revenue Performance Management KPI Dashboard. The topics discussed in this slide are Monthly Sales Revenue Performance Management KPI Dashboard. This is an instantly available PowerPoint presentation that can be edited conveniently. Download it right away and captivate your audience.
-
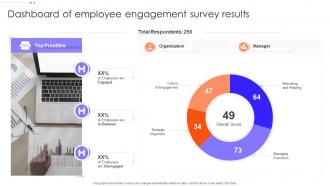 Dashboard Of Employee Engagement Survey Results
This graph or chart is linked to excel, and changes automatically based on data. Just left click on it and select Edit Data. Introducing our Dashboard Of Employee Engagement Survey Results set of slides. The topics discussed in these slides are Organization, Motivating And Relating, Managing Execution, Strategic Alignment. This is an immediately available PowerPoint presentation that can be conveniently customized. Download it and convince your audience.
-
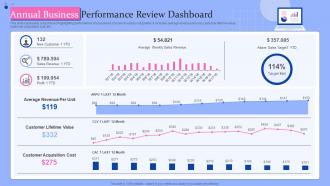 Annual Business Performance Review Dashboard
This slide represents a dashboard highlighting performance of a business concern in various segments. It includes average revenue per unit, customer lifetime value, customer acquisition cost, etc. Introducing our Annual Business Performance Review Dashboard set of slides. The topics discussed in these slides are Annual, Business Performance Review, Dashboard. This is an immediately available PowerPoint presentation that can be conveniently customized. Download it and convince your audience.
-
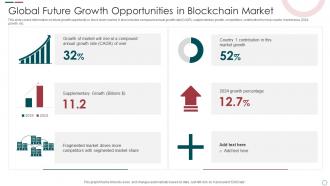 Global Future Growth Opportunities In Blockchain Market
This slide covers information on future growth opportunity in block chain market. It also includes compound annual growth rate CAGR, supplementary growth, competitors, contribution from top country market area, 2024 growth, etc. Presenting our set of slides with name Global Future Growth Opportunities In Blockchain Market. This exhibits information on six stages of the process. This is an easy-to-edit and innovatively designed PowerPoint template. So download immediately and highlight information on Global Future Growth, Opportunities, Blockchain Market.
-
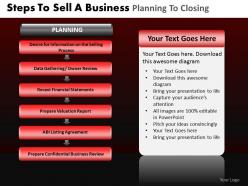 Steps to sell a business planning to closing powerpoint slides and ppt templates db
These high quality, editable pre-designed powerpoint slides and powerpoint templates have been carefully created by our professional team to help you impress your audience. Each graphic in every powerpoint slide is vector based and is 100% editable in powerpoint.Each and every property of any slide - color, size, shading etc can be modified to build an effective powerpoint presentation. Use these slides to convey complex business concepts in a simplified manner. Any text can be entered at any point in the powerpoint slide. Simply DOWNLOAD, TYPE and PRESENT
-
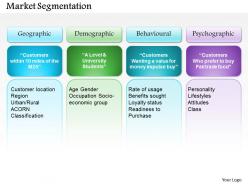 0514 market segmentation powerpoint presentation
PowerPoint background accessible in standard and widescreen view. Modifiable images, icons, colors, text and layout. Creatively designed Presentation visual with great image quality. Selection of addition of crest and picture to customize as per the industry need. PPT diagram can be downloaded and save into JPG and PDF format. Wholly adaptable PPT slides with Google slides. Easy to modify and present as per your requirement.
-
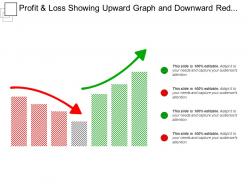 Profit and loss showing upward graph and downward red graph
Presenting this set of slides with name - Profit And Loss Showing Upward Graph And Downward Red Graph. This is a two stage process. The stages in this process are Profit And Loss, Benefit And Loss, Income Statement, Balance Sheet.
-
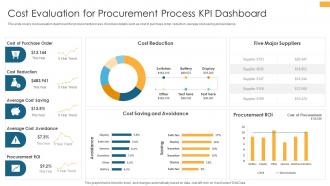 Cost Evaluation For Procurement Process KPI Dashboard
This slide covers cost evaluation dashboard for procurement process. It involves details such as cost of purchase order, reduction, average cost saving and avoidance. Presenting our well structured Cost Evaluation For Procurement Process KPI Dashboard. The topics discussed in this slide are Cost Reduction, Five Major Suppliers, Procurement ROI. This is an instantly available PowerPoint presentation that can be edited conveniently. Download it right away and captivate your audience.
-
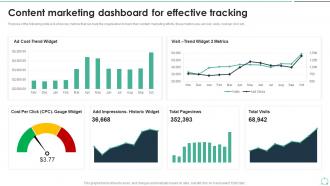 Content Marketing Dashboard Snapshot For Effective Tracking
Purpose of the following slide is to show key metrics that can help the organization to track their content marketing efforts, these metrics are ad cost, visits, cost per click etc. Present the topic in a bit more detail with this Content Marketing Dashboard Snapshot For Effective Tracking. Use it as a tool for discussion and navigation on Gauge Widget, Effective Tracking, Marketing Dashboard. This template is free to edit as deemed fit for your organization. Therefore download it now.
-
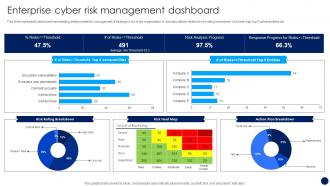 Enterprise Cyber Risk Management Dashboard Risk Management And Mitigation Strategy
This slide represents dashboard representing details related to management of strategic risks in the organization. It includes details related to risk rating breakdown, risk heat map, top 5 vulnerabilities etc. Deliver an outstanding presentation on the topic using this Enterprise Cyber Risk Management Dashboard Risk Management And Mitigation Strategy. Dispense information and present a thorough explanation of Risk Rating, Risk Heat Map, Action Plan Breakdown using the slides given. This template can be altered and personalized to fit your needs. It is also available for immediate download. So grab it now.
-
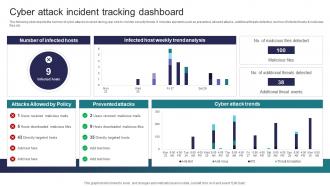 Cyber Attack Incident Tracking Dashboard Implementing Strategies To Mitigate Cyber Security Threats
The following slide depicts the number of cyber attacks incurred during year end to monitor security trends. It includes elements such as prevented, allowed attacks, additional threats detected, number of infected hosts and malicious files etc. Present the topic in a bit more detail with this Cyber Attack Incident Tracking Dashboard Implementing Strategies To Mitigate Cyber Security Threats Use it as a tool for discussion and navigation on Prevented Attacks, Cyber Attack Trends This template is free to edit as deemed fit for your organization. Therefore download it now.
-
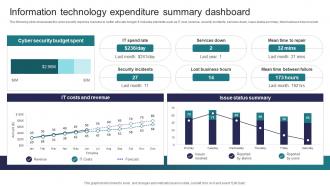 Information Technology Expenditure Summary Implementing Strategies To Mitigate Cyber Security Threats
The following slide showcases the cyber security expense overview to better allocate budget. It includes elements such as IT cost, revenue, security incidents, services down, issue status summary, total business hours lost etc. Deliver an outstanding presentation on the topic using this Information Technology Expenditure Summary Implementing Strategies To Mitigate Cyber Security Threats Dispense information and present a thorough explanation of Cyber Security Budget Spent, It Costs And Revenue, Issue Status Summary using the slides given. This template can be altered and personalized to fit your needs. It is also available for immediate download. So grab it now.
-
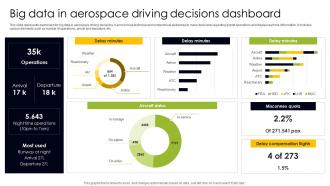 Big Data In Aerospace Driving Decisions Dashboard
This slide represents dashboard for big data in aerospace driving decisions. It aims to help technical and nontechnical audiences to make decisions regarding airport operations and display real time information. It includes various elements such as number of operations, arrival and departure, etc. Introducing our Big Data In Aerospace Driving Decisions Dashboard set of slides. The topics discussed in these slides are Delay Minutes, Aircraft Status, Misconnex Quota. This is an immediately available PowerPoint presentation that can be conveniently customized. Download it and convince your audience.
-
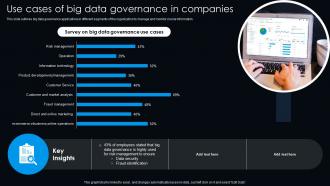 Use Cases Of Big Data Governance In Companies
This slide outlines big data governance applications in different segments of the organization to manage and monitor crucial information. Presenting our well structured Use Cases Of Big Data Governance In Companies. The topics discussed in this slide are Survey On Big Data, Governance Use Cases. This is an instantly available PowerPoint presentation that can be edited conveniently. Download it right away and captivate your audience.
-
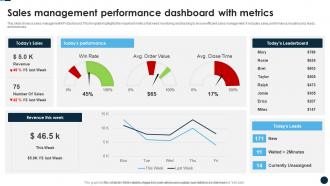 Sales Management Performance Dashboard With Metrics
This slide shows a sales management KPI dashboard. This template highlights the important metrics that need monitoring and tracking to ensure efficient sales management. It includes sales, performance, leaderboard, leads, and revenues. Presenting our well structured Sales Management Performance Dashboard With Metrics. The topics discussed in this slide are Revenue This Week, Todays Performance, Todays Leaderboard. This is an instantly available PowerPoint presentation that can be edited conveniently. Download it right away and captivate your audience.
-
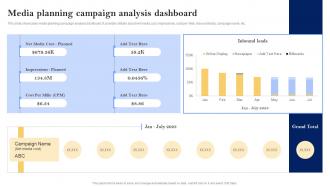 Media Planning Campaign Analysis Media Planning Strategy The Complete Guide Strategy Ss V
This slide showcases media planning campaign analysis dashboard. It provides details about net media cost, impressions, cost per mille, inbound leads, campaign name, etc. Deliver an outstanding presentation on the topic using this Media Planning Campaign Analysis Media Planning Strategy The Complete Guide Strategy Ss V. Dispense information and present a thorough explanation of Media Planning Campaign, Analysis Dashboard using the slides given. This template can be altered and personalized to fit your needs. It is also available for immediate download. So grab it now.
-
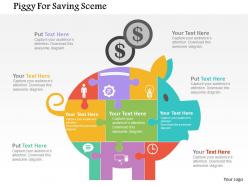 Piggy for saving sceme flat powerpoint design
We are proud to present our piggy for saving sceme flat powerpoint design. Concept of saving scheme and its benefits has been displayed in this PPT diagram. This PPT diagram contains the graphic of piggy. Use this PPT diagram for business and finance related presentations.
-
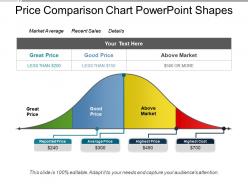 Price comparison chart powerpoint shapes
Presenting price comparison chart PowerPoint shapes PT slide. Professionally equipped and aesthetically designed presentation model. Stunning visuals which do not pixelate when projected on a wide screen. It has impressive content management and is thoroughly editable content. Modify the content with shapes, color, orientation and fonts at your need and comfort. Personalize the presentation with your own company name and logo. PPT is compatible with varied software options and multiple format options. Used by sales managers, entrepreneurs, students, teachers and strategists.
-
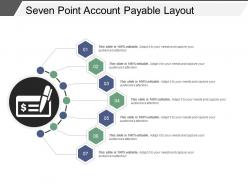 Seven point account payable layout ppt diagrams
Presenting seven point account payable layout PPT diagrams PowerPoint shape which is 100% editable. This PPT slide is easy to customize and enables you to personalize it as per your own criteria. The presentation slide is fully compatible with Google slides, multiple format and software options. In case of any assistance, kindly take instructions from our presentation design services and it is easy to download in a very short span of time. The images, layouts, designs are of high quality and ensures quality in widescreen.
-
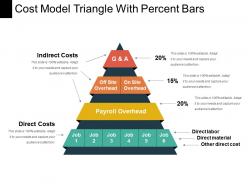 Cost model triangle with percent bars
Presenting cost model triangle with percent bars. This is a cost model triangle with percent bars. This is a four stage process. The stages in this process are cost model, cost framework, price structure.
-
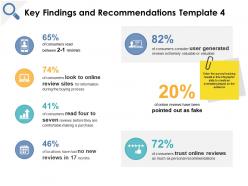 Key findings and recommendations online reviews growth ppt powerpoint presentation file icons
Presenting this set of slides with name Key Findings And Recommendations Online Reviews Growth Ppt Powerpoint Presentation File Icons. This is a six stage process. The stages in this process are Finance, Marketing, Management, Investment, Analysis. This is a completely editable PowerPoint presentation and is available for immediate download. Download now and impress your audience.
-
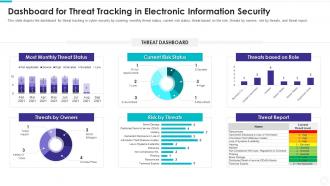 Dashboard snapshot threat tracking electronic information security
This slide depicts the dashboard for threat tracking in cyber security by covering monthly threat status, current risk status, threat based on the role, threats by owners, risk by threats, and threat report. Present the topic in a bit more detail with this Dashboard Snapshot Threat Tracking Electronic Information Security. Use it as a tool for discussion and navigation on Most Monthly Threat Status, Threat Dashboard, Current Risk Status, Threats Based Role, Risk By Threats, Threat Report, Threats Owners. This template is free to edit as deemed fit for your organization. Therefore download it now.
-
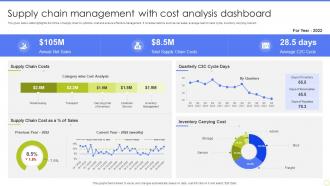 Supply Chain Management With Cost Analysis Dashboard
The given below slide highlights the KPAs of supply chain to optimize cost and ensure effective management. It includes metrics such as net sales, average cash to cash cycle, inventory carrying cost etc. Introducing our Supply Chain Management With Cost Analysis Dashboard set of slides. The topics discussed in these slides are Supply Chain Costs, Inventory Carrying Cost, Average C2C Cycle. This is an immediately available PowerPoint presentation that can be conveniently customized. Download it and convince your audience.
-
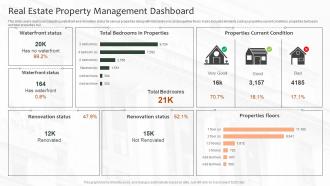 Real Estate Property Management Dashboard
This slide covers dashboard depicting waterfront and renovation status for various properties along with total bedrooms and properties floors. It also included elements such as properties current conditions, properties built years and total properties buil Introducing our Real Estate Property Management Dashboard set of slides. The topics discussed in these slides are Real Estate, Property Management, Dashboard. This is an immediately available PowerPoint presentation that can be conveniently customized. Download it and convince your audience.
-
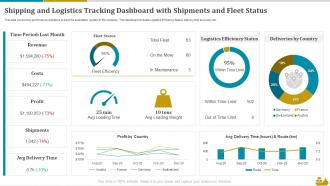 Shipping And Logistics Tracking Dashboard With Shipments And Fleet Status
This slide covers Key performance indicators to track the automation system of the company. This dashboard includes Logistics Efficiency Status, delivery time accuracy etc. Present the topic in a bit more detail with this Shipping And Logistics Tracking Dashboard With Shipments And Fleet Status. Use it as a tool for discussion and navigation on Shipping And Logistics, Tracking Dashboard, Shipments And Fleet Status. This template is free to edit as deemed fit for your organization. Therefore download it now.
-
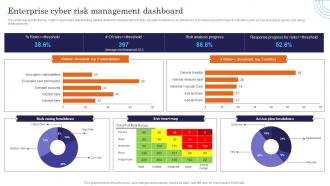 Enterprise Cyber Risk Management Dashboard Incident Response Strategies Deployment
This slide represents the key metrics dashboard representing details related to management of cyber security incidents by an enterprise. It includes key performance indicators such as risk analysis progress, risk rating breakdown etc. Present the topic in a bit more detail with this Enterprise Cyber Risk Management Dashboard Incident Response Strategies Deployment. Use it as a tool for discussion and navigation on Rating, Management, Enterprise. This template is free to edit as deemed fit for your organization. Therefore download it now.
-
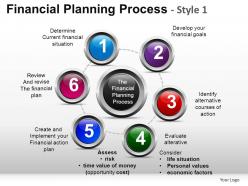 Financial planning process 1 powerpoint presentation slides
These high quality, editable pre-designed powerpoint slides and powerpoint templates have been carefully created by our professional team to help you impress your audience. Each graphic in every powerpoint slide is vector based and is 100% editable in powerpoint. Each and every property of any slide - color, size, shading etc can be modified to build an effective powerpoint presentation. Use these slides to convey complex business concepts in a simplified manner. Any text can be entered at any point in the powerpoint slide. Simply DOWNLOAD, TYPE and PRESENT!
-
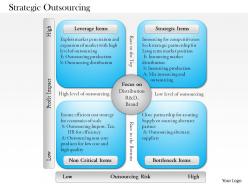 0514 strategic outsourcing powerpoint presentation
Totally adaptable presentation designs as editing option available. Compatible with numerous format options like JPEG, JPG or PDF. Ease of modifying PowerPoint colors, shapes and orientation. Freedom to customize it with company name and logo. Access to inclusion and exclusion of contents as per specific needs of any business. PPT slides are completely compatible with Google slides.
-
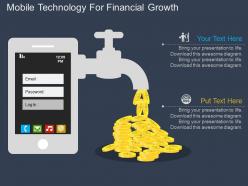 New mobile technology for financial growth flat powerpoint design
Presenting new mobile technology for financial growth flat powerpoint design. This Power Point template diagram has been crafted with graphic of mobile diagram. This PPT diagram contains the concept of financial growth and mobile technology application. Use this PPT diagram for finance and technology related presentations.
-
 Banking product icon with hand and cash
Presenting Banking Product Icon With Hand And Cash. You can modify the color, font, font type, and font size of the slide as per the requirements The template is available in both standard and widescreen aspect ratio. It is compatible with Google Slides, which makes it accessible at once. It can be transformed into various formats like PDF, JPG, and PNG. Get this ready to use slides in just one click.
-
 Stack of coins showing dollar sign
Presenting this set of slides with name - Stack Of Coins Showing Dollar Sign. This is a two stage process. The stages in this process are Coin Icon, Penny Icon, Stack Icon.
-
 Dashboards Snapshot by function marketing performance dashboard
Present the topic in a bit more detail with this Dashboards Snapshot By Function Marketing Performance Dashboard. Use it as a tool for discussion and navigation on Marketing Performance Dashboard. This template is free to edit as deemed fit for your organization. Therefore download it now.
-
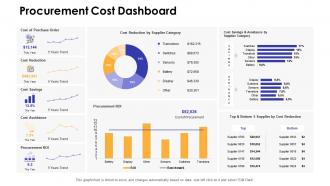 Dashboards snapshot by function procurement cost dashboard
Present the topic in a bit more detail with this Dashboards Snapshot By Function Procurement Cost Dashboard. Use it as a tool for discussion and navigation on Procurement Cost Dashboard. This template is free to edit as deemed fit for your organization. Therefore download it now.
-
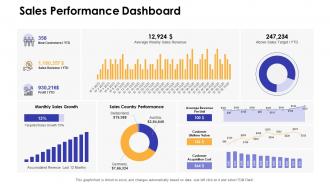 Sales performance dashboard dashboards by function
Deliver an outstanding presentation on the topic using this Sales Performance Dashboard Dashboards By Function. Dispense information and present a thorough explanation of Sales Performance Dashboard using the slides given. This template can be altered and personalized to fit your needs. It is also available for immediate download. So grab it now.
-
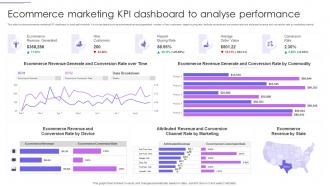 Ecommerce Marketing KPI Dashboard To Analyse Performance
This slide covers ecommerce marketing KPI dashboard to track performance. It involves details such as ecommerce revenue generated, number of new customers, repeat buying rate, attribute revenue and conversion rate and attributed revenue and conversion rate by marketing channel. Introducing our Ecommerce Marketing KPI Dashboard To Analyse Performance set of slides. The topics discussed in these slides are Ecommerce Revenue Generated, New Customers, Average Order Value. This is an immediately available PowerPoint presentation that can be conveniently customized. Download it and convince your audience.


