Finance PowerPoint Templates, Presentation Slide Diagrams & PPT Graphics
- Sub Categories
-
- 30 60 90 Day Plan
- Advertising
- Agile Development
- Aims and Objectives
- Arrows
- Before and After
- Blockchain Bitcoin
- Boxes
- Business
- Calender
- Case Study
- Celebrations
- Certificates
- Challenges Opportunities
- Channel Distribution
- Children
- Communication
- Competitive Landscape
- Computer
- Concepts
- Construction Management
- Corporate
- Crowdfunding
- Current State Future State
- Custom PowerPoint Diagrams
- Digital Transformation
- Dos and Donts
- Economics
- Education
- Environment
- Events
- Festival
- Finance
- Financials
- Food
- Game
- Gap Analysis
- Generic
- Geographical
- Health
- Heatmaps
- Holidays
- Icons
- Input Process Output
- Internet
- Key Messages
- Key Wins
- Ladder
- Leadership
- Lists
- Lucky Draw
- Management
- Marketing
- Measuring
- Medical
- Music
- News
- Next Steps
- People Process Technology
- Pillars
- Planning
- Post-it-Notes
- Problem Statement
- Process
- Proposal Management
- Pros and Cons
- Puzzle
- Puzzles
- Recruitment Strategy
- Religion
- Research and Development
- Risk Mitigation Strategies
- Roadmap
- Selling
- Shapes
- Short Term Long Term
- Social
- Stairs
- Start Stop Continue
- Strategy
- Symbol
- Technology
- Thesis Defense Dissertation
- Timelines
- Traffic
- Transition Plan
- Transportation
- Vehicles
- Venture Capital Funding
- Warning
- Winners
- Word Cloud
-
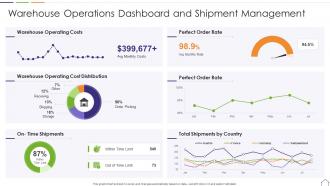 Warehouse Operations Dashboard Snapshot And Shipment Management
This graph or chart is linked to excel, and changes automatically based on data. Just left click on it and select edit data. Introducing our Warehouse Operations Dashboard SnapshoAnd Shipment Management set of slides. The topics discussed in these slides are Warehouse Operating Costs, Perfect Order Rate, Total Shipments By Country, Warehouse Operating, Cost Distribution, On Time Shipments. This is an immediately available PowerPoint presentation that can be conveniently customized. Download it and convince your audience.
-
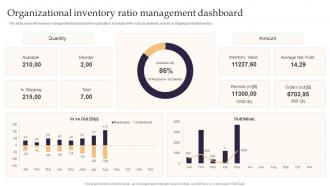 Organizational Inventory Ratio Management Dashboard
This slide shows the inventory management dashboard of an organization. It includes KPIs such as available, reorder, in shipping and total inventory. Introducing our Organizational Inventory Ratio Management Dashboard set of slides. The topics discussed in these slides are Organizational, Inventory, Ratio Management, Dashboard. This is an immediately available PowerPoint presentation that can be conveniently customized. Download it and convince your audience.
-
 Cost Management Dashboard Snapshot Cloud Complexity Challenges And Solution
This slide covers dashboard platform for the resource organization, resource security, auditing, and cost. It also includes reporting, dashboards, budgets, optimizations, etc. Deliver an outstanding presentation on the topic using this Cost Management Dashboard Cloud Complexity Challenges And Solution. Dispense information and present a thorough explanation of Entity Summary, Potential Savings, Cost By Service using the slides given. This template can be altered and personalized to fit your needs. It is also available for immediate download. So grab it now.
-
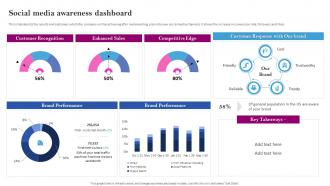 Social Media Branding Social Media Awareness Dashboard
This slide depicts the results and outcomes which the company will be achieving after implementing plan into new social media channels. It shows the increase in conversion rate, followers and likes. Deliver an outstanding presentation on the topic using this Social Media Branding Social Media Awareness Dashboard. Dispense information and present a thorough explanation of Social Media Awareness, Dashboard, Trustworthy, Brand Performance using the slides given. This template can be altered and personalized to fit your needs. It is also available for immediate download. So grab it now.
-
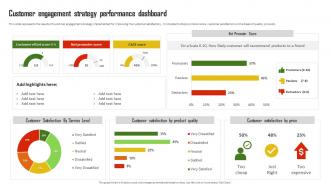 Customer Communication And Engagement Customer Engagement Strategy Performance Dashboard
This slide represents the results of customer engagement strategy implemented for improving the customer satisfaction. It includes the Net promoter score, customer satisfaction on the basis of quality, price etc. Deliver an outstanding presentation on the topic using this Customer Communication And Engagement Customer Engagement Strategy Performance Dashboard. Dispense information and present a thorough explanation of Customer Engagement, Strategy Performance, Dashboard using the slides given. This template can be altered and personalized to fit your needs. It is also available for immediate download. So grab it now.
-
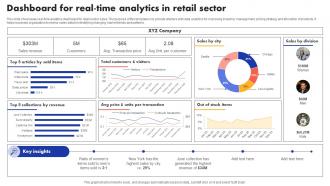 Dashboard For Real Time Analytics In Retail Sector
This slide showcases real-time analytics dashboard for retail sector sales. The purpose of this template is to provide retailers with data analytics for improving inventory management, pricing strategy and allocation of products. It helps business organization to review sales data for identifying changing market trends and patterns. Introducing our Dashboard For Real Time Analytics In Retail Sector set of slides. The topics discussed in these slides are Sold Items, Units Per Transaction. This is an immediately available PowerPoint presentation that can be conveniently customized. Download it and convince your audience.
-
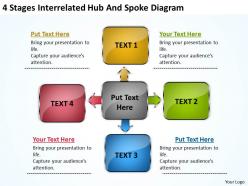 Business processes 4 stages interrelated hub and spoke diagram powerpoint templates
Fine quality of pictures and the graphic icons. All the images are completely editable in PowerPoint slides. Slides attune well with the major Microsoft office and Google slides. Provided instructions to make changes or modify the slide template. Beneficial for the business leaders and the marketing professionals.
-
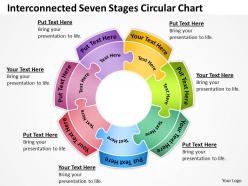 Business process diagram visio seven stages circular chart concept powerpoint templates
We are proud to present our business process diagram visio seven stages circular chart concept powerpoint templates. Use this diagram to represent marketing concepts and strategic components. It features an image of seven stages of circular puzzle diagram. The ideas and plans are on your fingertips. Now imprint them on the minds of your audience via our slides.
-
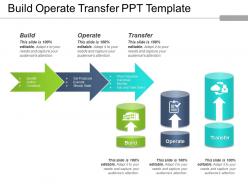 Build operate transfer ppt template
Presenting build, operate and transfer PPT template. The slide is 100% editable. You can modify the text, color, font as per the requirements. The slide is fully compatible with Google Slide. This slide can be viewed both in standard screen size and widescreen size because of its high resolution. The number of fields can be added or deleted as per your requirements. The PPT template can be saved in any format like PDF, JPEG, and PNG.
-
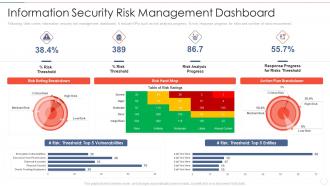 Effective information security information security risk management dashboard
Following slide covers information security risk management dashboard. It include KPIs such as risk analysis progress, percent risk, response progress for risks and number of risks encountered. Deliver an outstanding presentation on the topic using this Effective Information Security Information Security Risk Management Dashboard. Dispense information and present a thorough explanation of Risk Threshold, Risk Analysis, Progress Response, Progress Risks Threshold using the slides given. This template can be altered and personalized to fit your needs. It is also available for immediate download. So grab it now.
-
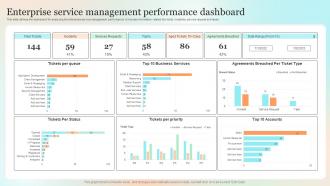 Enterprise Service Management Performance Dashboard
This slide defines the dashboard for analyzing the enterprise service management performance. It includes information related the ticket, incidents, service request and tasks Introducing our Enterprise Service Management Performance Dashboard set of slides. The topics discussed in these slides are Enterprise Service Management, Performance Dashboard. This is an immediately available PowerPoint presentation that can be conveniently customized. Download it and convince your audience.
-
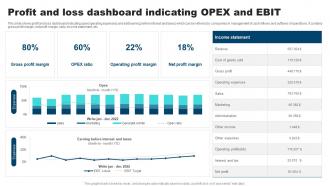 Profit And Loss Dashboard Indicating OPEX And EBIT
This slide shows profit and loss dashboard indicating opex operating expenses and ebit earning before interest and taxes which can be referred by companies in management of cash inflows and outflows of operations. It contains gross profit margin, net profit margin, ratio, income statement, etc. Introducing our Profit And Loss Dashboard Indicating OPEX And EBIT set of slides. The topics discussed in these slides are Profit Loss Dashboard, Indicating OPEX, EBIT. This is an immediately available PowerPoint presentation that can be conveniently customized. Download it and convince your audience.
-
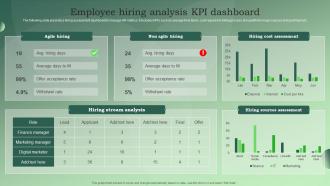 Employee Hiring Analysis KPI Dashboard
The following slide presents a hiring assessment dashboard to manage HR metrics. It includes KPIs such as average time taken, cost required in hiring process along with the major sources of recruitment etc. Introducing our Employee Hiring Analysis KPI Dashboard set of slides. The topics discussed in these slides are Agile Hiring, Non Agile Hiring, Hiring Cost Assessment. This is an immediately available PowerPoint presentation that can be conveniently customized. Download it and convince your audience.
-
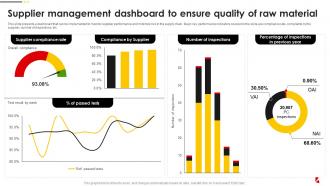 Supplier Management Dashboard To Ensure Food Quality And Safety Management Guide
This slide presents a dashboard that can be implemented to monitor supplier performance and minimize risk in the supply chain. Major key performance indicators covered in the slide are compliance rate, complaints by the supplier, number of inspections, etc. Deliver an outstanding presentation on the topic using this Supplier Management Dashboard To Ensure Food Quality And Safety Management Guide. Dispense information and present a thorough explanation of Ensure, Quality, Material using the slides given. This template can be altered and personalized to fit your needs. It is also available for immediate download. So grab it now.
-
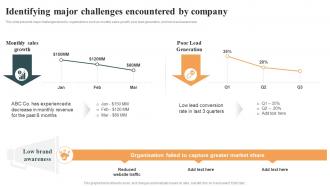 Identifying Major Challenges Optimizing Cold Calling Process To Maximize SA SS
This slide presents major challenges faced by organizations such as monthly sales growth, poor lead generation, and low brand awareness. Deliver an outstanding presentation on the topic using this Identifying Major Challenges Optimizing Cold Calling Process To Maximize SA SS. Dispense information and present a thorough explanation of Decrease, Market, Reduced using the slides given. This template can be altered and personalized to fit your needs. It is also available for immediate download. So grab it now.
-
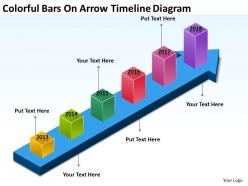 Examples of business processes colorful bars on arrow timeline diagram powerpoint templates
Compatible presentation icon for the Google slides and other offline Microsoft office software. High resolution and pixel friendly images. Instantly downloadable and accessible to be saved in multiple formats. 100% customizable PPT icon. Beneficial for the business managers, sales professionals, accounting professionals and the management individuals.
-
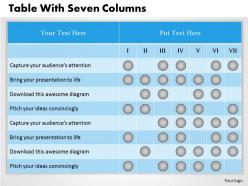 0314 business ppt diagram table with seven columns powerpoint template
Quick and simple steps for straightforward download. Add text to suit the context in any number of words. Insert your logo, brand name, tagline, trademark etc. Alter the orientation and sizes of PPT icons according to requirement. No loss in high resolution of presentation images on editing. Simply convertible into JPG or PDF format and works seamlessly with Google slides.
-
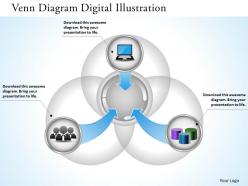 0314 business ppt diagram venn diagram digital illustration powerpoint template
We are proud to present our 0314 business ppt diagram venn diagram digital illustration powerpoint template. You work the stage with an air of royalty. Let our 0314 Business Ppt Diagram Venn Diagram Digital Illustration Powerpoint Template be the jewels in your crown. passion to excel in your field. Our concepts will prove ideal vehicles for your ideas.
-
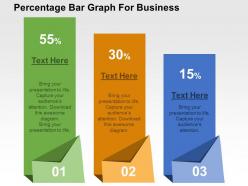 Percentage bar graph for business flat powerpoint design
We are proud to present our percentage bar graph for business flat powerpoint design. This power point template diagram has been crafted with graphic of percentage and bar graph. This PPT diagram contains the concept of financial analysis. Use this PPT diagram for business and finance related presentations.
-
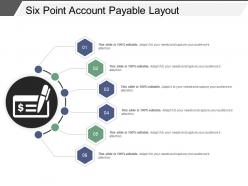 Six point account payable layout ppt samples download
Introducing six point accounts payable PPT layout design. This technical PPT design is quite relevant for the management and finance specialist. Completely modifiable sizes, colors, texts, background images etc. for the Presentation image. Provides an alternate to convert the same into different file formats like PDF or JPG. High quality Presentation graphic provides an impeccable Presentation experience to the audiences. Offers easy downloading process. Suitable and compatible with all Google Slides and operating systems.
-
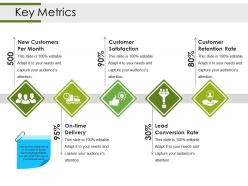 Key metrics powerpoint slide deck template
Presenting key metrics powerpoint slide deck template. This is a key metrics powerpoint slide deck template. This is a five stage process. The stages in this process are new customers per month, customer satisfaction, customer retention rate, on time delivery, lead conversion rate.
-
 Warehouse Inventory Carrying Cost Pie Chart
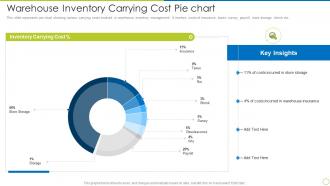
This slide represents pie chart showing various carrying costs involved in warehouse inventory management. It involves costs of insurance, taxes, survey, payroll, store storage, shrink etc. Presenting our well structured Warehouse Inventory Carrying Cost Pie Chart. The topics discussed in this slide are Inventory Carrying Cost, Costs Incurred, Warehouse Insurance. This is an instantly available PowerPoint presentation that can be edited conveniently. Download it right away and captivate your audience.
-
 Project Costs Dashboard Snapshot With Employee Workload
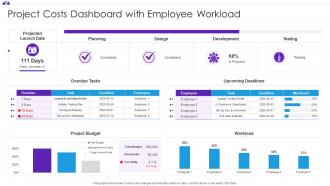
This graph or chart is linked to excel, and changes automatically based on data. Just left click on it and select Edit Data. Presenting our well structured Project Costs Dashboard Snapshot With Employee Workload. The topics discussed in this slide are Upcoming Deadlines, Overdue Tasks, Project Budget. This is an instantly available PowerPoint presentation that can be edited conveniently. Download it right away and captivate your audience.
-
 Employee Onboarding Process KPI Tracking Dashboard
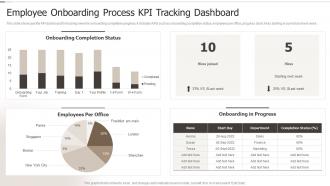
This slide showcase the KPI dashboard for tracking new hire onboarding completion progress. It includes KPIs such as onboarding completion status, employees per office, progress chart, hires starting in current and next week. Introducing our Employee Onboarding Process KPI Tracking Dashboard set of slides. The topics discussed in these slides are Onboarding Completion Status, Employees Per Office, Onboarding In Progress. This is an immediately available PowerPoint presentation that can be conveniently customized. Download it and convince your audience.
-
 CIO Dashboard To Track Essential Activities Associated With It Essential CIOs Initiatives For It Cost
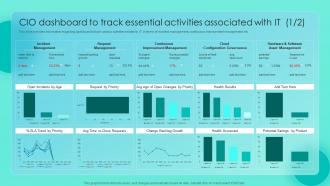
This slide provides information regarding dashboard to track various activities related to IT in terms of incident management, continuous improvement management, etc. Present the topic in a bit more detail with this CIO Dashboard To Track Essential Activities Associated With It Essential CIOs Initiatives For It Cost. Use it as a tool for discussion and navigation on Incident Management, Request Management, Cloud Configuration Governance. This template is free to edit as deemed fit for your organization. Therefore download it now.
-
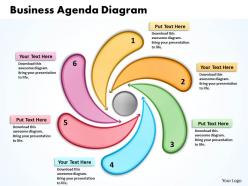 Business agenda diagram powerpoint slides presentation diagrams templates
We are proud to present our business agenda diagram powerpoint slides presentation diagrams templates. Create visually stunning and define your PPT Presentations in a unique and inspiring manner using our above template. It usually includes one or more specific items of business to be discussed. A business agenda is an integral key to achieve a smooth and informative meeting, as it will give guidelines as to what needs to be discussed and take place. The structure of our templates allows you to effectively highlight the key issues concerning the growth of your business.
-
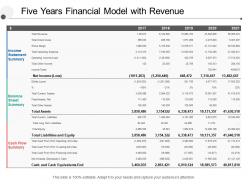 Five years financial model with revenue
Presenting this set of slides with name - Five Years Financial Model With Revenue. This is a three stage process. The stages in this process are Financial Analysis, Income Statement, Balance Sheet.
-
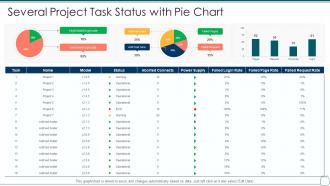 Several project task status with pie chart
Introducing our Several Project Task Status With Pie Chart set of slides. The topics discussed in these slides are Several Project Task Status With Pie Chart. This is an immediately available PowerPoint presentation that can be conveniently customized. Download it and convince your audience.
-
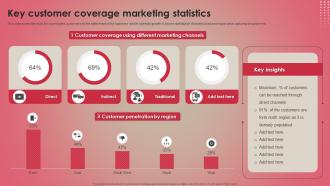 Key Customer Coverage Marketing Statistics
This slide covers the stats for covering the customers for the betterment of the business and its speedily growth. It shows distribution channels used and region wise capturing of customers. Presenting our well structured Key Customer Coverage Marketing Statistics. The topics discussed in this slide are Customer Coverage, Different Marketing Channels, Customer Penetration. This is an instantly available PowerPoint presentation that can be edited conveniently. Download it right away and captivate your audience.
-
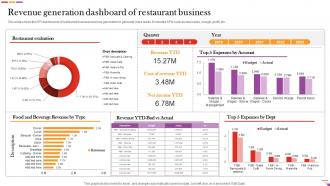 Revenue Generation Dashboard Of Restaurant Business Digital And Offline Restaurant
This slide shows the KPI dashboards of restaurant business revenue generation to generate more leads. It includes KPIs such as total sales, margin ,profit, etc. Present the topic in a bit more detail with this Revenue Generation Dashboard Of Restaurant Business Digital And Offline Restaurant Use it as a tool for discussion and navigation on Restaurant Evaluation, Revenue, Restaurant Business This template is free to edit as deemed fit for your organization. Therefore download it now.
-
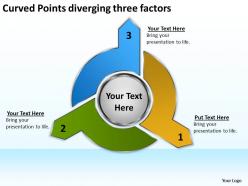 Curved points diverging three factors circular spoke process powerpoint slides
This Business Oriented Chart will definitely help you to be more Successful. Use this graphics as key element in streamlining your plans. It consists of 11 diverging factors connected together to form a complete Process.
-
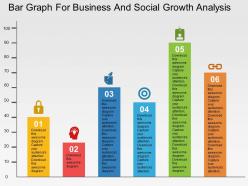 Bar graph for business and social growth analysis flat powerpoint design
Well maintained quality of the and the graphics. Empty background to add the content information. Edit the color theme and modify it as you like. Available information on the slides to make changes. Instant downloading and saving allowed. Offer to group or ungroup the objects for vivid message delivery. Valuable for the marketing professionals, business entrepreneurs and the global markets.
-
 Four staged text boxes with icons flat powerpoint design
We are proud to present our four staged text boxes with icons flat powerpoint design. This power point template diagram has been crafted with graphic of four staged text boxes with icons. This PPT diagram contains the concept of data representation. Use this PPT diagram for business and finance related presentations.
-
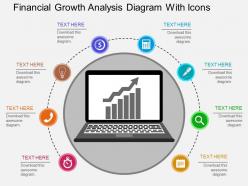 Hg financial growth analysis diagram with icons flat powerpoint design
Presenting hg financial growth analysis diagram with icons flat powerpoint design. This Power Point template diagram has been crafted with graphic of laptop and bar graph .This PPT diagram contains the concept of financial growth analysis representation. Use this PPT diagram for business and finance related presentations.
-
 Increase revenue with upward arrow dollar sign
Presenting this set of slides with name - Increase Revenue With Upward Arrow Dollar Sign. This is a four stage process. The stages in this process are Increase Revenue, Increase Sales, Growth.
-
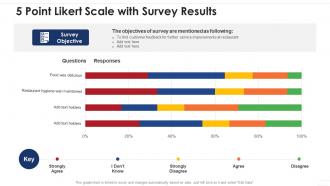 5 point likert scale with survey results key
Presenting our well structured 5 Point Likert Scale With Survey Results Key. The topics discussed in this slide are Service Improvements, Customer Feedback, Survey Objective. This is an instantly available PowerPoint presentation that can be edited conveniently. Download it right away and captivate your audience.
-
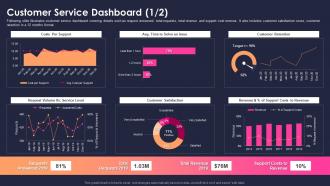 Customer service dashboard snapshot measure sustainability key performance indicators
Following slide illustrates customer service dashboard covering details such as request answered, total requests, total revenue and support cost revenue. It also includes customer satisfaction score, customer retention in a 12 months format. Deliver an outstanding presentation on the topic using this Customer Service Dashboard Snapshot Measure Sustainability Key Performance Indicators. Dispense information and present a thorough explanation of Costs Per Support, Avg. Time To Solve Issue, Customer Retention, Request Volume Vs Service Level, Customer Satisfaction using the slides given. This template can be altered and personalized to fit your needs. It is also available for immediate download. So grab it now.
-
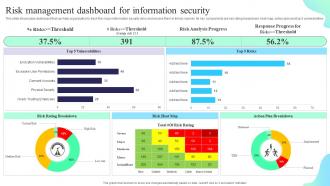 Risk Management Dashboard For Information Security Formulating Cybersecurity Plan
This slide showcases dashboard that can help organization to track the major information security risks and resolve them in timely manner. Its key components are risk rating breakdown, heat map, action plan and top 5 vulnerabilities. Deliver an outstanding presentation on the topic using this Risk Management Dashboard For Information Security Formulating Cybersecurity Plan. Dispense information and present a thorough explanation of Risk Management, Dashboard, Information Security using the slides given. This template can be altered and personalized to fit your needs. It is also available for immediate download. So grab it now.
-
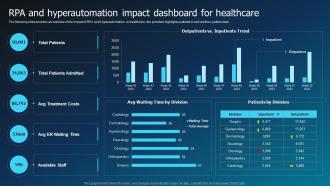 RPA And Hyperautomation Impact Dashboard For Healthcare Hyperautomation Industry Report
The following slide provides an overview of the impact of RPA and Hyperautomation on healthcare, the provided highlights patients in and out time, patient data. Present the topic in a bit more detail with this RPA And Hyperautomation Impact Dashboard For Healthcare Hyperautomation Industry Report. Use it as a tool for discussion and navigation on Total Patients, Available Staff, Patients By Division. This template is free to edit as deemed fit for your organization. Therefore download it now.
-
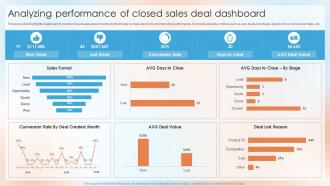 Analyzing Performance Of Closed Sales Deal Dashboard Top Sales Closing Techniques SA SS
Following slide highlights dashboard to monitor closed sales deal of company that helps to make decisions on improving performance. It includes pipeline metrics such as won deals, lost deals, days to close, conversion rates, etc. Present the topic in a bit more detail with this Analyzing Performance Of Closed Sales Deal Dashboard Top Sales Closing Techniques SA SS. Use it as a tool for discussion and navigation on Deal Value, Deal Lost Reason. This template is free to edit as deemed fit for your organization. Therefore download it now.
-
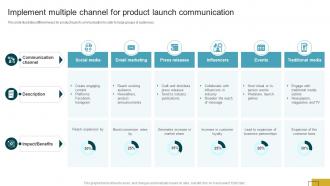 Product Launch Communication Implement Multiple Channel For Product Launch Communication
This slide illustrates different ways for product launch communication to cater to large groups of audiences. Present the topic in a bit more detail with this Product Launch Communication Implement Multiple Channel For Product Launch Communication Use it as a tool for discussion and navigation on Medium, Details, Channels This template is free to edit as deemed fit for your organization. Therefore download it now.
-
 Balance Sheet Statement Mitsubishi Company Profile CP SS
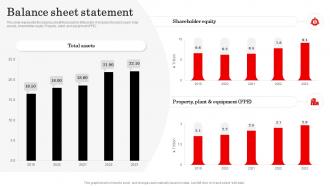
This slide represents the balance sheet financials for Mitsubishi. It includes the last 5 years total assets, shareholder equity, Property, plant, and equipment PPE. Present the topic in a bit more detail with this Balance Sheet Statement Mitsubishi Company Profile CP SS Use it as a tool for discussion and navigation on Shareholder Equity, Total Assets, Property, Plant and Equipment This template is free to edit as deemed fit for your organization. Therefore download it now.
-
 How People Search For Properties To Purchase Ultimate Guide To Understand Role BCT SS
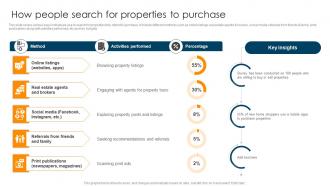
This slide covers various ways individuals use to search for properties they intend to purchase. It include different methods such as online listings, real estate agents and brokers, social media, referrals from friends and family, print publications along with activities performed, etc and key insights. Deliver an outstanding presentation on the topic using this How People Search For Properties To Purchase Ultimate Guide To Understand Role BCT SS. Dispense information and present a thorough explanation of Method, Activities Performed, Percentage using the slides given. This template can be altered and personalized to fit your needs. It is also available for immediate download. So grab it now.
-
 Strategic Approach For Developing Stakeholder Reasons To Conduct Stakeholder Interview For Project
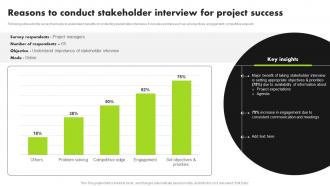
Following slide exhibits survey that helps to understand benefits of conducting stakeholder interviews. It includes pointers such as set objectives, engagement, competitive edge etc. Deliver an outstanding presentation on the topic using this Strategic Approach For Developing Stakeholder Reasons To Conduct Stakeholder Interview For Project. Dispense information and present a thorough explanation of Stakeholder Interview, Project Success, Engagement, Competitive Edge using the slides given. This template can be altered and personalized to fit your needs. It is also available for immediate download. So grab it now.
-
 3d spiral process powerpoint slides presentation diagrams templates
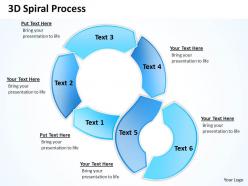
We are proud to present our 3d spiral process powerpoint slides presentation diagrams templates. Create visually stunning and define your PPT Presentations in a unique and inspiring manner using our above template. This diagram can be used to show looped processes, circular process, complex and linear process. It depicts specific models like analysis, plan, implementation and review. Elucidate on your thoughts and ideas to achieve the common aim with Excellence.
-
 Balance for process control and finance with growth powerpoint template
We are proud to present our balance for process control and finance with growth powerpoint template. Graphic of board and balance diagram has been used to craft this PPT diagram. This PPT diagram contains the concept of business process control and growth. Use this PPT diagram for business and finance related presentations.
-
 Growth chart with team management result analysis target achievement flat powerpoint design
We are proud to present our growth chart with team management result analysis target achievement flat powerpoint design. Graphic of growth chart has been used to craft this power point template diagram. This PPT diagram contains the concept of result analysis and target achievement. Use this PPT diagram for global business and marketing related presentations.
-
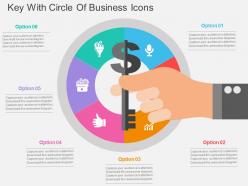 Key with circle of business icons flat powerpoint design
Modifiable PPT Slide with key with circle of business icons. Convertible into numerous format options like JPEG, JPG or PDF. Provides a professional outlook to your PowerPoint presentation. Icons are also be added. Customization of each PowerPoint graphic and text according to your desire and want. Multiple display option such as standard and widescreen view. Freedom to customize it with company name and logo.
-
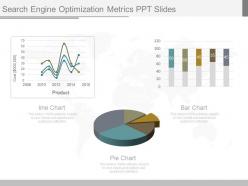 New search engine optimization metrics ppt slides
Presenting new search engine optimization metrics ppt slides. This is a search engine optimization metrics ppt slides. This is a three stage process. The stages in this process are cost, prodect, line chart, pie chart, bar chart.
-
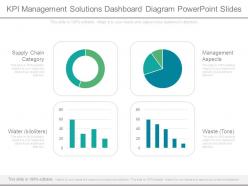 Kpi management solutions dashboard diagram powerpoint slides
Presenting kpi management solutions dashboard diagram powerpoint slides. This is a kpi management solutions dashboard diagram powerpoint slides. This is a four stage process. The stages in this process are supply chain category, water, management aspects, waste.
-
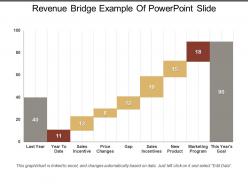 Revenue bridge example of powerpoint slide
Presenting this set of slides with name - Revenue Bridge Example Of Powerpoint Slide. This is a seven stage process. The stages in this process are Revenue Bridge, Income Bridge, Earnings Bridge.
-
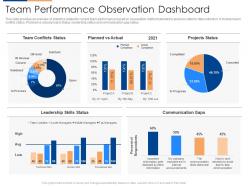 Team performance observation dashboard snapshot organizational team building program
This slide provides an overview of statistics related to current team performance based on observation method selected in previous slide for data collection. It involves team conflict status, Planned vs actual project status, leadership status and communication gap status. Present the topic in a bit more detail with this Team Performance Observation Dashboard snapshot Organizational Team Building Program. Use it as a tool for discussion and navigation on Team Performance Observation Dashboard. This template is free to edit as deemed fit for your organization. Therefore download it now.
-
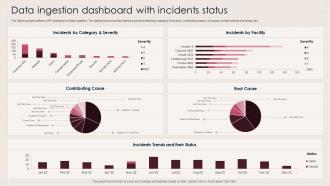 Data Ingestion Dashboard Snapshot With Incidents Status
The following slide outlines a KPI dashboard of data ingestion. The dashboard covers key metrics such as incidents by category and severity, contributing cause, root cause, incident trends and status, etc. Introducing our Data Ingestion Dashboard Snapshot With Incidents Status set of slides. The topics discussed in these slides are Data Ingestion, Dashboard, Incidents Status. This is an immediately available PowerPoint presentation that can be conveniently customized. Download it and convince your audience.
-
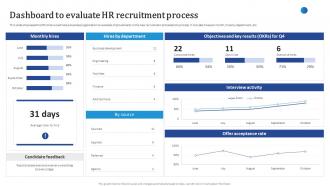 Dashboard To Evaluate HR Recruitment Process Streamlining HR Recruitment Process
This slide showcases the KPIs that would help a business organization to evaluate improvements in the new recruitment and selection process. It includes hires per month, hires by department, etc. Deliver an outstanding presentation on the topic using this Dashboard To Evaluate HR Recruitment Process Streamlining HR Recruitment Process. Dispense information and present a thorough explanation of Objectives, Interview Activity, Offer Acceptance using the slides given. This template can be altered and personalized to fit your needs. It is also available for immediate download. So grab it now.
-
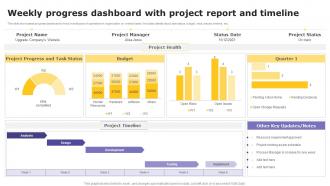 Weekly Progress Dashboard With Project Report And Timeline
This slide showcases progress dashboard to track overall pace of operations in organization on weekly basis. It includes details about task status, budget, risks, issues, timeline, etc. Introducing our Weekly Progress Dashboard With Project Report And Timeline set of slides. The topics discussed in these slides are Progress, Report, Timeline. This is an immediately available PowerPoint presentation that can be conveniently customized. Download it and convince your audience.
-
 Business powerpoint templates bored emoticon illustration picture sales ppt slides
This PowerPoint Diagram shows you the many types of bored emoticons expressing your feelings. This Diagram signifies disinterest, dull, fatigue, inattentive, sick and tired, spiritless, tired, turned off.
-
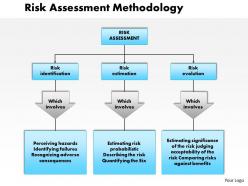 0514 risk assessment methodology powerpoint presentation
PPT slide can be presented in both standard and widescreen view. Effortlessly download and changeable into JPEG and PDF document. PowerPoint designs are totally compatible with Google slides. Choice of insertion of corporate symbol and image for personalization. Availability to download similar designs with different nodes and stages. Easily editable presentation layout as color, text and font are editable.
-
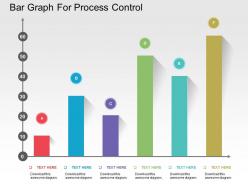 Bar graph for process control flat powerpoint design
We are proud to present our bar graph for process control flat powerpoint design. This power point template diagram has been crafted with graphic of bar graph. This diagram template contains the concept of process control. Use this PPT diagram for business and marketing process related presentations.
-
 Investment planning icon ppt images
Presenting investment planning icon ppt images. This is a investment planning icon ppt images. This is a eight stage process. The stages in this process are investment, venture capital, funding, private equity.
-
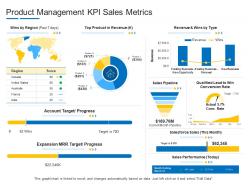 Product management kpi sales metrics product channel segmentation ppt summary
Deliver an outstanding presentation on the topic using this Product Management KPI Sales Metrics Product Channel Segmentation Ppt Summary. Dispense information and present a thorough explanation of Revenue, Sales Performance, Account Target, Progress, Sales Pipeline using the slides given. This template can be altered and personalized to fit your needs. It is also available for immediate download. So grab it now.


