Finance PowerPoint Templates, Presentation Slide Diagrams & PPT Graphics
- Sub Categories
-
- 30 60 90 Day Plan
- Advertising
- Agile Development
- Aims and Objectives
- Arrows
- Before and After
- Blockchain Bitcoin
- Boxes
- Business
- Calender
- Case Study
- Celebrations
- Certificates
- Challenges Opportunities
- Channel Distribution
- Children
- Communication
- Competitive Landscape
- Computer
- Concepts
- Construction Management
- Corporate
- Crowdfunding
- Current State Future State
- Custom PowerPoint Diagrams
- Digital Transformation
- Dos and Donts
- Economics
- Education
- Environment
- Events
- Festival
- Finance
- Financials
- Food
- Game
- Gap Analysis
- Generic
- Geographical
- Health
- Heatmaps
- Holidays
- Icons
- Input Process Output
- Internet
- Key Messages
- Key Wins
- Ladder
- Leadership
- Lists
- Lucky Draw
- Management
- Marketing
- Measuring
- Medical
- Music
- News
- Next Steps
- People Process Technology
- Pillars
- Planning
- Post-it-Notes
- Problem Statement
- Process
- Proposal Management
- Pros and Cons
- Puzzle
- Puzzles
- Recruitment Strategy
- Religion
- Research and Development
- Risk Mitigation Strategies
- Roadmap
- Selling
- Shapes
- Short Term Long Term
- Social
- Stairs
- Start Stop Continue
- Strategy
- Symbol
- Technology
- Thesis Defense Dissertation
- Timelines
- Traffic
- Transition Plan
- Transportation
- Vehicles
- Venture Capital Funding
- Warning
- Winners
- Word Cloud
-
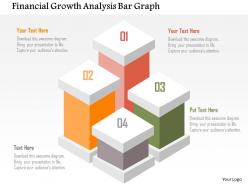 Financial growth analysis bar graph flat powerpoint design
Easily convertible into PDF & JPEG format. Beneficial for marketing and finance professionals. Smooth interface is compatible with Google slides and other softwares. Customisable layout allows you to change color schemes and use different sizes. Add business details to avoid plagiarism. No Pixilation which means crystal clear display on bigger screens. High Resolution graphics and quick to download.
-
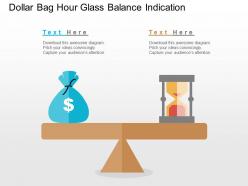 Dollar bag hour glass balance indication flat powerpoint design
Well compatible with Google slides. High resolution template for better visual experience. Option to customize color, text, font and image. Runs smoothly with all software’s. Can be easily converted into PDF or JPG formats. Allow instant downloading of the slide template. Adequate space provided to put in text. Professionally designed by the professional designers. Useful for the individuals from finance, sales and marketing backgrounds.
-
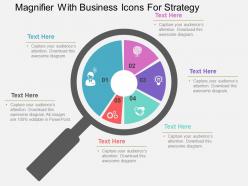 Magnifier with business icons for strategy flat powerpoint design
Magnifier with business icons for strategy PPT Slide. Extremely promising and reliable PowerPoint presentation slides. Up to date with the latest tools and techniques. Completely customizable to match the needs of the organization. Compatible with Microsoft office software and the Google slides. Available to be saved in JPG or PDF format. Modify and personalize the presentation by including the company name and logo.
-
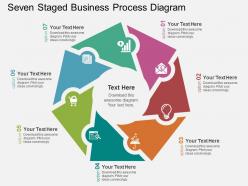 Seven staged business process diagram flat powerpoint design
We are proud to present our seven staged business process diagram flat powerpoint design. Seven staged process diagram has been used to craft this power point template diagram. This PPT diagram contains the concept of process flow representation. Use this PPT diagram for business and marketing related presentations.
-
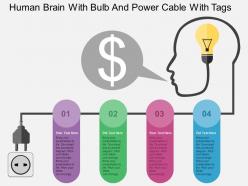 Human brain with bulb and power cable with tags flat powerpoint design
Remarkable Presentation design for business professionals. Incredible picture quality as pixels don’t break when shared in widescreen view. Blend well with online software tools i.e. JPG and PDF. Hundred percent compatible with Google slides. PowerPoint visual can be modified easily as access to change color, text accessible. Pre-designed PPT illustration saves you valuable time. Alter the PPT with your company name, logo and icon. Beneficial for showing innovation process in the business firm, intelligence and technology concepts.
-
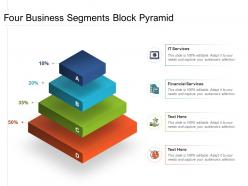 Four business segments block pyramid
Presenting this set of slides with name Four Business Segments Block Pyramid. This is a four stage process. The stages in this process are IT Services, Financial Services. This is a completely editable PowerPoint presentation and is available for immediate download. Download now and impress your audience.
-
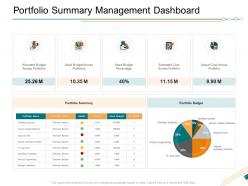 Portfolio summary management dashboard ppt file design inspiration
Presenting this set of slides with name Portfolio Summary Management Dashboard Ppt File Design Inspiration. The topics discussed in these slides are Allocated Budget Across Portfolios, Used Budget Across Portfolios, Used Budget Percentage, Estimated Cost Across Portfolio, Actual Cost Across Portfolio. This is a completely editable PowerPoint presentation and is available for immediate download. Download now and impress your audience.
-
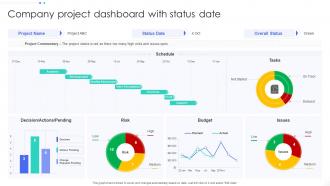 Company Project Dashboard Snapshot With Status Date
This graph or chart is linked to excel, and changes automatically based on data. Just left click on it and select Edit Data. Introducing our Company Project Dashboard Snapshot With Status Date set of slides. The topics discussed in these slides are Decision Actions, Pending, Project, Overall Status. This is an immediately available PowerPoint presentation that can be conveniently customized. Download it and convince your audience.
-
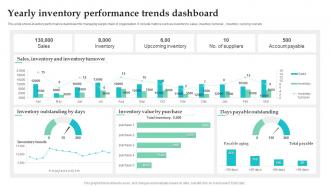 Yearly Inventory Performance Trends Dashboard
This slide shows inventory performance dashboard for managing supply chain of organization. It include metrics such as inventory to sales, inventory turnover, inventory carrying cost etc. Introducing our Yearly Inventory Performance Trends Dashboard set of slides. The topics discussed in these slides are Sales, Inventory, Upcoming Inventory, Account Payable. This is an immediately available PowerPoint presentation that can be conveniently customized. Download it and convince your audience.
-
 Business powerpoint templates design of cheerful smiley sales ppt slides 117
This template is skillfully designed and is completely editable to suit all the needs and requirements of the user. The color of the font, its size, style, and all other elements can be customized according to the user's desire The text in the PPT placeholder can be replaced with the desired information making this template highly flexible and adaptable as well. This template is also compatible with various Microsoft versions and formats like Google Slides, JPG, PDF, etc so the user will face no issue in saving it in the format of his choice.
-
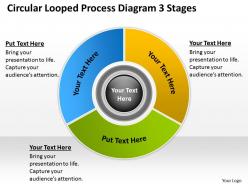 Business cycle diagram circular looped process 3 stages powerpoint slides
We are proud to present our business cycle diagram circular looped process 3 stages powerpoint slides. Deliver amazing Presentations with our above template. Use this PowerPoint Diagram for business, benefits, processes, relationships, business groups, strategy, goals, stages, step-by-step objects, circular objects, flowchart, etc. The diagrams are used to represent part- whole relationship, cause ?results relationship etc.
-
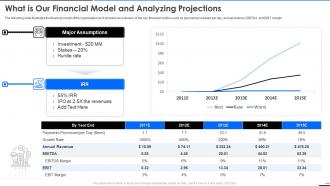 Square what is our financial model and analyzing projections ppt slides pictures
The following slide illustrates the financial model of the organization as it provides an overview of the key financial metrics such as payment processed per day, annual revenue, EBITDA and EBIT margin. Present the topic in a bit more detail with this Square What Is Our Financial Model And Analyzing Projections Ppt Slides Pictures. Use it as a tool for discussion and navigation on Major Assumptions, IRR, Growth Rate, Annual Revenue, EBITDA Margin, 2021. This template is free to edit as deemed fit for your organization. Therefore download it now.
-
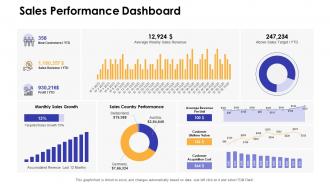 Sales performance dashboard dashboards by function
Deliver an outstanding presentation on the topic using this Sales Performance Dashboard Dashboards By Function. Dispense information and present a thorough explanation of Sales Performance Dashboard using the slides given. This template can be altered and personalized to fit your needs. It is also available for immediate download. So grab it now.
-
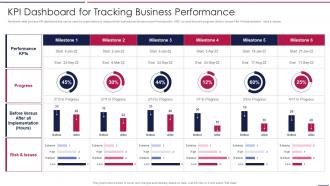 AIOps Playbook KPI Dashboard For Tracking Business Performance Ppt Structure
Mentioned slide portrays KPI dashboard that can be used by organizations to measure their business performance post AI introduction. KPIS covered here are progress, Before versus After AI Implementation, risks and issues. Present the topic in a bit more detAIl with this AIOps Playbook KPI Dashboard For Tracking Business Performance Ppt Structure. Use it as a tool for discussion and navigation on KPI Dashboard For Tracking Business Performance. This template is free to edit as deemed fit for your organization. Therefore download it now.
-
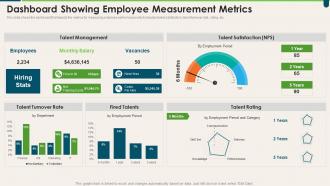 Dashboard Showing Employee Measurement Metrics Transforming HR Process Across Workplace
This slide shows the dashboard that depicts the metrics for measuring employee performance which includes talent satisfaction, talent turnover rate, rating, etc. Deliver an outstanding presentation on the topic using this Dashboard Showing Employee Measurement Metrics Transforming HR Process Across Workplace. Dispense information and present a thorough explanation of Talent Management, Talent Satisfaction, Fired Talents using the slides given. This template can be altered and personalized to fit your needs. It is also available for immediate download. So grab it now.
-
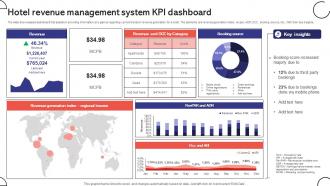 Hotel Revenue Management System KPI Dashboard
The slide showcases a dashboard that assists in providing information at a glance regarding current trends in revenue generation for a hotel. The elements are revenue generation index, revpar, ADR, OCC, booking source, etc., With their key insights. Presenting our well structured Hotel Revenue Management System KPI Dashboard. The topics discussed in this slide are Management, Revenue, System. This is an instantly available PowerPoint presentation that can be edited conveniently. Download it right away and captivate your audience.
-
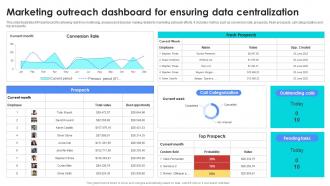 Marketing Outreach Dashboard For Ensuring Data Centralization
This slide illustrates KPI dashboard for allowing real time monitoring, analysis and decision making related to marketing outreach efforts. It includes metrics such as conversion rate, prospects, fresh prospects, call categorization and top prospects. Presenting our well structured Marketing Outreach Dashboard For Ensuring Data Centralization. The topics discussed in this slide are Dashboard, Ensuring, Data. This is an instantly available PowerPoint presentation that can be edited conveniently. Download it right away and captivate your audience.
-
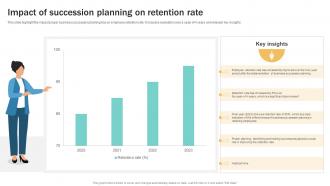 Impact Of Succession Planning On Retention Succession Planning Guide To Ensure Business Strategy SS
This slide highlight the impact proper business succession planning has on employee retention rate. It includes evaluation over a span of 4 years and relevant key insights. Present the topic in a bit more detail with this Impact Of Succession Planning On Retention Succession Planning Guide To Ensure Business Strategy SS. Use it as a tool for discussion and navigation on Succession Planning, Retention Rate. This template is free to edit as deemed fit for your organization. Therefore download it now.
-
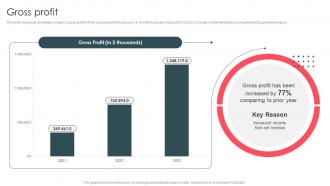 Gross Profit Data Analytics And Storage Company Profile CP SS V
This slide showcases Snowflake companys gross profit for three consecutive financial years i.e. from financial year ending 2021 to 2023. It assists in determining the cost requirements to generate revenue. Deliver an outstanding presentation on the topic using this Gross Profit Data Analytics And Storage Company Profile CP SS V Dispense information and present a thorough explanation of Gross Profit using the slides given. This template can be altered and personalized to fit your needs. It is also available for immediate download. So grab it now.
-
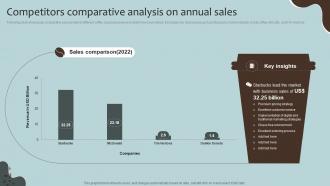 Competitors Comparative Analysis Coffee House Company Profile CP SS V
Following slide showcases comparative assessment of different coffee business revenue to determine best sellers. It includes key businesses such as Starbucks, Dunkin donuts, Costa coffee, McCafe, and Tim Hortons. Deliver an outstanding presentation on the topic using this Competitors Comparative Analysis Coffee House Company Profile CP SS V. Dispense information and present a thorough explanation of Key Insights, Starbucks Lead, Business Sales using the slides given. This template can be altered and personalized to fit your needs. It is also available for immediate download. So grab it now.
-
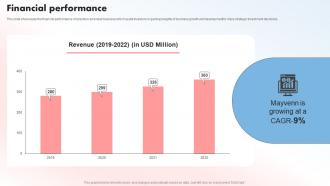 Financial Performance Beauty Supplies Provider Investor Funding Elevator Pitch Deck
This slide showcases the financial performance of a fashion and retail business which assist investors in gaining insights of business growth and development to make strategic investment decisions. Deliver an outstanding presentation on the topic using this Financial Performance Beauty Supplies Provider Investor Funding Elevator Pitch Deck Dispense information and present a thorough explanation of Financial Performance using the slides given. This template can be altered and personalized to fit your needs. It is also available for immediate download. So grab it now.
-
 Global Market Analysis Of Pizza Industry Pizza Pie Business Plan BP SS
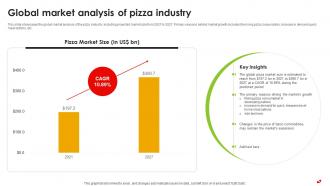
This slide showcases the global market analysis of the pizza industry, including projected market size from 2021 to 2027. Primary reasons behind market growth includes the rising pizza consumption, increase in demand quick meal options, etc. Present the topic in a bit more detail with this Global Market Analysis Of Pizza Industry Pizza Pie Business Plan BP SS. Use it as a tool for discussion and navigation on Pizza Market Size, Predicted Period, Markets Expansion. This template is free to edit as deemed fit for your organization. Therefore download it now.
-
 Web Security Insights On Data Breaches
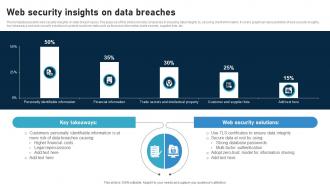
This template presents web security insights on data breach cases. The purpose of this slide is to help companies in ensuring data integrity by securing client information. It covers graphical representation of web security insights, key takeaways and web security solutions to protect customer data such as financial information, trade secrets, supplier lists, etc. Presenting our well structured Web Security Insights On Data Breaches The topics discussed in this slide are Web Security Solutions, Customers, Data This is an instantly available PowerPoint presentation that can be edited conveniently. Download it right away and captivate your audience.
-
 Overview Of Alcohol Beverages Market Landscape Global Alcohol Industry Outlook IR SS
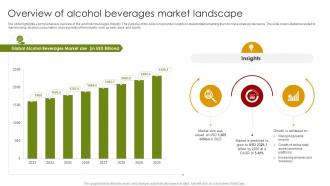
The slide highlights a comprehensive overview of the alcoholic beverages industry. The purpose of the slide is to provide insights to stakeholders enabling them to make strategic decisions. The slide covers statistics related to market sizing, alcohol consumption, and segments of the industry such as beer, wine, and spirits. Deliver an outstanding presentation on the topic using this Overview Of Alcohol Beverages Market Landscape Global Alcohol Industry Outlook IR SS. Dispense information and present a thorough explanation of Alcohol Beverages, Market Landscape, Online Retail using the slides given. This template can be altered and personalized to fit your needs. It is also available for immediate download. So grab it now.
-
 Business powerpoint templates colorful textboxes with numbers sales ppt slides
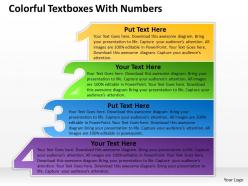
This PowerPoint template shows five stylish text boxes. It can be used to show grouped information. This PowerPoint diagram slide shows stylish text boxes to list differing view.
-
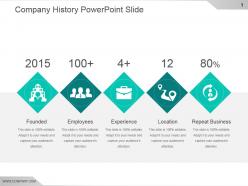 Company history powerpoint slide
Presenting company history powerpoint slide. This is a company history powerpoint slide. This is a five stage process. The stages in this process are founded, employees, experience, location, repeat business.
-
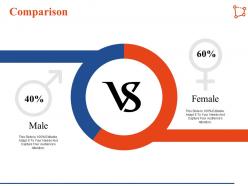 Comparison in demographic zone ppt infographic template portfolio
Introducing comparison in demographic zone PPT template. Ready to use PowerPoint design hence which saves time, unaffected high resolution PPT templates, Manual process to alter PowerPoint background, text or color, Space adequacy to add text, titles or subtitles. Click to add company logo, trademark, or name. Runs smoothly over Google Slides. Smooth and quick downloading process. Easy to download PPT slides.
-
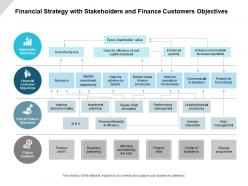 Financial strategy with stakeholders and finance customers objectives
Presenting this set of slides with name Financial Strategy With Stakeholders And Finance Customers Objectives. This is a four stage process. The stages in this process are Financial Strategy, Business Strategy, Cash Management. This is a completely editable PowerPoint presentation and is available for immediate download. Download now and impress your audience.
-
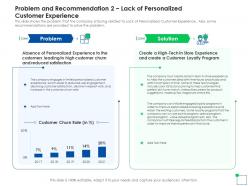 Problem and recommendation 2 lack application of latest trends to enhance profit margins
This slide shows the problem that the company is facing related to Lack of Personalized Customer Experience. Also, some recommendations are provided to solve the problem. Present the topic in a bit more detail with this Problem And Recommendation 2 Lack Application Of Latest Trends To Enhance Profit Margins. Use it as a tool for discussion and navigation on Problem, Solution. This template is free to edit as deemed fit for your organization. Therefore download it now.
-
 Procurement Analysis Enterprise Procurement Reporting And Analysis Ppt Mockup
This slide covers procurement reporting and analysis dashboard including KPI and metrices such as spend, transactions, PO, PR and invoice count, invoices information, due dates, spend by payment terms, supplier payment terms etc. Present the topic in a bit more detail with this Procurement Analysis Enterprise Procurement Reporting And Analysis Ppt Mockup. Use it as a tool for discussion and navigation on Enterprise Procurement Reporting And Analysis. This template is free to edit as deemed fit for your organization. Therefore download it now.
-
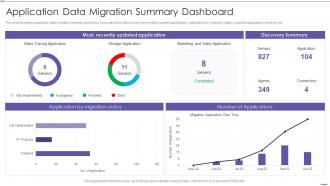 Application Data Migration Summary Dashboard Snapshot
This slide illustrates application data migration summary dashboard Snapshot. It provides information about most recently updated applications, applications by migration status, migrated applications over time, etc. Introducing our Application Data Migration Summary Dashboard set of slides. The topics discussed in these slides are Sales Tracing Application, Marketing, Discovery Summary. This is an immediately available PowerPoint presentation that can be conveniently customized. Download it and convince your audience.
-
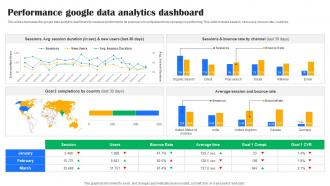 Performance Google Data Analytics Dashboard
This slide showcases the google data analytics dashboard to measure performance. Its purpose is to understand how campaign is performing. This slide includes session, new users, bounce rate, countries. Introducing our Performance Google Data Analytics Dashboard set of slides. The topics discussed in these slides are Performance, Google Data Analytics, Dashboard This is an immediately available PowerPoint presentation that can be conveniently customized. Download it and convince your audience.
-
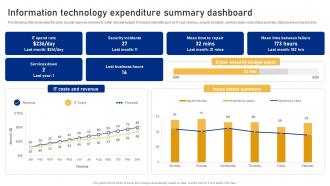 Information Technology Expenditure Summary Dashboard Cyber Risk Assessment
The following slide showcases the cyber security expense overview to better allocate budget. It includes elements such as IT cost, revenue, security incidents, services down, issue status summary, total business hours lost etc. Deliver an outstanding presentation on the topic using this Information Technology Expenditure Summary Dashboard Cyber Risk Assessment Dispense information and present a thorough explanation of Security Incidents, Costs And Revenue, Issue Status Summary using the slides given. This template can be altered and personalized to fit your needs. It is also available for immediate download. So grab it now.
-
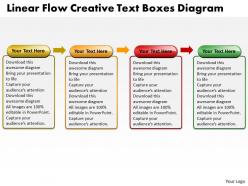 Business powerpoint templates liner flow creative text boxes diagram sales ppt slides
We present our Business PowerPoint Templates liner flow creative text boxes diagram Sales PPT Slides PowerPoint templates. This PowerPoint text boxes diagram template is designed to help you place your text in a professional layout.
-
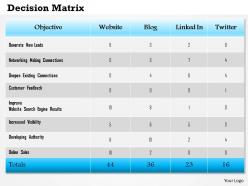 0514 decision matrix powerpoint presentation
We are proud to present our 0514 decision matrix powerpoint presentation. A decision matrix is a tool to help you decide between multiple options by scoring them against different criteria. Using a decision matrix you can effectively blast through tough decisions.
-
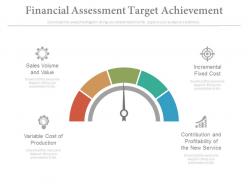 Financial assessment target achievement ppt slides
Presenting financial assessment target achievement ppt slides. This is a financial assessment target achievement ppt slides. This is a one stage process. The stages in this process are finance, business, marketing, strategy.
-
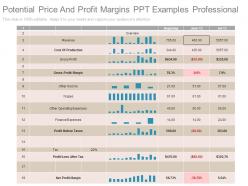 Potential price and profit margins ppt examples professional
Presenting potential price and profit margins ppt examples professional. This is a potential price and profit margins ppt examples professional. This is a eleven stage process. The stages in this process are revenue, cost of production, gross profit, gross profit margin, other income, wages, other operating expenses.
-
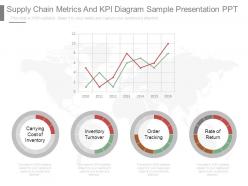 Supply chain metrics and kpi diagram sample presentation ppt
Presenting supply chain metrics and kpi diagram sample presentation ppt. This is a supply chain metrics and kpi diagram sample presentation ppt. This is a four stage process. The stages in this process are carrying cost of inventory, inventory turnover, order tracking, rate of return.
-
 Cash icon showing money bills with coins and dollar signs
Presenting this set of slides with name - Cash Icon Showing Money Bills With Coins And Dollar Signs. This is a four stage process. The stages in this process are Cash Icon, Money Icon, Income Icon.
-
 Insurance sales icons
Presenting Insurance Sales Icons PPT template. The template is compatible with Google Slides as well as other software. Also, it can be displayed on different screens. File formats are changeable. You can save files in PDF, JPG and PNG format. Hit the download button and start preparing your presentation.
-
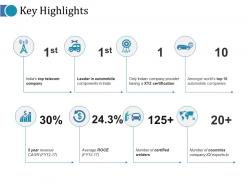 Key highlights ppt model graphics template
Presenting this set of slides with name - Key Highlights Ppt Model Graphics Template. This is a eight stage process. The stages in this process are Number Of Certified Welders, Finance, Icons, Strategy.
-
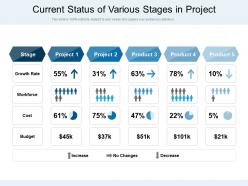 Current status of various stages in project
Presenting this set of slides with name Current Status Of Various Stages In Project. This is a four stage process. The stages in this process are Growth Rate, Workforce, Cost, Budget. This is a completely editable PowerPoint presentation and is available for immediate download. Download now and impress your audience.
-
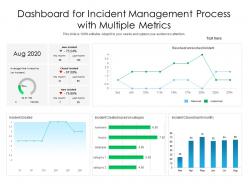 Dashboard for incident management process with multiple metrics
Introducing our Dashboard For Incident Management Process With Multiple Metrics set of slides. The topics discussed in these slides are Dashboard For Incident Management Process With Multiple Metrics. This is an immediately available PowerPoint presentation that can be conveniently customized. Download it and convince your audience.
-
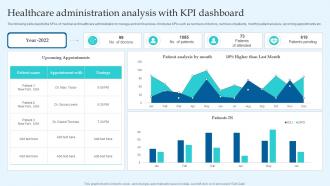 Healthcare Administration Analysis With KPI Dashboard
The following slide depicts the KPAs of medical and healthcare administration to manage and remit services. It includes KPIs such as numbers of doctors, numbers of patients, monthly patient analysis, upcoming appointments etc. Presenting our well-structured Healthcare Administration Analysis With KPI Dashboard. The topics discussed in this slide are Healthcare Administration Analysis, KPI Dashboard. This is an instantly available PowerPoint presentation that can be edited conveniently. Download it right away and captivate your audience.
-
 Operating Profit Margin Dashboard With Income Statement And Expenses
This slide showcases dashboard that can help organization to estimate the profit generated by organization from its core operations and expenses incurred for different activities. Its key components are operating profit margin, net profit margin, income statement and EBIT. Introducing our Operating Profit Margin Dashboard With Income Statement And Expenses set of slides. The topics discussed in these slides are Gross Profit Margin, Operating Expenses Ratio, Operating Profit Margin. This is an immediately available PowerPoint presentation that can be conveniently customized. Download it and convince your audience.
-
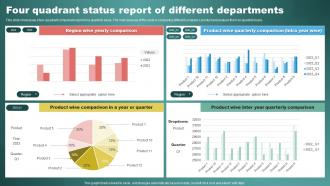 Four Quadrant Status Report Of Different Departments
This slide showcases a four quadrant comparison report on a quarterly basis. The main purpose of this slide is comparing different companys product and analyse them on quarterly basis. Presenting our well structured Four Quadrant Status Report Of Different Departments. The topics discussed in this slide are Region Wise Yearly Comparison, Product Wise Inter Year.This is an instantly available PowerPoint presentation that can be edited conveniently. Download it right away and captivate your audience.
-
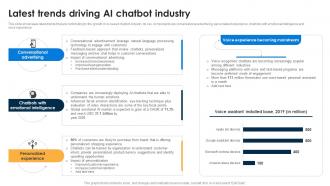 Latest Trends Driving AI Chatbot AI Chatbots For Business Transforming Customer Support Function AI SS V
This slide showcases latest trends that are contributing to the growth of AI-based chatbot industry. Its key components are conversational advertising, personalized experience, chatbots with emotional intelligence and voice experience. Present the topic in a bit more detail with this Latest Trends Driving AI Chatbot AI Chatbots For Business Transforming Customer Support Function AI SS V. Use it as a tool for discussion and navigation on Conversational Advertising, Emotional Intelligence, Personalized Experience. This template is free to edit as deemed fit for your organization. Therefore download it now.
-
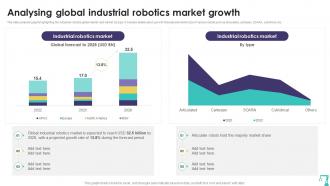 Analysing Global Industrial Precision Automation Industrial Robotics Technology RB SS
This slide presents graphs highlighting the industrial robotics global market and market by type. It includes details about growth forecast and market size of various robots such as articulated, cartesian, SCARA, cylindrical, etc. Deliver an outstanding presentation on the topic using this Analysing Global Industrial Precision Automation Industrial Robotics Technology RB SS. Dispense information and present a thorough explanation of Global Industrial, Robotics Market, Growth Rate using the slides given. This template can be altered and personalized to fit your needs. It is also available for immediate download. So grab it now.
-
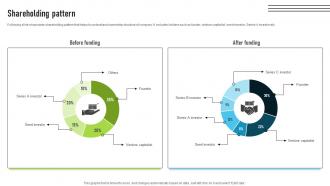 Shareholding Pattern Corporate Integration Software Pitch Deck To Increase Productivity
Following slide showcases shareholding pattern that helps to understand ownership structure of company. It includes holders such as funder, venture capitalist, seed investor, Series A investor etc. Deliver an outstanding presentation on the topic using this Shareholding Pattern Corporate Integration Software Pitch Deck To Increase Productivity. Dispense information and present a thorough explanation of Shareholding Pattern, Seed Investor, Venture Capitalist using the slides given. This template can be altered and personalized to fit your needs. It is also available for immediate download. So grab it now.
-
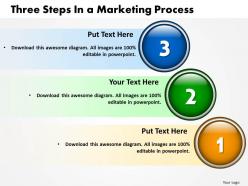 Three steps in a marketing process powerpoint templates ppt presentation slides 812
This diagram is useful for project planning, time scheduling, cost control and budget management
-
 Bank icon image showed with dollar sign
Presenting this set of slides with name - Bank Icon Image Showed With Dollar Sign. This is a one stage process. The stages in this process are Bank Icon, Finance Icons, Money Icon.
-
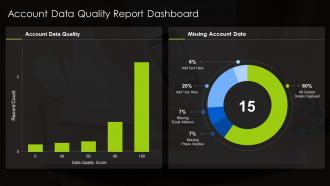 Account Data Quality Report Dashboard Snapshot
Introducing our Account Data Quality Report Dashboard Snapshot set of slides. The topics discussed in these slides are Account Data Quality, Missing Account Data, Record Count, Data Quality Score. This is an immediately available PowerPoint presentation that can be conveniently customized. Download it and convince your audience.
-
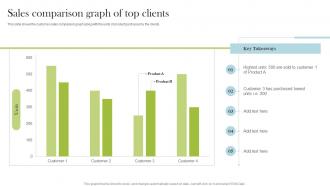 Sales Comparison Graph Of Top Clients
This slide shows the customer sales comparison graph along with the units of product purchased by the clients. Introducing our Sales Comparison Graph Of Top Clients set of slides. The topics discussed in these slides are Sales Comparison, Graph, Top Clients. This is an immediately available PowerPoint presentation that can be conveniently customized. Download it and convince your audience.
-
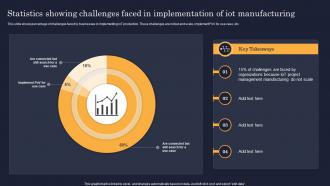 Statistics Showing Challenges Faced In Implementation Of IoT Manufacturing
This slide shows percentage of challenges faced by businesses in implementing IoT production. These challenges are rollout and scale, implement PoV for use case, etc. Introducing our Statistics Showing Challenges Faced In Implementation Of IoT Manufacturing set of slides. The topics discussed in these slides are IoT Project, Management Manufacturing, Key Takeaways. This is an immediately available PowerPoint presentation that can be conveniently customized. Download it and convince your audience.
-
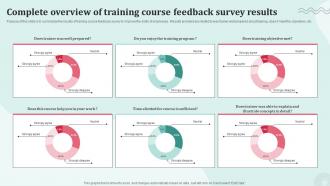 Complete Overview Of Training Course Feedback Survey Results Survey SS
Purpose of this slide is to summarize the results of training course feedback survey to improve the skills of employees . Results provided are related to was trainer well prepared about training, does it meet the objectives, etc. Introducing our Complete Overview Of Training Course Feedback Survey Results Survey SS set of slides. The topics discussed in these slides are Complete, Course, Feedback. This is an immediately available PowerPoint presentation that can be conveniently customized. Download it and convince your audience.
-
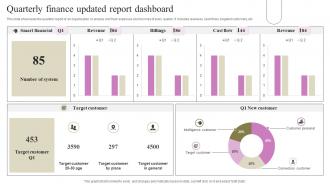 Quarterly Finance Updated Report Dashboard
This slide showcases the quarterly report of an organisation to analyze and track expenses and incomes of every quarter. It includes revenues, cash flows, targeted customers, etc. Introducing our Quarterly Finance Updated Report Dashboard set of slides. The topics discussed in these slides are Revenue, Smart Financial, Target Customer. This is an immediately available PowerPoint presentation that can be conveniently customized. Download it and convince your audience.
-
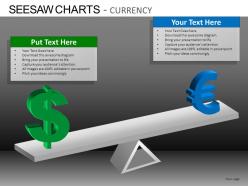 Seesaw currency powerpoint presentation slides db
These high quality, editable pre-designed powerpoint slides and powerpoint templates have been carefully created by our professional team to help you impress your audience. Each graphic in every powerpoint slide is vector based and is 100% editable in powerpoint.Each and every property of any slide - color, size, shading etc can be modified to build an effective powerpoint presentation. Use these slides to convey complex business concepts in a simplified manner. Any text can be entered at any point in the powerpoint slide. Simply DOWNLOAD, TYPE and PRESENT
-
 Budget process icons powerpoint graphics
Presenting budget process icons PowerPoint graphics. This presentation layout offers an easy conversion to other software like JPG and PDF formats. The image quality of this template remains unchanged even when you resize the image or portray on big screens. You can change PowerPoint structure, font, text, color, and design as per your requirements. This is an ideal design for marketing teams, entrepreneurs, business managers, and big companies. This slideshow offers easy data entry options to put in the company logo, brand or name.
-
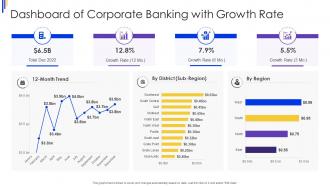 Dashboard Snapshot Of Corporate Banking With Growth Rate
This graph or chart is linked to excel, and changes automatically based on data. Just left click on it and select Edit Data. Introducing our Dashboard Snapshot Of Corporate Banking With Growth Rate set of slides. The topics discussed in these slides are Growth Rate, 12 Month Trend, Total Dec 2022. This is an immediately available PowerPoint presentation that can be conveniently customized. Download it and convince your audience.
-
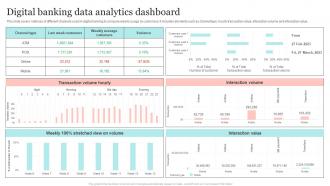 Digital Banking Data Analytics Dashboard
This slide covers matrices of different channels used in digital banking to compare weekly usage by customers. It includes elements such as channel type, hourly transaction value, interaction volume and interaction value. Presenting our well structured Digital Banking Data Analytics Dashboard. The topics discussed in this slide are Transaction Volume Hourly, Interaction Volume, Interaction Value. This is an instantly available PowerPoint presentation that can be edited conveniently. Download it right away and captivate your audience.


