Finance PowerPoint Templates, Presentation Slide Diagrams & PPT Graphics
- Sub Categories
-
- 30 60 90 Day Plan
- Advertising
- Agile Development
- Aims and Objectives
- Arrows
- Before and After
- Blockchain Bitcoin
- Boxes
- Business
- Calender
- Case Study
- Celebrations
- Certificates
- Challenges Opportunities
- Channel Distribution
- Children
- Communication
- Competitive Landscape
- Computer
- Concepts
- Construction Management
- Corporate
- Crowdfunding
- Current State Future State
- Custom PowerPoint Diagrams
- Digital Transformation
- Dos and Donts
- Economics
- Education
- Environment
- Events
- Festival
- Finance
- Financials
- Food
- Game
- Gap Analysis
- Generic
- Geographical
- Health
- Heatmaps
- Holidays
- Icons
- Input Process Output
- Internet
- Key Messages
- Key Wins
- Ladder
- Leadership
- Lists
- Lucky Draw
- Management
- Marketing
- Measuring
- Medical
- Music
- News
- Next Steps
- People Process Technology
- Pillars
- Planning
- Post-it-Notes
- Problem Statement
- Process
- Proposal Management
- Pros and Cons
- Puzzle
- Puzzles
- Recruitment Strategy
- Religion
- Research and Development
- Risk Mitigation Strategies
- Roadmap
- Selling
- Shapes
- Short Term Long Term
- Social
- Stairs
- Start Stop Continue
- Strategy
- Symbol
- Technology
- Thesis Defense Dissertation
- Timelines
- Traffic
- Transition Plan
- Transportation
- Vehicles
- Venture Capital Funding
- Warning
- Winners
- Word Cloud
-
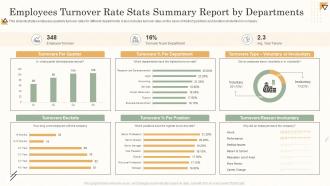 Employees Turnover Rate Stats Summary Report By Departments
This slide illustrates employees quarterly turnover rates for different departments. It also includes turnover rates on the basis of distinct positions and duration of retention in company. Presenting our well structured Employees Turnover Rate Stats Summary Report By Departments. The topics discussed in this slide are Employees Turnover, Rate Stats Summary, Report By Departments. This is an instantly available PowerPoint presentation that can be edited conveniently. Download it right away and captivate your audience.
-
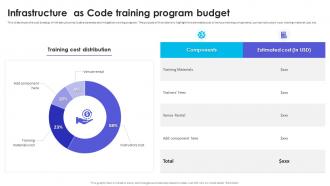 Infrastructure As Code Training Program Budget Infrastructure As Code Adoption Strategy
This slide shows the cost breakup of Infrastructure as Code awareness and mitigation training program. The purpose of this slide is to highlight the estimated cost of various training components, such as instructors cost, training material cost, etc. Present the topic in a bit more detail with this Infrastructure As Code Training Program Budget Infrastructure As Code Adoption Strategy. Use it as a tool for discussion and navigation on Cost Breakup Of Infrastructure, Code Awareness, Mitigation Training Program, Training Material Cost. This template is free to edit as deemed fit for your organization. Therefore download it now.
-
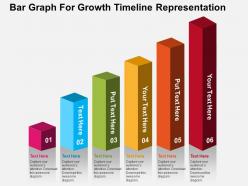 Bar graph for growth timeline representation flat powerpoint design
Proofing and editing can be done with ease in PPT design. Presentation slide is of utmost use to management professionals, big or small organizations and business startups. Smooth functioning is ensured by the presentation slide show on all software’s. When projected on the wide screen the PPT layout does not sacrifice on pixels or color resolution. Can be used by the teachers, businessmen, managers and other professionals to have a setup to highlight different characteristics. Supports good compatibly with the Google slides.
-
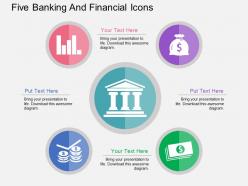 Kk five banking and financial icons flat powerpoint design
Presenting kk five banking and financial icons flat powerpoint design. This Power Point template diagram has been crafted with graphic of five banking and finance icons. This PPT diagram contains the concept of banking solutions and financial process flow indication .Use this PPT diagram for business and finance related presentations.
-
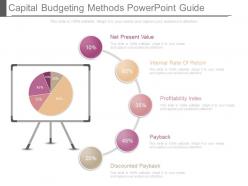 New capital budgeting methods powerpoint guide
High resolution PPT diagrams. 100 percent editable format. Easy inclusion and exclusion of information as per individual choice. Adaptable and convertible into various formats. Simple to download. For more of personalization one may easily add the company name, logo or trademark. Productive set of PowerPoint icon images for entrepreneurs, investors, internal and external stakeholders, researchers, business analysts and education professionals. The stages in this process are net present value, internal rate of return, profitability index, payback, discounted payback.
-
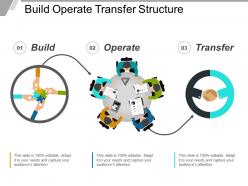 Build operate transfer structure
Presenting Build Operate Transfer Structure which is designed professionally for your convenience. Freely access this slide in both 4:3 and 16:9 aspect ratio. You can alter the font, color, font size, and font types of the slides as per your needs. This template is compatible with Google Slides which makes it easily accessible at once. Open and save your presentation in various formats like PDF, JPG, and PNG.
-
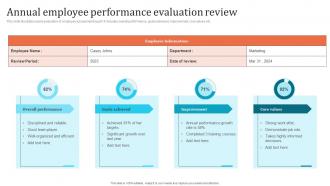 Annual Employee Performance Evaluation Review
This slide illustrates yearly evaluation of employee assessment report. It includes overall performance, goals achieved, improvement, core values etc. Presenting our well structured Annual Employee Performance Evaluation Review. The topics discussed in this slide are Goals Achieved, Core Values. This is an instantly available PowerPoint presentation that can be edited conveniently. Download it right away and captivate your audience.
-
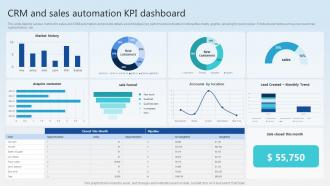 CRM And Sales Automation KPI Dashboard
This slide depicts various metrics for sales and CRM automation and provide details about displays key performance indicators in interactive charts, graphs, allowing for quick review. It include elements such as new customer, market history, etc. Presenting our well structured CRM And Sales Automation KPI Dashboard. The topics discussed in this slide are Acquire Costumer, Sale Funnel, Market History. This is an instantly available PowerPoint presentation that can be edited conveniently. Download it right away and captivate your audience.
-
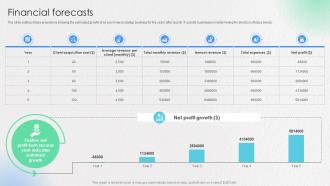 Financial Forecasts Ecommerce Startup Go To Market Strategy GTM SS
The slide outlines future projections showing the estimated growth of an ecommerce startup business for five years after launch. It assists businesses in determining the direction of future trends. Deliver an outstanding presentation on the topic using this Financial Forecasts Ecommerce Startup Go To Market Strategy GTM SS Dispense information and present a thorough explanation of Financial Forecasts using the slides given. This template can be altered and personalized to fit your needs. It is also available for immediate download. So grab it now.
-
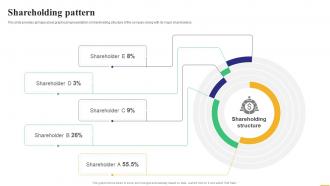 Shareholding Pattern Instamojo Investor Funding Elevator Pitch Deck
This slide provides glimpse about graphical representation of shareholding structure of the company along with its major shareholders. Deliver an outstanding presentation on the topic using this Shareholding Pattern Instamojo Investor Funding Elevator Pitch Deck Dispense information and present a thorough explanation of Shareholding Pattern using the slides given. This template can be altered and personalized to fit your needs. It is also available for immediate download. So grab it now.
-
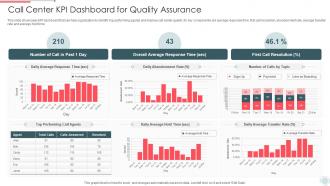 Call Center Kpi Dashboard For Quality Assurance
This slide showcases review sheet that can help call center to review the performance of customer service agents and take actions to improve the call quality. Its key components are call handling skills, problem solving skills and closure of call. This slide showcases KPI dashboard that can help organization to identify top performing agents and improve call center quality. Its key components are average response time, first call resolution, abandonment rate, average transfer rate and average hold time. Introducing our Call Center Kpi Dashboard For Quality Assurance set of slides. The topics discussed in these slides are Call Center Kpi Dashboard For Quality Assurance. This is an immediately available PowerPoint presentation that can be conveniently customized. Download it and convince your audience.
-
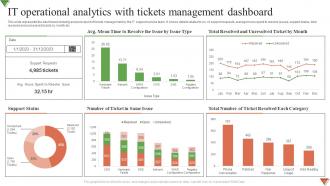 IT Operational Analytics With Tickets Management Dashboard
This slide represents the dashboard showing analysis report of tickets management by the IT support service team. It shows details related to no. of support requests, average hours spent to resolve issues, support status, total resolved and unresolved tickets by month etc. Introducing our IT Operational Analytics With Tickets Management Dashboard set of slides. The topics discussed in these slides are Resolve Issue, Ticket Resolved, Support Status. This is an immediately available PowerPoint presentation that can be conveniently customized. Download it and convince your audience.
-
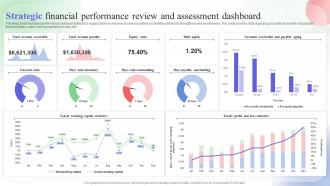 Strategic Financial Performance Review And Assessment Dashboard
Following slide illustrates performance dashboard utilized by organizations to improve business position by identifying financial strengthens and weaknesses. This slide provides data regarding accounts receivable and payable, financial ratios, yearly working capital summary, etc. Introducing our Strategic Financial Performance Review And Assessment Dashboard set of slides. The topics discussed in these slides are Equity Ratio, Debt Equity, Current Ratio. This is an immediately available PowerPoint presentation that can be conveniently customized. Download it and convince your audience.
-
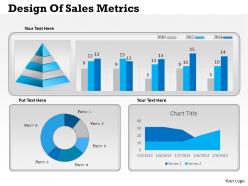 0414 business consulting diagram design of sales metrics powerpoint slide template
We are proud to present our 0414 business consulting diagram design of sales metrics powerpoint slide template. Our 0414 Business consulting diagram Design Of Sales Metrics PowerPoint slide template Powerpoint Templates are the chords of your song. String them along and provide the lilt to your views. Our Finance Powerpoint Templates help you pinpoint your timelines. Highlight the reasons for your deadlines with their use.
-
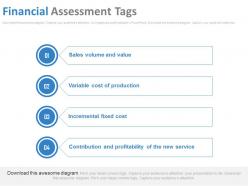 Financial assessment tags ppt slides
PPT slide is useful for businessmen, small or big marketing, finance and auditing professional’s teams. PPT layout has been developed with the use of professional stock photos and smart art design. Presentation slide is compatible with Google slide. It is easy to manage the color, font, size in PowerPoint presentation with no loss of resolution. Works well in Windows 7, 8, 10 and XP. The stages in this process are selling, finance, marketing, strategy, business.
-
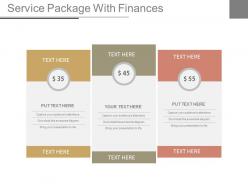 Service package with finances ppt slides
Aesthetically designed and professionally equipped slides. High resolution. Modify the contents at your ease. 100 percent editable slide design. Execute the changes with the provided on slide assistance. Personalize the contents with your company name and logo. Used by managers, marketers, MBA students and other professionals. Impressive picture quality which do not pixelate when projected on wide screen. Compatible with multiple set of software available both online and offline. Compatible with team of format like JPEG, JPG and PDF. The stages in this process are finance, marketing, strategy, symbol, business.
-
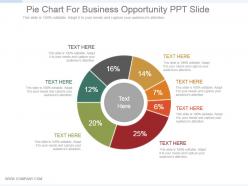 Pie chart for business opportunity ppt slide
Presenting pie chart for business opportunity ppt slide. This is a pie chart for business opportunity ppt slide. This is a seven stage process. The stages in this process are pie, chart, percentage, financials, process.
-
 Weak links and chains powerpoint presentation slides
These high quality, editable pre-designed powerpoint slides have been carefully created by our professional team to help you impress your audience. Each graphic in every slide is vector based and is 100% editable in powerpoint. Each and every property of any slide - color, size, shading etc can be modified to build an effective powerpoint presentation. Use these slides to convey complex business concepts in a simplified manner. Any text can be entered at any point in the powerpoint slide. Simply DOWNLOAD, TYPE and PRESENT!
-
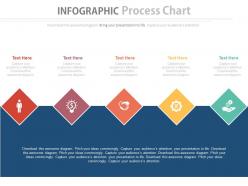 Linear infographics process chart with icons flat powerpoint design
Following block diagram is a representation of a PPT slide which can be used for laying down the concept of financial progress flow representation. The watermark visible in the template is temporary and gets removes when you download it. This design is also compatible with google slides. You can edit the text area and choose different icons.
-
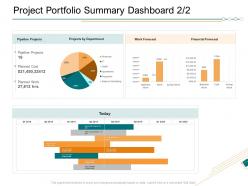 Project portfolio summary dashboard department ppt show influencers
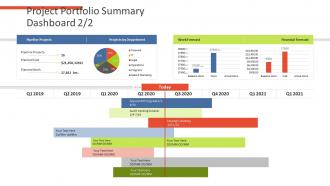
Presenting this set of slides with name Project Portfolio Summary Dashboard Department Ppt Show Influencers. The topics discussed in these slides are Pipeline Projects, Projects By Department, Work Forecast, Financial Forecast. This is a completely editable PowerPoint presentation and is available for immediate download. Download now and impress your audience.
-
 Five activity program powerpoint templates graphics slides 0712
Use this diagram to represent temporal or time dependent data in a meaningful and concise manner.
-
 Customer orientation coordinated effort ppt slides
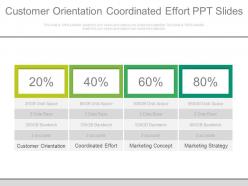
High quality images and visuals used in the PPT design. Fully modifiable Presentation slide as editing is possible. Access to alter the design into JPEG and PDF document. Download is quick and can be easily shared. PowerPoint slides well-suited with Google slides. Template designs available with different nodes and stages. Valuable for corporate executives and sales associates.The stages in this process are customer orientation, coordinated effort, marketing concept, marketing strategy.
-
 Project portfolio summary dashboard financial assets analysis
Deliver an outstanding presentation on the topic using this Project Portfolio Summary Dashboard Financial Assets Analysis. Dispense information and present a thorough explanation of Pipeline Projects, Work Forecast, Financial Forecast, Projects Department using the slides given. This template can be altered and personalized to fit your needs. It is also available for immediate download. So grab it now.
-
 Data security it dashboard snapshot for threat tracking in data security
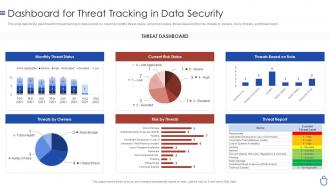
This slide depicts the dashboard snapshot for threat tracking in data security by covering monthly threat status, current risk status, threat-based on the role, threats by owners, risk by threats, and threat report. Deliver an outstanding presentation on the topic using this Data Security IT Dashboard For Threat Tracking In Data Security. Dispense information and present a thorough explanation of Monthly Threat Status, Current Risk Status, Threats Based On Role, Threats Owners, Risk Threats, Threat Report using the slides given. This template can be altered and personalized to fit your needs. It is also available for immediate download. So grab it now.
-
 Social Media Performance Dashboard To Analyze Paid Channel Marketing
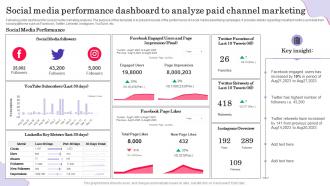
Following slide dashboard for social media marketing analysis. The purpose of this template is to present visuals of the performance of social media advertising campaigns. It provides details regarding important metrics and data from social platforms such as Facebook, Twitter, LinkedIn, Instagram, YouTube, etc. Introducing our Social Media Performance Dashboard To Analyze Paid Channel Marketing set of slides. The topics discussed in these slides are Social Media Followers, Linkedin Key Metrics. This is an immediately available PowerPoint presentation that can be conveniently customized. Download it and convince your audience.
-
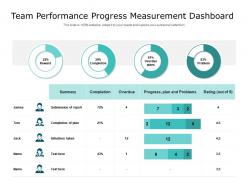 Team performance progress measurement dashboard
Presenting this set of slides with name Team Performance Progress Measurement Dashboard. The topics discussed in these slide is Team Performance Progress Measurement Dashboard. This is a completely editable PowerPoint presentation and is available for immediate download. Download now and impress your audience.
-
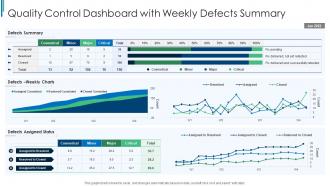 Quality Control Dashboard Snapshot With Weekly Defects Summary
This graph or chart is linked to excel, and changes automatically based on data. Just left click on it and select edit data. Introducing our Quality Control Dashboard Snapshot With Weekly Defects Summary set of slides. The topics discussed in these slides are Defects Summary, Defects Weekly Charts, Defects Assigned Status. This is an immediately available PowerPoint presentation that can be conveniently customized. Download it and convince your audience.
-
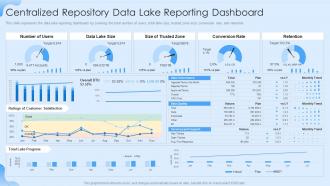 Data Lake Formation Centralized Repository Data Lake Reporting Dashboard
This slide represents the data lake reporting dashboard by covering the total number of users, total lake size, trusted zone size, conversion rate, and retention. Deliver an outstanding presentation on the topic using this Data Lake Formation Centralized Repository Data Lake Reporting Dashboard. Dispense information and present a thorough explanation of Data Lake Size, Conversion Rate, Retention using the slides given. This template can be altered and personalized to fit your needs. It is also available for immediate download. So grab it now.
-
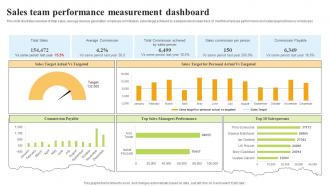 Sales Team Performance Measurement Dashboard
This slide illustrates overview of total sales, average revenue generation, employee commission, sales target achieved by salespersons to keep track of monthly employee performance and sales target achieve by employees. Introducing our Sales Team Performance Measurement Dashboard set of slides. The topics discussed in these slides are Sales Target, Sales Managers Performance, Commission Payable. This is an immediately available PowerPoint presentation that can be conveniently customized. Download it and convince your audience.
-
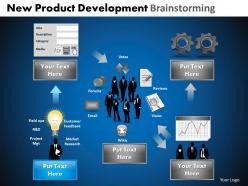 New product development brainstorming powerpoint slides and ppt templates db
These high quality, editable pre-designed powerpoint slides and powerpoint templates have been carefully created by our professional team to help you impress your audience. Each graphic in every powerpoint slide is vector based and is 100% editable in powerpoint.Each and every property of any slide - color, size, shading etc can be modified to build an effective powerpoint presentation. Use these slides to convey complex business concepts in a simplified manner. Any text can be entered at any point in the powerpoint slide. Simply DOWNLOAD, TYPE and PRESENT
-
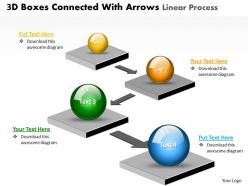 Business powerpoint templates 3d boxes connected with arrows linear circular flow sales ppt slides
Use this Graphical Interface to follow the Correct Path to reach the Destination. This 3D PowerPoint Diagram Shows Four Circular text boxes pointing one to the other defining which Path to follow. This Diagram will make your Presentation Attractive and Delightful to watch.
-
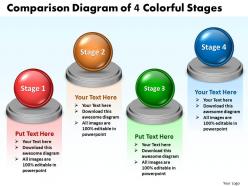 Business powerpoint templates comparison diagram of 4 colorful stages sales ppt slides
This PowerPoint diagram slide shows four opposing views. You can use the This PowerPoint diagram slide to represent views from different functions on an issue.
-
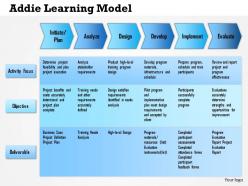 0514 addie learning model powerpoint presentation
Awesome utilization of hues and creatively composed. Absolutely modifiable introduction picture as a few components are editable. Easiness of personalization with your organization name and logo. PPT representation can be downloaded simple with no inconvenience. Transmute into JPG and PDF arrange. Access to comparative plans with various hubs and stages as required. Dexterously formed PowerPoint infographic.
-
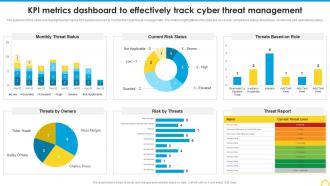 KPI Metrics Dashboard To Effectively Building A Security Awareness Program
The purpose of this slide is to highlight performance KPI dashboard used to monitor the cyber threat management. The metrics highlighted in the slide are risk score, compliance status, threat level, monitoring and operational status. Present the topic in a bit more detail with this KPI Metrics Dashboard To Effectively Building A Security Awareness Program. Use it as a tool for discussion and navigation on Threat Management, Metrics Dashboard. This template is free to edit as deemed fit for your organization. Therefore download it now.
-
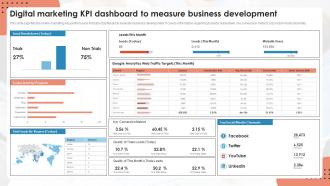 Digital Marketing KPI Dashboard To Measure Business Development
This slide signifies the online marketing key performance indicator dashboard to evaluate business development. It covers information regarding to leads breakdown, key conversion metrics, top social media channels. Introducing our Digital Marketing KPI Dashboard To Measure Business Development set of slides. The topics discussed in these slides are Digital Marketing, KPI Dashboard, Measure Business Development. This is an immediately available PowerPoint presentation that can be conveniently customized. Download it and convince your audience.
-
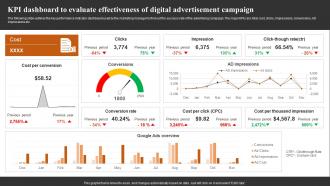 KPI Dashboard To Evaluate Effectiveness Achieving Higher ROI With Brand Development
The following slide outlines the key performance indicator dashboard used by the marketing manager to find out the success rate of the advertising campaign. The major KPIs are total cost, clicks, impressions, conversions, AD impressions etc. Present the topic in a bit more detail with this KPI Dashboard To Evaluate Effectiveness Achieving Higher ROI With Brand Development. Use it as a tool for discussion and navigation on Clicks, Impression, Click Though Rate. This template is free to edit as deemed fit for your organization. Therefore download it now.
-
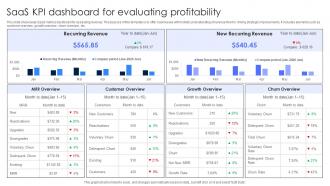 SaaS KPI Dashboard For Evaluating Profitability
This slide showcases SaaS metrics dashboard for assessing revenue. The purpose of this template is to offer businesses with holistic understanding of revenue flow for driving strategic improvements. It includes elements such as customer overview, growth overview, churn overview, etc. Presenting our well structured SaaS KPI Dashboard For Evaluating Profitability. The topics discussed in this slide are Recurring Revenue, New Recurring Revenue, Evaluating Profitability. This is an instantly available PowerPoint presentation that can be edited conveniently. Download it right away and captivate your audience.
-
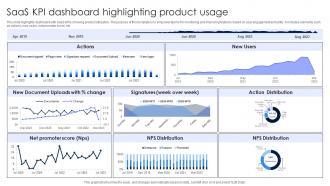 SaaS KPI Dashboard Highlighting Product Usage
This slide highlights dashboard with SaaS KPIs showing product utilization. The purpose of this template is to empower teams for monitoring and improving features based on user engagement and utility. It includes elements such as actions, new users, net promoter score, etc. Introducing our SaaS KPI Dashboard Highlighting Product Usage set of slides. The topics discussed in these slides are New Document Uploads, Net Promoter Score, Product Usage. This is an immediately available PowerPoint presentation that can be conveniently customized. Download it and convince your audience.
-
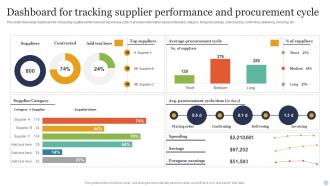 Dashboard For Tracking Supplier Performance And Procurement Cycle
This slide showcases dashboard for measuring supplier performance and purchase cycle. It provides information about contracted, category, foregone savings, order placing, confirming, delivering, invoicing, etc. Presenting our well structured Dashboard For Tracking Supplier Performance And Procurement Cycle. The topics discussed in this slide are Supplier Category, Procurement Cycle Time, Average Procurement. This is an instantly available PowerPoint presentation that can be edited conveniently. Download it right away and captivate your audience.
-
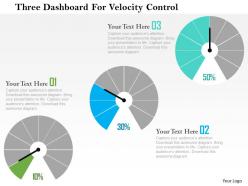 Three dashboard for velocity control flat powerpoint design
Comfortably operate this slide in all software. Smoothly download and use slide. Company logo, trademark or name can be put in for specificity. Project on widescreen without worrying about PPT graphics pixelation. Compatible with google slides. Indicate titles and sub titles without feeling constrained in terms of space. High resolution PPT slides. Useful in automotive businesses, startups and research purposes.
-
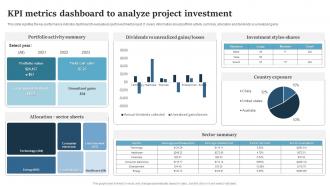 KPI Metrics Dashboard To Analyze Project Investment
This slide signifies the key performance indicator dashboard to evaluate project investment project. It covers information about portfolio activity summary, allocation and dividends vs unrealized gains. Introducing our KPI Metrics Dashboard To Analyze Project Investment set of slides. The topics discussed in these slides are Portfolio Activity Summary, Unrealized Gains, Investment Styles Shares. This is an immediately available PowerPoint presentation that can be conveniently customized. Download it and convince your audience.
-
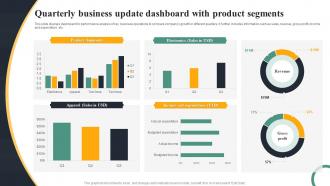 Quarterly Business Update Dashboard With Product Segments
This slide displays dashboard for performance analysis of key business operations to compare companys growth in different quarters. It further includes information such as sales, revenue, gross profit, income and expenditure, etc. Introducing our Quarterly Business Update Dashboard With Product Segments set of slides. The topics discussed in these slides are Product Segments, Income And Expenditure, Electronics. This is an immediately available PowerPoint presentation that can be conveniently customized. Download it and convince your audience.
-
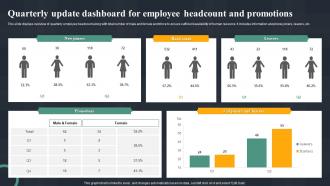 Quarterly Update Dashboard For Employee Headcount And Promotions
This slide displays overview of quarterly employee headcount along with total number of male and female workforce to ensure sufficient availability of human resource. It includes information about new joiners, leavers, etc. Introducing our Quarterly Update Dashboard For Employee Headcount And Promotions set of slides. The topics discussed in these slides are New Joiners, Head Count, Leavers, Promotions. This is an immediately available PowerPoint presentation that can be conveniently customized. Download it and convince your audience.
-
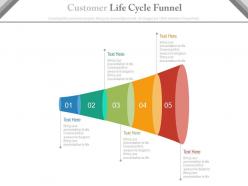 Pptx five staged customer life cycle funnel diagram flat powerpoint design
The slides are created for a powerful display in high resolution enabling a wide range of customization features to transform the template voluntarily. Sync the slides with Google slides for a hassle free showcase. Change the file formats to JPEG, JPG, and PDF. Utilize the ample space for insertion of text, company logo, and watermark replacement.
-
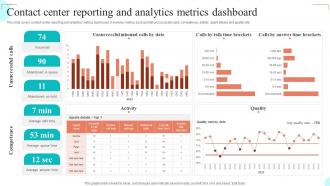 Contact Center Reporting And Analytics Metrics Dashboard
This slide covers contact center reporting and analytics metrics dashboard. It involves metrics such as total unsuccessful calls, competence, activity, agent details and quality rate. Introducing our Contact Center Reporting And Analytics Metrics Dashboard set of slides. The topics discussed in these slides are Unsuccessful Inbound, Talk Time Brackets, Answer Time Brackets This is an immediately available PowerPoint presentation that can be conveniently customized. Download it and convince your audience.
-
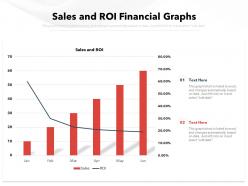 Sales and roi financial graphs
Presenting this set of slides with name Sales And ROI Financial Graphs. The topics discussed in these slide is Sales And ROI Financial Graphs. This is a completely editable PowerPoint presentation and is available for immediate download. Download now and impress your audience.
-
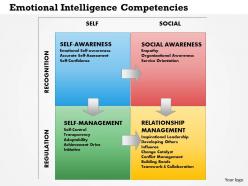 0514 emotional intelligence competencies powerpoint presentation
Handy presentation graphic saves you valuable time. Well Assorted with online software programs such as JPG and PDF. Astounding picture quality as pixels don’t break when viewed in widescreen view. Alike designs obtainable with different nodes and stages. Noteworthy quality presentation visual design. PowerPoint background can be adjusted easily as changes permissible with color and text. Engrave the PPT design with your association sign and title.
-
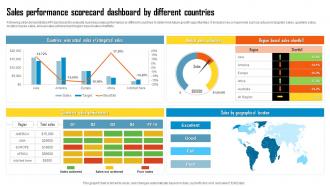 Sales Performance Scorecard Dashboard By Different Countries
Following slide demonstrates KPI dashboard to evaluate business sales performance by different countries to determine future growth opportunities. It includes key components such as actual v or s targeted sales, quarterly sales, location bases sales, annual sales achieved and region based sales shortfalls. Introducing our Sales Performance Scorecard Dashboard By Different Countries set of slides. The topics discussed in these slides are Countries, Actual Sales, Targeted Sales. This is an immediately available PowerPoint presentation that can be conveniently customized. Download it and convince your audience.
-
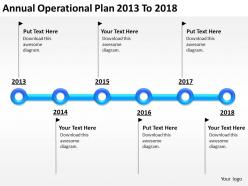 Business network diagram annual operational plan 2013 to 2018 powerpoint templates
We are proud to present our business network diagram annual operational plan 2013 to 2018 powerpoint templates. Use this diagram as a communication tool across the different stages of annual operational plans. This can be used as preferred roadmap to your eager co- travellers and demonstrate clearly how you intend to navigate them towards the desired corporate goal.
-
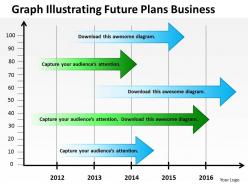 Flow chart business graph illustrating future plans powerpoint templates
We are proud to present our flow chart business graph illustrating future plans powerpoint templates. Use this Timeline Diagram for schedule, Gantt chart, tasks, schedule analysis, schedule activities, project schedule, project, planning, processes, terminal elements, etc. This diagram contains an image of business graph illustrating future plans.
-
 Dashboards by function human resources employee performance dashboard
Present the topic in a bit more detail with this Dashboards By Function Human Resources Employee Performance Dashboard. Use it as a tool for discussion and navigation on Human Resources Employee Performance Dashboard. This template is free to edit as deemed fit for your organization. Therefore download it now.
-
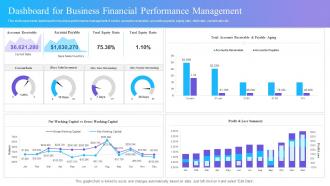 Dashboard For Business Financial Performance Management
This slide represents dashboard for business performance management. It covers accounts receivable, accounts payable, equity ratio, debt ratio, current ratio etc. Introducing our Dashboard For Business Financial Performance Management set of slides. The topics discussed in these slides are Dashboard, Business Financial, Performance Management. This is an immediately available PowerPoint presentation that can be conveniently customized. Download it and convince your audience.
-
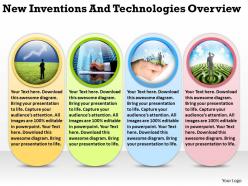 New inventions and technologies overview ppt powerpoint slides
We are proud to present our new inventions and technologies overview ppt powerpoint slides. This diagram features an image of four textboxes representing balanced scorecard overview. These diagram are used to convey concepts regarding strategic performance management, Key Performance Indicators, Corporate governance and Business management systems.
-
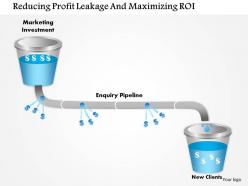 1114 reducing profit leakage and maximizing roi powerpoint presentation
Impressive designing. Well crafted and intelligently portrayed. Thoroughly changeable slide design layout. Ease of customization. Ease of personalization with company specific name, logo and trademark. Compatible with multiple software options. Compatible with numerous formats. High resolution PowerPoint visuals. No fear of image pixilation when projected on wide screen. Applicable amongst large number of marketing professionals, strategists, sales professionals, students and teachers.
-
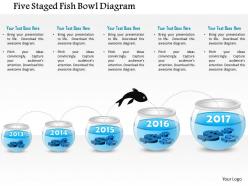 1214 five staged fish bowl diagram powerpoint presentation
PPT slides provide better understand ability without any doubts and confusions. They are displayed in a systematic arrangement for accuracy. Modification is easily possible with color, text and font. You can include company logos and Images to give it a personal touch. PPT template can be display in standard and widescreen view.
-
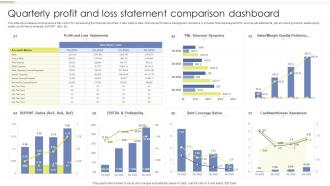 Quarterly Profit And Loss Statement Comparison Dashboard
This slide showcases a comprehensive P and L report for representing the financial outcomes. It also helps to take financial performance management decisions. It includes financial analysis KPIs such as p and l statements, p and l structure dynamics, sales or margin quality performance analysis, DUPONT ratio, etc. Introducing our Quarterly Profit And Loss Statement Comparison Dashboard set of slides. The topics discussed in these slides are Quarterly Profit, Loss Statement, Comparison Dashboard. This is an immediately available PowerPoint presentation that can be conveniently customized. Download it and convince your audience.
-
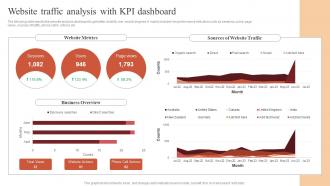 Website Traffic Analysis With Kpi Dashboard Paid Advertising Campaign Management
The following slide depicts the website analysis dashboard to get better visibility over search engines. It mainly includes key performance indicators such as sessions, users, page views, sources of traffic, phone call to actions etc. Present the topic in a bit more detail with this Website Traffic Analysis With Kpi Dashboard Paid Advertising Campaign Management. Use it as a tool for discussion and navigation on Business Overview, Website Metrics. This template is free to edit as deemed fit for your organization. Therefore download it now.
-
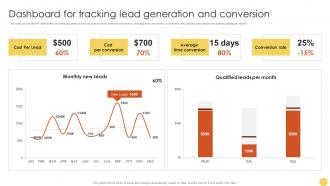 Dashboard For Tracking Lead Advanced Lead Generation Tactics Strategy SS V
This slide covers the KPI dashboard for analyzing metrics such as cost per lead, cost per conversion, average time conversion, conversion rate, monthly new leads, and qualified leads per month. Deliver an outstanding presentation on the topic using this Dashboard For Tracking Lead Advanced Lead Generation Tactics Strategy SS V. Dispense information and present a thorough explanation of Conversion, Average, Conversion using the slides given. This template can be altered and personalized to fit your needs. It is also available for immediate download. So grab it now.
-
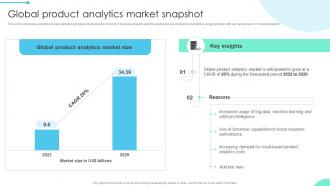 Global Product Enhancing Business Insights Implementing Product Data Analytics SS V
This slide showcase a graphical representation global product analytics market. It includes present and forecasted values of advanced analytics usage globally with key takeaways on market situation. Present the topic in a bit more detail with this Global Product Enhancing Business Insights Implementing Product Data Analytics SS V. Use it as a tool for discussion and navigation on Key Insights, Global Product Analytics, Reasons. This template is free to edit as deemed fit for your organization. Therefore download it now.
-
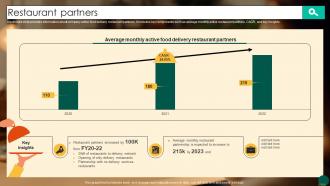 Restaurant Partners Food Ordering Website Company Profile CP SS V
Mentioned slide provides information about company active food delivery restaurant partners. It includes key components such as average monthly active restaurant partners, CAGR, and key insights. Present the topic in a bit more detail with this Restaurant Partners Food Ordering Website Company Profile CP SS V Use it as a tool for discussion and navigation on Restaurant Partners This template is free to edit as deemed fit for your organization. Therefore download it now.


