Finance PowerPoint Templates, Presentation Slide Diagrams & PPT Graphics
- Sub Categories
-
- 30 60 90 Day Plan
- Advertising
- Agile Development
- Aims and Objectives
- Arrows
- Before and After
- Blockchain Bitcoin
- Boxes
- Business
- Calender
- Case Study
- Celebrations
- Certificates
- Challenges Opportunities
- Channel Distribution
- Children
- Communication
- Competitive Landscape
- Computer
- Concepts
- Construction Management
- Corporate
- Crowdfunding
- Current State Future State
- Custom PowerPoint Diagrams
- Digital Transformation
- Dos and Donts
- Economics
- Education
- Environment
- Events
- Festival
- Finance
- Financials
- Food
- Game
- Gap Analysis
- Generic
- Geographical
- Health
- Heatmaps
- Holidays
- Icons
- Input Process Output
- Internet
- Key Messages
- Key Wins
- Ladder
- Leadership
- Lists
- Lucky Draw
- Management
- Marketing
- Measuring
- Medical
- Music
- News
- Next Steps
- People Process Technology
- Pillars
- Planning
- Post-it-Notes
- Problem Statement
- Process
- Proposal Management
- Pros and Cons
- Puzzle
- Puzzles
- Recruitment Strategy
- Religion
- Research and Development
- Risk Mitigation Strategies
- Roadmap
- Selling
- Shapes
- Short Term Long Term
- Social
- Stairs
- Start Stop Continue
- Strategy
- Symbol
- Technology
- Thesis Defense Dissertation
- Timelines
- Traffic
- Transition Plan
- Transportation
- Vehicles
- Venture Capital Funding
- Warning
- Winners
- Word Cloud
-
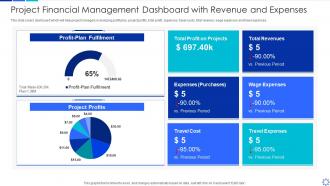 Project financial management dashboard with revenue and expenses
Introducing our Project Financial Management Dashboard With Revenue And Expenses set of slides. The topics discussed in these slides are Project Financial Management Dashboard With Revenue And Expenses. This is an immediately available PowerPoint presentation that can be conveniently customized. Download it and convince your audience.
-
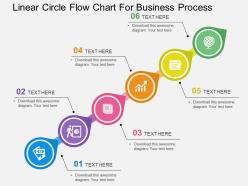 Linear circle flow chart for business process flat powerpoint design
We are proud to present our linear circle flow chart for business process flat powerpoint design. Graphic of linear circle flow chart has been used to craft this power point template diagram. This PPT diagram contains the concept of business process indication .Use this PPT diagram for business and finance related presentations.
-
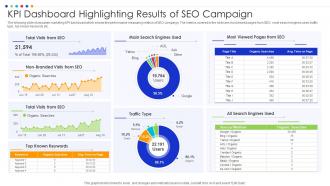 KPI Dashboard Highlighting Results Of SEO Campaign
The following slide showcases marketing KPI dashboard which shows the performance measuring metrics of SEO campaign. The metrics covered in the slide are most viewed pages from SEO, most search engines used, traffic type, top known keywords etc. Presenting our well structured KPI Dashboard Highlighting Results Of SEO Campaign. The topics discussed in this slide are Total Visits From SEO, Main Search Engines Used, Traffic Type, Most Viewed Pages From SEO. This is an instantly available PowerPoint presentation that can be edited conveniently. Download it right away and captivate your audience.
-
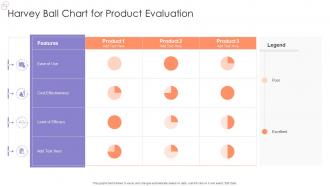 Harvey Ball Chart For Product Evaluation
Introducing our Harvey Ball Chart For Product Evaluation set of slides. The topics discussed in these slides are Level Of Efficacy, Cost Effectiveness, Features. This is an immediately available PowerPoint presentation that can be conveniently customized. Download it and convince your audience.
-
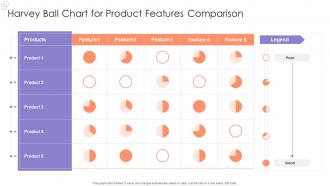 Harvey Ball Chart For Product Features Comparison
Presenting our well-structured Harvey Ball Chart For Product Features Comparison. The topics discussed in this slide are Harvey Ball Chart, Product Features Comparison. This is an instantly available PowerPoint presentation that can be edited conveniently. Download it right away and captivate your audience.
-
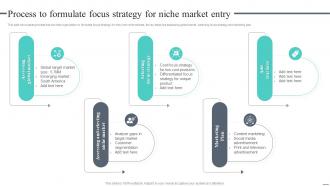 Process To Formulate Focus Cost Leadership Strategy Offer Low Priced Products Niche Market
This slide showcases process that can help organization to formulate focus strategy for entry into niche markets. Its key steps are assessing global market, selecting focus strategy and marketing plan.Introducing Process To Formulate Focus Cost Leadership Strategy Offer Low Priced Products Niche Market to increase your presentation threshold. Encompassed with five stages, this template is a great option to educate and entice your audience. Dispence information on Target Market, Emerging Market, Differentiated Focus, using this template. Grab it now to reap its full benefits.
-
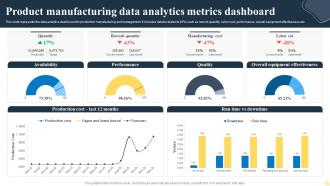 Product Manufacturing Data Analytics Metrics Dashboard
This slide represents the data analytics dashboard for production manufacturing and management. It includes details related to KPIs such as rework quantity, labor cost, performance, overall equipment effectiveness etc. Introducing our Product Manufacturing Data Analytics Metrics Dashboard set of slides. The topics discussed in these slides are Availability, Performance, Overall Equipment Effectiveness. This is an immediately available PowerPoint presentation that can be conveniently customized. Download it and convince your audience.
-
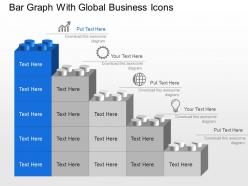 Bar graph with global business icons powerpoint template slide
Extraordinary and unique PPT presentation slides. Result and action oriented patterns. High-quality bold graphics to impress the viewers. Creates transparency of the motive and objective of the presentation. Runs smoothly with all the software’s. Can be easily converted to JPG and PDF format. Extremely flexible and reliable templates. Allows complete modification by any user at any point of time.
-
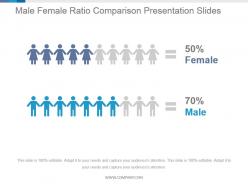 Male female ratio comparison presentation slides
Presenting male female ratio comparison presentation slides. This is a male female ratio comparison presentation slides. This is a two stage process. The stages in this process are female, male.
-
 Hospital KPI Dashboard Depicting Total Patients
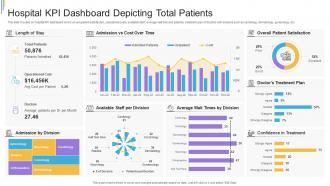
This slide focuses on hospital KPI dashboard which covers patient satisfaction, operational costs, available staff, average wait time and patients, treatment plan of doctors with divisions such as cardiology, dermatology, gynecology, etc. Presenting our well structured Hospital KPI Dashboard Depicting Total Patients. The topics discussed in this slide are Operational Cost, Total Patients, Available Staff Per Division, Average Wait Times By Division, Overall Patient Satisfaction, Doctors Treatment Plan, Confidence In Treatment. This is an instantly available PowerPoint presentation that can be edited conveniently. Download it right away and captivate your audience.
-
 Business Disaster Risk Cause Pie Chart
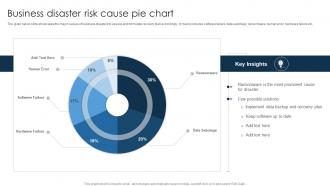
The given below slide showcases the major causes of business disasters to assess and formulate recovery plan accordingly. It mainly includes software failure, data sabotage, ransomware, human error, hardware failure etc. Introducing our Business Disaster Risk Cause Pie Chart set of slides. The topics discussed in these slides are Ransomware, Few Possible Solutions, Keep Software. This is an immediately available PowerPoint presentation that can be conveniently customized. Download it and convince your audience.
-
 Key Statistics Showing Importance Of Brand Messaging
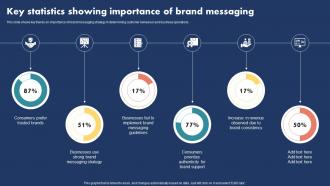
This slide shows key trends on importance of brand messaging strategy in determining customer behaviour and business operations. Presenting our well structured Key Statistics Showing Importance Of Brand Messaging The topics discussed in this slide are Consumers Prefer Trusted Brands, Businesses Strong Brand Messaging Strategy This is an instantly available PowerPoint presentation that can be edited conveniently. Download it right away and captivate your audience.
-
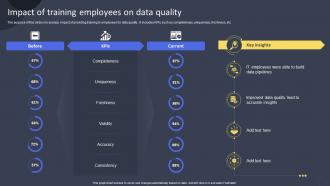 Impact Of Training Employees On Data Quality Guide For Training Employees On AI DET SS
The purpose of this slide is to analyze impact of providing training to employees for data quality. It includes KPIs such as completeness, uniqueness, freshness, etc. Present the topic in a bit more detail with this Impact Of Training Employees On Data Quality Guide For Training Employees On AI DET SS. Use it as a tool for discussion and navigation on Consistency, Accuracy, Uniqueness. This template is free to edit as deemed fit for your organization. Therefore download it now.
-
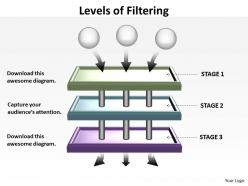 Levels of filtering powerpoint slides presentation diagrams templates
We are proud to present our levels of filtering powerpoint slides presentation diagrams templates. This PowerPoint diagram shows stages of filtration process. This diagram can be used in used in strategy, consulting and marketing presentations. Elucidate on your thoughts and ideas to achieve the common aim with Excellence.
-
 Stock Pitch For Restaurants Powerpoint Presentation Slides
Our Stock Pitch For Restaurants Powerpoint Presentation Slides is the perfect way to pitch your stock. We have researched thousands of stock pitches and designed the most impactful way to convince your investors to invest in your equity.
-
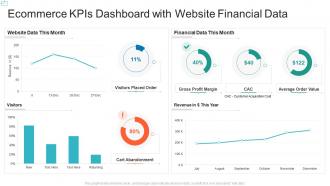 Ecommerce kpis dashboard snapshot with website financial data
Presenting our well structured Ecommerce KPIs Dashboard Snapshot With Website Financial Data. The topics discussed in this slide are Financial, Revenue, Gross Profit Margin. This is an instantly available PowerPoint presentation that can be edited conveniently. Download it right away and captivate your audience.
-
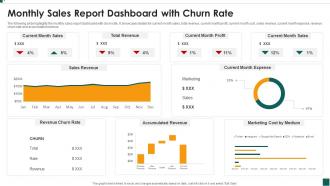 Monthly Sales Report Dashboard Snapshot With Churn Rate
The following slide highlights the monthly sales report dashboard snapshot with churn rate. It showcases details for current month sales, total revenue, current month profit, current month cost, sales revenue, current month expense, revenue churn rate and accumulated revenue. Presenting our well structured Monthly Sales Report Dashboard With Churn Rate. The topics discussed in this slide are Current Month Sales, Total Revenue, Current Month Expense. This is an instantly available PowerPoint presentation that can be edited conveniently. Download it right away and captivate your audience.
-
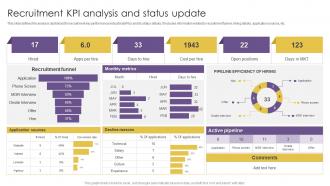 Recruitment KPI Analysis And Status Update
This slide defines the analysis dashboard for recruitment key performance indicators KPIs and its status details. It includes information related to recruitment funnel, hiring details, application sources, etc. Introducing our Recruitment KPI Analysis And Status Update set of slides. The topics discussed in these slides are Recruitment, KPI Analysis, Status Update. This is an immediately available PowerPoint presentation that can be conveniently customized. Download it and convince your audience.
-
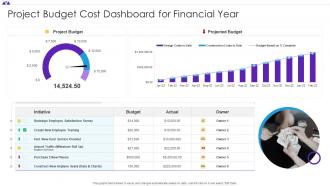 Project Budget Cost Dashboard Snapshot For Financial Year
This graph or chart is linked to excel, and changes automatically based on data. Just left click on it and select Edit Data. Presenting our well structured Project Budget Cost Dashboard Snapshot For Financial Year. The topics discussed in this slide are Project Budget, Projected Budget, Employee Satisfaction. This is an instantly available PowerPoint presentation that can be edited conveniently. Download it right away and captivate your audience.
-
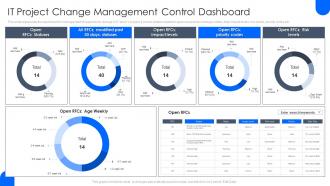 IT Project Change Management Control Dashboard
This slide represents the dashboard for management of requests for change in IT teams project. It shows details related to open requests for changes status, their impact levels, risk levels, priority codes etc. Introducing our IT Project Change Management Control Dashboard set of slides. The topics discussed in these slides are Risk Levels, Priority Codes, Control Dashboard. This is an immediately available PowerPoint presentation that can be conveniently customized. Download it and convince your audience.
-
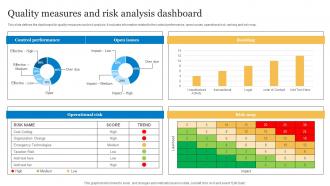 Quality Measures And Risk Analysis Dashboard
This slide defines the dashboard for quality measures and risk analysis. It includes information related to the control performance, open issues, operational risk, ranking and risk map. Presenting our well structured Quality Measures And Risk Analysis Dashboard. The topics discussed in this slide are Control Performance, Open Issues, Operational Risk. This is an instantly available PowerPoint presentation that can be edited conveniently. Download it right away and captivate your audience.
-
 6 Months Digital Promotion Plan For Real Estate Agency
This slide shows activities for promoting real estate agencies among potential buyers in systematic way over half year. It include activities such as conduct market research, implement email marketing campaigns, etc. Presenting our set of slides with 6 Months Digital Promotion Plan For Real Estate Agency. This exhibits information on three stages of the process. This is an easy to edit and innovatively designed PowerPoint template. So download immediately and highlight information on Market Research Stage, Implementation Stage, Expansion Stage.
-
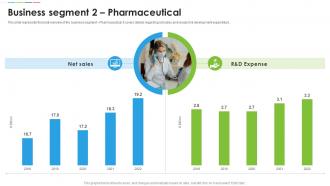 Bayer Company Profile Business Segment 2 Pharmaceutical Ppt Slides CP SS
This slide represents financial overview of the business segment Pharmaceutical. It covers details regarding net sales and research and development expenditure. Deliver an outstanding presentation on the topic using this Bayer Company Profile Business Segment 2 Pharmaceutical Ppt Slides CP SS. Dispense information and present a thorough explanation of Net Sales, Expense using the slides given. This template can be altered and personalized to fit your needs. It is also available for immediate download. So grab it now.
-
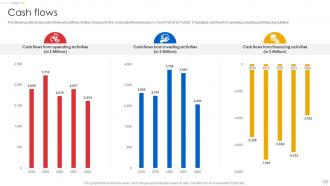 Ebay Company Profile Cash Flows Ppt Rules CP SS
The following slide shows cash inflows and outflows of eBay company for five consecutive financial years i.e. from FY2018 to FY2022. It highlights cash flow from operating, investing and financing activities. Present the topic in a bit more detail with this Ebay Company Profile Cash Flows Ppt Rules CP SS. Use it as a tool for discussion and navigation on Cash Flows. This template is free to edit as deemed fit for your organization. Therefore download it now.
-
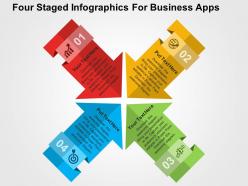 Four staged infographics for business apps flat powerpoint design
Delicately projected PPT template congruous for the business and marketing management scholars etc., Conversant with all Google slides and different software functions, sleek and smooth downloading available which saves time, Rebuild able backgrounds , style, matter, figures etc, easily insert able company name or logo, emblem or trademark, High quality PPT visuals.
-
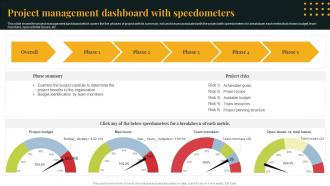 Project Management Dashboard With Speedometers
This slide shows the project management dashboard which covers the five phases of project with its summary, risk and issues associated with the project with speedometers for breakdown each metric that shows budget, team members, open ad total issues, etc. Introducing our Project Management Dashboard With Speedometers set of slides. The topics discussed in these slides are Achievable Goals, Available Budget, Team Resources, Project Planning Structure This is an immediately available PowerPoint presentation that can be conveniently customized. Download it and convince your audience.
-
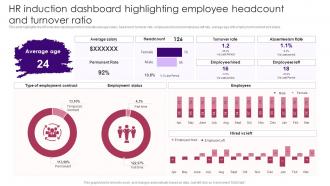 HR Induction Dashboard Highlighting Employee Headcount Staff Induction Training Guide
This slide highlights the HR induction dashboard which includes average salary, headcount, turnover rate, employees hired and employees left rate, average age with employment contract and status. Present the topic in a bit more detail with this HR Induction Dashboard Highlighting Employee Headcount Staff Induction Training Guide. Use it as a tool for discussion and navigation on Type Employment Contract, Employment Status, Employees. This template is free to edit as deemed fit for your organization. Therefore download it now.
-
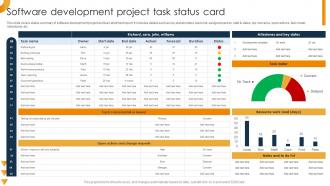 Software Development Project Task Status Card
This slide covers status summary of software development project and task allotment report. It includes details such as key stakeholders, tasks list, assigned person, start and dates, top concerns, open actions, task meter, milestones, etc. Presenting our well structured Software Development Project Task Status Card. The topics discussed in this slide are Software Development, Project Task Status Card, Resource Work. This is an instantly available PowerPoint presentation that can be edited conveniently. Download it right away and captivate your audience.
-
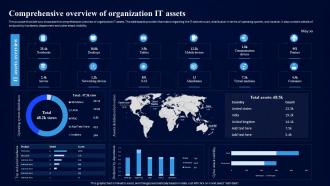 Cybersecurity Risk Assessment Program Comprehensive Overview Of Organization IT Assets
The purpose this slide is to showcase the comprehensive overview of organization IT assets. The dashboards provide information regarding the IT devices count, distribution in terms of operating system, and location. It also contains details of endpoint by hardware, department and cyber attack visibility. Deliver an outstanding presentation on the topic using this Cybersecurity Risk Assessment Program Comprehensive Overview Of Organization IT Assets. Dispense information and present a thorough explanation of Comprehensive Overview, Organization IT Assets, Dashboards, Operating System using the slides given. This template can be altered and personalized to fit your needs. It is also available for immediate download. So grab it now.
-
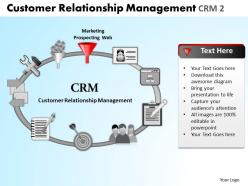 Customer relationship management crm 2 powerpoint slides and ppt templates db
These high quality, editable pre-designed powerpoint slides and powerpoint templates have been carefully created by our professional team to help you impress your audience. Each graphic in every powerpoint slide is vector based and is 100% editable in powerpoint.Each and every property of any slide - color, size, shading etc can be modified to build an effective powerpoint presentation. Use these slides to convey complex business concepts in a simplified manner. Any text can be entered at any point in the powerpoint slide. Simply DOWNLOAD, TYPE and PRESENT
-
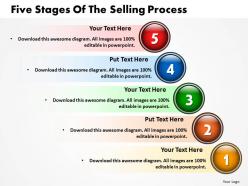 Five stages of the selling process powerpoint templates ppt presentation slides 812
Highlight the key point in selling process with this diagram
-
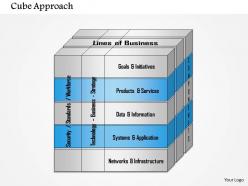 0514 ea3 cube approach powerpoint presentation
Compatibility with multiple software options available both online and offline. Compatibility with numerous formats like JPEG, JPG and PNG. Ease of download. Thoroughly editable slide design. Ease of executing changes. Freedom to customize and personalize with company specific trademark, logo or name. Add or exclude slide content as per the need. High resolution slide visuals do not pixelate when projected on wide screen. Used by marketing analysts, researchers, students and teachers.
-
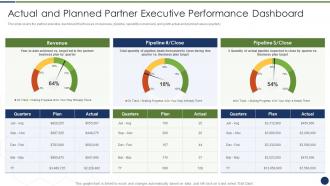 Improve management complex business actual planned partner executive performance
This slide covers the partner executive dashboard that focuses on revenues, pipeline, capability scoreboard, along with actual and planned values quarterly. Present the topic in a bit more detail with this Improve Management Complex Business Actual Planned Partner Executive Performance. Use it as a tool for discussion and navigation on Revenue, Pipeline, Quarters, Plan, Actual. This template is free to edit as deemed fit for your organization. Therefore download it now.
-
 Text boxes editable powerpoint slides templates infographics images 1121
This PowerPoint diagram is particularly useful for displaying how a process currently functions or could ideally function in text boxes.
-
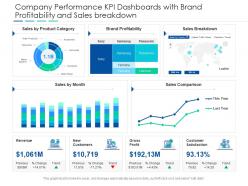 Company performance kpi dashboards with brand profitability and sales breakdown powerpoint template
This is a Company Performance KPI Dashboards With Brand Profitability And Sales Breakdown Powerpoint Template that you can use to present real-time information about your business. With a variety of graphical representations that are in-line with the current trends, this is a great way to display quantified data and stats. This is also a great PowerPoint slide to make informed decisions based on the data and results depicted. Since this template can accommodate a lot of statistical information in one-go it can be put to use by different department heads of the organization. This PPT slide can also be used to present a thorough discussion on various KPIs, all excel-linked and susceptible to innumerable changes. Thus helping in the portrayal of calculative data in a highly professional format. Not only this, but it can also be reproduced in JPG, PNG, and PDF formats. Therefore, reinvent the wheel by downloading this PPT slide now.
-
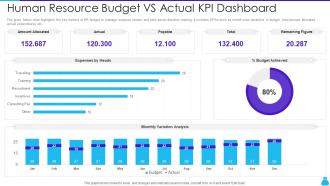 Human Resource Budget Vs Actual KPI Dashboard Snapshot
The given below slide highlights the key metrics of HR budget to manage expense stream and take assist decision making. It includes KPAs such as month wise variations in budget, total amount allocated, actual expenditures etc. Presenting our well-structured Human Resource Budget Vs Actual KPI Dashboard Snapshot. The topics discussed in this slide are Amount Allocated, Budget Achieved, Variation Analysis. This is an instantly available PowerPoint presentation that can be edited conveniently. Download it right away and captivate your audience.
-
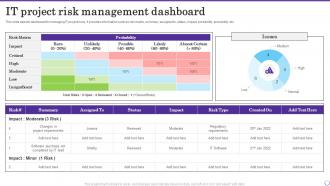 IT Project Risk Management Dashboard
This slide depicts dashboard for managing IT project risks. It provides information such as risk matrix, summary, assigned to, status, impact, probability, probability, etc. Presenting our well structured IT Project Risk Management Dashboard. The topics discussed in this slide are project risk, management dashboard, Probability. This is an instantly available PowerPoint presentation that can be edited conveniently. Download it right away and captivate your audience.
-
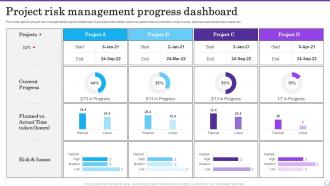 Project Risk Management Progress Dashboard
This slide depicts project risk management progress dashboard. It provides information about key performance indicators, risks, issues, planned and actual hours spent, etc. Introducing our Project Risk Management Progress Dashboard set of slides. The topics discussed in these slides are Projects, Current Progress, progress dashboard. This is an immediately available PowerPoint presentation that can be conveniently customized. Download it and convince your audience.
-
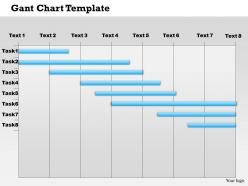 0514 gantt chart template powerpoint presentation
PowerPoint graphic can be edited easily as access to change color, text and layout. Similar PowerPoint images accessible with different nodes and stages. Works well with online software programs such as JPG and PDF. Exceptional picture quality as pixels don’t break when viewed in widescreen view. Engrave the presentation with your association sign and designation. Presentation background well-matched with Google slides.
-
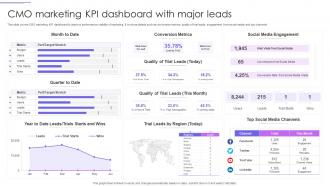 CMO Marketing KPI Dashboard With Major Leads
This slide covers CMO marketing KPI dashboard to improve performance visibility of marketing. It involves details such as conversion metrics, quality of trial leads, engagement from social media and top channels. Introducing our CMO Marketing KPI Dashboard With Major Leads set of slides. The topics discussed in these slides are Conversion Metrics, Social Media Engagement, Trial Leads. This is an immediately available PowerPoint presentation that can be conveniently customized. Download it and convince your audience.
-
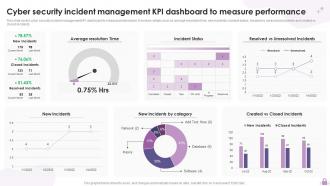 Cyber Security Incident Management KPI Dashboard To Measure Performance
This slide covers cyber security incident management KPI dashboard to measure performance. It involves details such as average resolution time, new incidents, incident status, resolved vs unresolved incidents and created vs closed incidents. Introducing our Cyber Security Incident Management KPI Dashboard To Measure Performance set of slides. The topics discussed in these slides are Cyber Security, Incident Management, KPI Dashboard, Measure Performance. This is an immediately available PowerPoint presentation that can be conveniently customized. Download it and convince your audience.
-
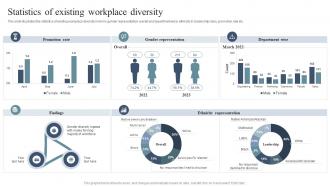 Statistics Of Existing Workplace Diversity Diversity Equity And Inclusion Enhancement
This slide illustrates the statistics of existing workplace diversity in terms gender representation overall and department wise, ethnicity in leadership roles, promotion rate etc. Present the topic in a bit more detail with this Statistics Of Existing Workplace Diversity Diversity Equity And Inclusion Enhancement. Use it as a tool for discussion and navigation on Gender Representation, Department Wise, Ethnicity Representation. This template is free to edit as deemed fit for your organization. Therefore download it now.
-
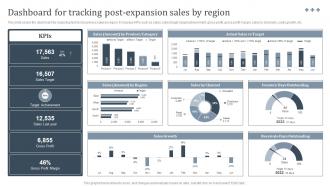 Dashboard For Tracking International Strategy To Expand Global Strategy SS V
This slide covers the dashboard for analyzing fast food business sales by region. It includes KPIs such as sales, sales target, target achievement, gross profit, gross profit margin, sales by channels, sales growth, etc. Deliver an outstanding presentation on the topic using this Dashboard For Tracking International Strategy To Expand Global Strategy SS V. Dispense information and present a thorough explanation of Tracking, Sales, Actual using the slides given. This template can be altered and personalized to fit your needs. It is also available for immediate download. So grab it now.
-
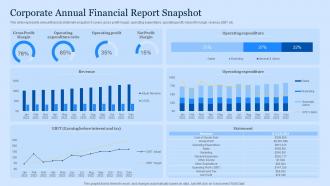 Corporate Annual Financial Report Snapshot
This slide represents annual financial statement snapshot. It covers gross profit margin, operating expenditure, operating profit, net profit margin, revenue, EBIT etc. Presenting our well structured Corporate Annual Financial Report Snapshot. The topics discussed in this slide are Gross Profit Margin, Operating Expenditure Ratio, Operating Profit. This is an instantly available PowerPoint presentation that can be edited conveniently. Download it right away and captivate your audience.
-
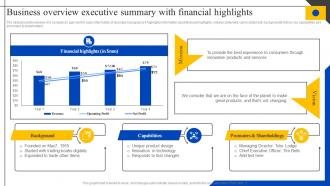 Business Overview Executive Summary With Financial Steps To Perform Competitor MKT SS V
The slide presents overview of a company to gain brief of basic information of business background. It highlights information about financial highlights, mission statement, vision statement, background and history, key capabilities and promoters and stakeholders. Deliver an outstanding presentation on the topic using this Business Overview Executive Summary With Financial Steps To Perform Competitor MKT SS V. Dispense information and present a thorough explanation of Financial Highlights, Background, Capabilities, Promoters And Shareholdings using the slides given. This template can be altered and personalized to fit your needs. It is also available for immediate download. So grab it now.
-
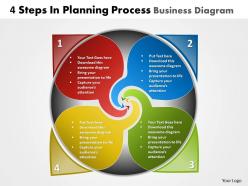 Business powerpoint templates 4 steps planning circular direction diagram sales ppt slides
This Rangoli Based PowerPoint Diagram shows the four step planning process in Circular Manner. It shows four Phases required in any Process related to Business. Use this Fascinating Diagram to make your Presentation delightful.
-
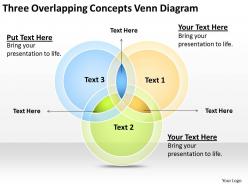 Business flowchart examples three overlapping concepts venn diagram powerpoint templates
Access to customize the entire ribbon of the slide icon. Allow to adjust the aspect ratio or the cropping of images. Offer insertion of elements from online platforms. Enjoy removing background and redesigning it. Functional for the business managers, marketing people, developers and relevant employees.
-
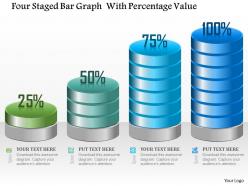 1214 four staged bar graph with percentage value powerpoint template
Simple to incorporate company name, logo, trademark and animation. Free of space constraints to mention titles and subtitles. Customize PPT layout, font, text, color and design as per your style. Can be easily converted to PDF or JPG formats. High-resolution PowerPoint slides graphics. We have crafted this PPT keeping in mind the professional requirement from the professional designers.
-
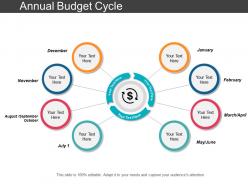 Annual budget cycle
Presenting this Annual Budget Cycle PowerPoint presentation. Include charts and graphs for a better representation of facts and figures. The PPT supports the standard (4:3) and widescreen (16:9) sizes. It is also compatible with Google Slides. Save this into various images or document formats like JPEG, PNG or PDF. High-quality graphics ensure that quality is always retained.
-
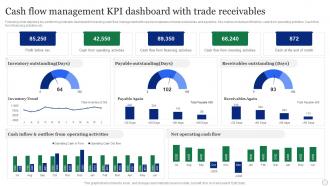 Cash Flow Management KPI Dashboard With Trade Receivables
Following slide depicts a key performing indicator dashboard for tracking cash flow management with special emphasis on trade receivables and payables. Key metrics include profit before, cash from operating activities, Cash flow from financing activities etc. Introducing our Cash Flow Management KPI Dashboard With Trade Receivables set of slides. The topics discussed in these slides are Inventory Outstanding, Payable Outstanding, Receivables Outstanding. This is an immediately available PowerPoint presentation that can be conveniently customized. Download it and convince your audience.
-
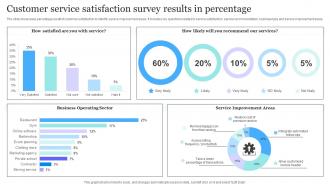 Customer Service Satisfaction Survey Results In Percentage
The slide showcases percentage result of customer satisfaction to identify service improvement areas. It includes key questions related to service satisfaction, service recommendation, business type and service improvement areas. Introducing our Customer Service Satisfaction Survey Results In Percentage set of slides. The topics discussed in these slides are Customer, Service, Results. This is an immediately available PowerPoint presentation that can be conveniently customized. Download it and convince your audience.
-
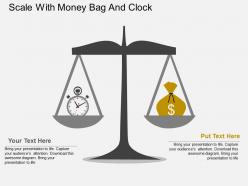 Scale with money bag and clock flat powerpoint design
All images are 100% editable in the presentation design. Good quality images can be used to compliment and reinforce message. Works well in Windows 7, 8, 10, XP, Vista and Citrix. Editing in presentation slide show can be done from anywhere by any device. Students, teachers, businessmen or industrial managers can put to use the PPT layout as per their requirement.
-
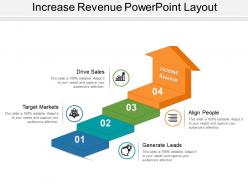 Increase revenue powerpoint layout
Presenting increase revenue powerpoint layout. This is a increase revenue powerpoint layout. This is a four stage process. The stages in this process are increase revenue, increase sales, growth.
-
 Ribbons powerpoint design
Presenting this set of slides with name - Ribbons Powerpoint Design. This is a two stage process. The stages in this process are Red Ribbon, Red Banners.
-
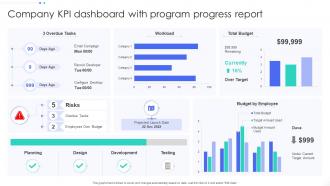 Company KPI Dashboard Snapshot With Program Progress Report
This graph or chart is linked to excel, and changes automatically based on data. Just left click on it and select Edit Data. Introducing our Company KPI Dashboard Snapshot With Program Progress Report set of slides. The topics discussed in these slides are 3 Overdue Tasks, Total Budget, Budget By Employee. This is an immediately available PowerPoint presentation that can be conveniently customized. Download it and convince your audience.
-
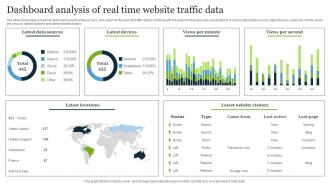 Dashboard Analysis Of Real Time Website Traffic Data
The slide showcases a real time dashboard used to analyse, track, and report on the website traffic data in real time with the help of interactive data visualizations. It covers latest data sources, latest devices, views per minute, views per second, latest locations and latest website visitors. Introducing our Dashboard Analysis Of Real Time Website Traffic Data set of slides. The topics discussed in these slides are Latest Devices, Views Per Minute, Dashboard Analysis. This is an immediately available PowerPoint presentation that can be conveniently customized. Download it and convince your audience.
-
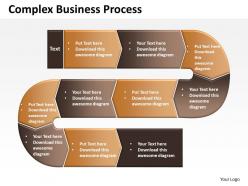 Complex business process powerpoint templates ppt presentation slides 0812
This PowerPoint diagram slide has the classic Business process representation. Highly useful in most sales and marketing presentations. The colors are editable
-
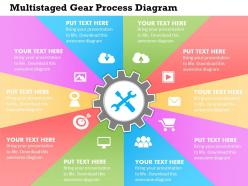 0414 business consulting diagram multistaged gear process diagram powerpoint slide template
We are proud to present our 0414 business consulting diagram multistaged gear process diagram powerpoint slide template. Activate The Energies Of Your Audience With Our Business consulting diagram multistage gear process diagram PowerPoint slide template Power Point Templates. Get Their Creative Juices Flowing With Your Words. Enhance The Stature Of Your Presentation With Our Arrows Power Point Templates. Adorn The Beauty Of Your Thoughts With Their Colorful Backgrounds.
-
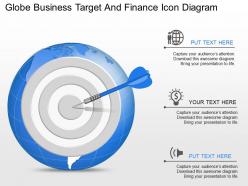 Oc globa business target and finance icon diagram powerpoint template
Presentation slide is beneficial for marketing, sales team and businessmen. Offers consistent and simple design which fits varying content presentation. Images can be added resized, colored and reversed. Color, style and position can be standardized, supports font size which can be read from a distance. Compatible with PowerPoint for windows and Mac as well as Google slide.
-
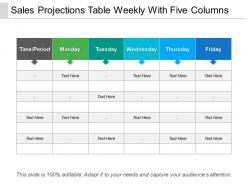 Sales projections table weekly with five columns
Presenting sales projections table weekly with five columns. This is a sales projections table weekly with five columns. This is a six stage process. The stages in this process are forecast revenue, sales projections, sales forecast.


