Finance PowerPoint Templates, Presentation Slide Diagrams & PPT Graphics
- Sub Categories
-
- 30 60 90 Day Plan
- Advertising
- Agile Development
- Aims and Objectives
- Arrows
- Before and After
- Blockchain Bitcoin
- Boxes
- Business
- Calender
- Case Study
- Celebrations
- Certificates
- Challenges Opportunities
- Channel Distribution
- Children
- Communication
- Competitive Landscape
- Computer
- Concepts
- Construction Management
- Corporate
- Crowdfunding
- Current State Future State
- Custom PowerPoint Diagrams
- Digital Transformation
- Dos and Donts
- Economics
- Education
- Environment
- Events
- Festival
- Finance
- Financials
- Food
- Game
- Gap Analysis
- Generic
- Geographical
- Health
- Heatmaps
- Holidays
- Icons
- Input Process Output
- Internet
- Key Messages
- Key Wins
- Ladder
- Leadership
- Lists
- Lucky Draw
- Management
- Marketing
- Measuring
- Medical
- Music
- News
- Next Steps
- People Process Technology
- Pillars
- Planning
- Post-it-Notes
- Problem Statement
- Process
- Proposal Management
- Pros and Cons
- Puzzle
- Puzzles
- Recruitment Strategy
- Religion
- Research and Development
- Risk Mitigation Strategies
- Roadmap
- Selling
- Shapes
- Short Term Long Term
- Social
- Stairs
- Start Stop Continue
- Strategy
- Symbol
- Technology
- Thesis Defense Dissertation
- Timelines
- Traffic
- Transition Plan
- Transportation
- Vehicles
- Venture Capital Funding
- Warning
- Winners
- Word Cloud
-
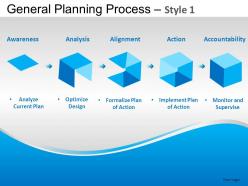 General planning process 1 powerpoint presentation slides
These high quality, editable pre-designed powerpoint slides and powerpoint templates have been carefully created by our professional team to help you impress your audience. Each graphic in every powerpoint slide is vector based and is 100% editable in powerpoint. Each and every property of any slide - color, size, shading etc can be modified to build an effective powerpoint presentation. Use these slides to convey complex business concepts in a simplified manner. Any text can be entered at any point in the powerpoint slide. Simply DOWNLOAD, TYPE and PRESENT!
-
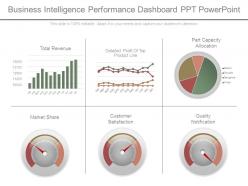 Business intelligence performance dashboard snapshot ppt powerpoint
Presenting business intelligence performance dashboard snapshot ppt powerpoint. This is a business intelligence performance dashboard ppt powerpoint. This is a six stage process. The stages in this process are total revenue, detailed profit of top product line, part capacity allocation, market share, customer satisfaction, quality notification.
-
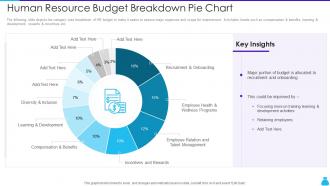 Human Resource Budget Breakdown Pie Chart
The following slide depicts the category wise breakdown of HR budget to make it easier to assess major expenses and scope for improvement. It includes heads such as compensation and benefits, learning and development, rewards and incentives etc. Introducing our Human Resource Budget Breakdown Pie Chart set of slides. The topics discussed in these slides are Human Resource Budget Breakdown Pie Chart. This is an immediately available PowerPoint presentation that can be conveniently customized. Download it and convince your audience.
-
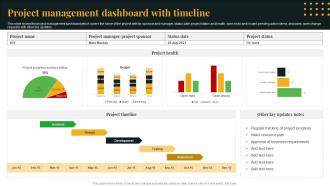 Project Management Dashboard With Timeline
This slide shows the project management dashboard which covers the name of the project with its sponsor and manager, status date, project status and health, open risks and issues, pending action items, decisions, open change requests with other key updates. Introducing our Project Management Dashboard With Timeline set of slides. The topics discussed in these slides are Regular Tracking Of Project Progress, Intact Resource Plan, Approval Of Business Requirements This is an immediately available PowerPoint presentation that can be conveniently customized. Download it and convince your audience.
-
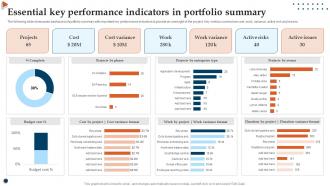 Essential Key Performance Indicators In Portfolio Summary
The following slide showcases dashboard of portfolio summary with important key performance indicators to provide an oversight of the project. Key metrics covered are cost, work, variance, active risk and issues. Introducing our Essential Key Performance Indicators In Portfolio Summary set of slides. The topics discussed in these slides are Essential Key Performance, Indicators In Portfolio Summary. This is an immediately available PowerPoint presentation that can be conveniently customized. Download it and convince your audience.
-
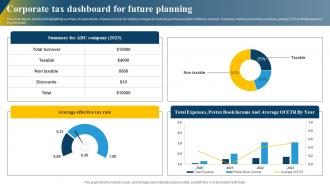 Corporate Tax Dashboard For Future Planning
This slide depicts dashboard highlighting summary of corporate tax of particular year for helping company to make proper financial plan in future to save tax. It involves metrics such as tax summary, average ETR and total expense income graph. Introducing our Corporate Tax Dashboard For Future Planning set of slides. The topics discussed in these slides are Average, Income, Planning. This is an immediately available PowerPoint presentation that can be conveniently customized. Download it and convince your audience.
-
 Man blind folded with money bags for risk measure flat powerpoint design
We are proud to present our man blind folded with money bags for risk measure flat powerpoint design. Concept of risk analysis and measurement has been displayed in this power point template diagram. This PPT diagram contains the graphic of blind folded man and money bags. Use this PPT diagram and build a quality presentation for your viewers.
-
 Five colored banners with icons financial process flat powerpoint design
Pre-designed PPT graphic helps in saving time and effort. Include or exclude slide content as per your individual need. Colors and text can be easily changed as the PPT slide is completely editable. Personalize the presentation with individual company name and logo. This PPT Slide is available in both Standard and Widescreen slide size. Easy and quick downloading process. Flexible option for conversion in PDF or JPEG formats.
-
 Four number banners for banking solutions flat powerpoint design
Presenting four number banners for banking solutions flat powerpoint design. This Power Point template slide has been crafted with graphic of four number banners and icons. This PPT slide contains the concept of banking solutions. Use this PPT slide for business and finance related presentations.
-
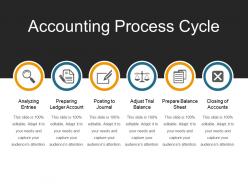 Accounting process cycle powerpoint images
Presenting accounting process cycle powerpoint images. This is a accounting process cycle powerpoint images. This is a six stage process. The stages in this process are accounting, book keeping, auditing.
-
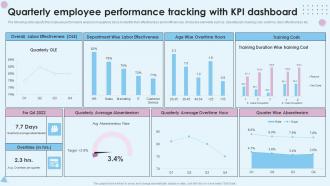 Quarterly Employee Performance Tracking With KPI Dashboard
The following slide depicts the employee performance analysis on quarterly basis to identify their effectiveness and inefficiencies. It includes elements such as absenteeism, training cost, overtime, labor effectiveness etc. Presenting our well-structured Quarterly Employee Performance Tracking With KPI Dashboard. The topics discussed in this slide are Quarterly, Employee Performance Tracking, KPI Dashboard. This is an instantly available PowerPoint presentation that can be edited conveniently. Download it right away and captivate your audience.
-
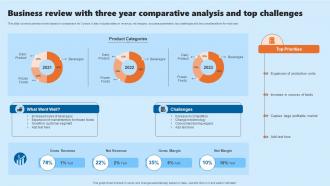 Business Review With Three Year Comparative Analysis And Top Challenges
This slide covers business review based on comparison for 3 years. It also includes stats on revenue, net margins, success parameters, top challenges and key considerations for next year. Introducing our Business Review With Three Year Comparative Analysis And Top Challenges set of slides. The topics discussed in these slides are Product, Analysis, Business. This is an immediately available PowerPoint presentation that can be conveniently customized. Download it and convince your audience.
-
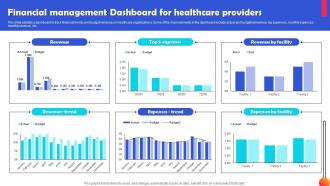 Financial Management Dashboard For Healthcare Providers
This slide exhibits a dashboard to track financial trends and budget variances in healthcare organizations. Some of the main elements in the dashboard include actual and budgeted revenue, top expenses, monthly expenses, monthly revenue, etc. Introducing our Financial Management Dashboard For Healthcare Providers set of slides. The topics discussed in these slides are Management, Financial, Healthcare. This is an immediately available PowerPoint presentation that can be conveniently customized. Download it and convince your audience.
-
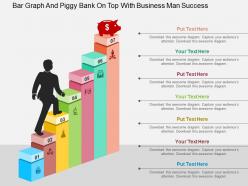 Bar graph and piggy bank on top with business man success flat powerpoint design
Extremely smooth running of slide with all compatible software. Easily download in no time. Company logo, name or trademark can be included without worry. PPT graphics pixelation does not occur when projected on widescreen. Compatibility with google slides for easy access. Indicate titles and subtitles with no space constraints. High resolution PPT slides for great sharpness. Useful for businesses, startups.
-
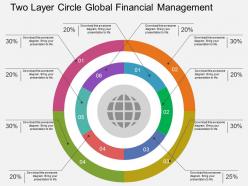 Cu two layer circle global financial management flat powerpoint design
Presenting cu two layer circle global financial management flat powerpoint design. Two layer circles have been used to craft this power point template diagram. This PPT diagram contains the concept of global financial management. Use this PPT diagram for business and finance related presentations.
-
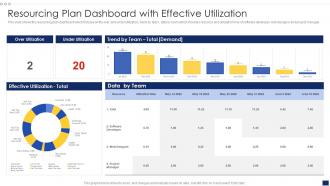 Resourcing Plan Dashboard Snapshot With Effective Utilization
This slide shows the resourcing plan dashboard which focuses on the over and under utilization, trend by team, data by team which includes resource and utilization time of software developer, web designer and project manager. Introducing our Resourcing Plan Dashboard Snapshot With Effective Utilization set of slides. The topics discussed in these slides are Effective Utilization Total, Team, Trend Team, Over Utilization. This is an immediately available PowerPoint presentation that can be conveniently customized. Download it and convince your audience.
-
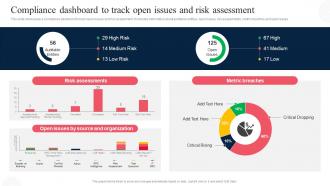 Compliance Dashboard To Track Open Issues And Corporate Regulatory Compliance Strategy SS V
This slide showcases a compliance dashboard to track open issues and risk assessment. It includes information about auditable entities, open issues, risk assessments, metric breaches and open issues. Present the topic in a bit more detail with this Compliance Dashboard To Track Open Issues And Corporate Regulatory Compliance Strategy SS V. Use it as a tool for discussion and navigation on Risk Assessments, Metric Breaches. This template is free to edit as deemed fit for your organization. Therefore download it now.
-
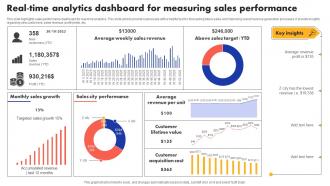 Real Time Analytics Dashboard For Measuring Sales Performance
This slide highlights sales performance dashboard for real-time analytics. This slide aims to provide businesses with a helpful tool for forecasting future sales and improving overall revenue generation processes. It provide insights regarding new customers, sales revenue, profit yields, etc. Introducing our Real Time Analytics Dashboard For Measuring Sales Performance set of slides. The topics discussed in these slides are Sales City Performance, Monthly Sales Growth. This is an immediately available PowerPoint presentation that can be conveniently customized. Download it and convince your audience.
-
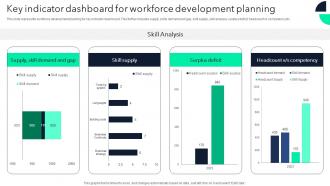 Key Indicator Dashboard For Workforce Development Planning
This slide represents workforce development planning for key indicator dashboard. This further includes supply, skills demand and gap, skill supply, skill analysis, surplus deficit, headcount vs competency etc. Introducing our Key Indicator Dashboard For Workforce Development Planning set of slides. The topics discussed in these slides are Skill Supply, Surplus Deficit, Headcount Competency. This is an immediately available PowerPoint presentation that can be conveniently customized. Download it and convince your audience.
-
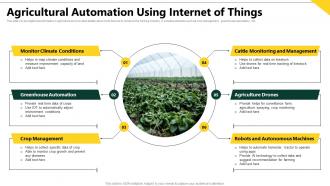 Agricultural Automation Using Internet Of Things
This slide covers digital transformation in agriculture and provides details about tools that are to enhance the farming industry. It includes elements such as crop management, greenhouse automation, etc. Presenting our set of slides with Agricultural Automation Using Internet Of Things. This exhibits information on six stages of the process. This is an easy to edit and innovatively designed PowerPoint template. So download immediately and highlight information on Monitor Climate Conditions, Greenhouse Automation.
-
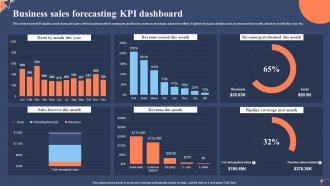 Business Sales Forecasting Kpi Dashboard
This slide shows KPI dashboard to forecast sales of the business which measures and tracks revenue and deals earned monthly. It further includes details such as revenue this month, deals by month this year etc. Introducing our Business Sales Forecasting Kpi Dashboard set of slides. The topics discussed in these slides are Revenue Earned This Month, Revenue This Month. This is an immediately available PowerPoint presentation that can be conveniently customized. Download it and convince your audience.
-
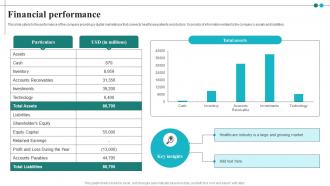 Financial Performance Remote Patient Care Marketplace Investor Funding Elevator Pitch Deck
This slide caters to the performance of the company providing a digital marketplace that connects healthcare patients and doctors. It consists of information related to the companys assets and liabilities. Present the topic in a bit more detail with this Financial Performance Remote Patient Care Marketplace Investor Funding Elevator Pitch Deck. Use it as a tool for discussion and navigation on Healthcare Industry, Key Insights, Growing Market. This template is free to edit as deemed fit for your organization. Therefore download it now.
-
 Real Estate Rental Feasibility Study
This slide showcases real estate rental feasibility study as per the number of bedrooms to show growth in market rental properties and rise in demand for housing from the year 2018 to 2023. Introducing our Real Estate Rental Feasibility Study set of slides. The topics discussed in these slides are Market Rent Per Unit, Rise In Interest Rate, Rental Properties. This is an immediately available PowerPoint presentation that can be conveniently customized. Download it and convince your audience.
-
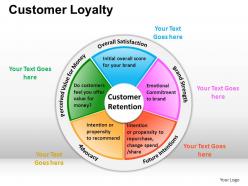 Customer loyalty powerpoint presentation slides
These high quality, editable pre-designed powerpoint slides and powerpoint templates have been carefully created by our professional team to help you impress your audience. Each graphic in every powerpoint slide is vector based and is 100% editable in powerpoint. Each and every property of any slide - color, size, shading etc can be modified to build an effective powerpoint presentation. Use these slides to convey complex business concepts in a simplified manner. Any text can be entered at any point in the powerpoint slide. Simply DOWNLOAD, TYPE and PRESENT!
-
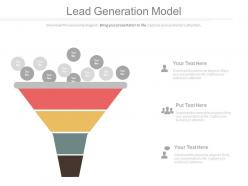 View lead generation funnel model for sales and marketing powerpoint slides
Presenting view lead generation funnel model for sales and marketing powerpoint slides. This Power Point template slide has been crafted with graphic of funnel model and icons. This PPT slide contains the concept of lead generation for sales and marketing. Use this PPT slide for business and marketing related presentations.
-
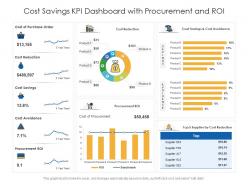 Cost savings kpi dashboard with procurement and roi
Introducing our Cost Savings KPI Dashboard With Procurement And ROI set of slides. The topics discussed in these slides are Cost Of Purchase Order, Cost Reduction, Coat Savings And Cost Avoidance, Cost Of Procurement, Procurement ROI, Top 5 Supplier By Cost Reduction, Procurement ROI, Cost Avoidance, Cost Savings, Cost Reduction. This is an immediately available PowerPoint presentation that can be conveniently customized. Download it and convince your audience.
-
 Call center presentation through a performance dashboard
Introducing our Call Center Presentation Through A Performance Dashboard set of slides. The topics discussed in these slides are Call Center Presentation Through A Performance Dashboard. This is an immediately available PowerPoint presentation that can be conveniently customized. Download it and convince your audience.
-
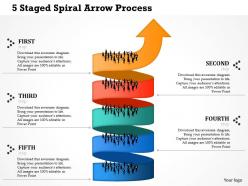 0514 5 staged spiral arrow process powerpoint presentation
PPT graphics pixelation not an issue when projected on widescreen. Compatibility with google slides for wider information access. Display titles and subtitles with no space constraints. High resolution PPT slides for additional sharpness. Employable for businesses, small and large, technical and non-technical startups, project management, Strategic organizations, educational institutes, universities teaching management subjects, process management firms and many more.
-
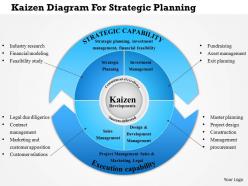 0814 business consulting kaizen diagram for strategic planning powerpoint slide template
More designs available with different nodes and stages as required. Variable PPT slide with remarkable picture quality. Alteration is possible with color, text, font and shape. Quick download and can be altered in JPEG and PDF format. Provides an expert viewpoint to your presentation design. Presentation design exhibited in standard and widescreen view. Accessibility to personalize the design by inserting business name.
-
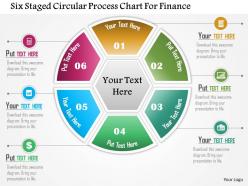 Six staged circular process chart for finance powerpoint template
We are proud to present our six staged circular process chart for finance powerpoint template. Six staged circular process chart has been used to craft this power point template diagram. This PPT diagram contains the concept of financial analysis. Use this PPT diagram for business and finance related presentations.
-
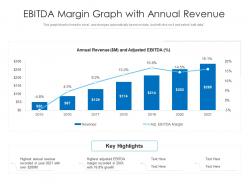 Ebitda margin graph with annual revenue
This graph or chart is linked to excel, and changes automatically based on data. Just left click on it and select edit data. Introducing our EBITDA Margin Graph With Annual Revenue set of slides. The topics discussed in these slides are Annual Revenue, Key Highlights, EBITDA Margin. This is an immediately available PowerPoint presentation that can be conveniently customized. Download it and convince your audience.
-
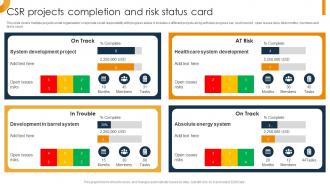 CSR Projects Completion And Risk Status Card
This slide covers multiple projects under organizations corporate social responsibility with progress status. It includes 4 different projects along with task progress bar, cost incurred, open issues risks, total months, members and tasks count. Presenting our well structured CSR Projects Completion And Risk Status Card. The topics discussed in this slide are System Development Project, Healthcare System Development, Absolute Energy System. This is an instantly available PowerPoint presentation that can be edited conveniently. Download it right away and captivate your audience.
-
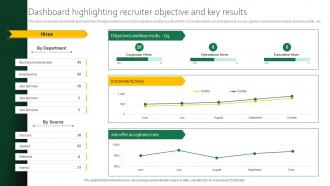 Dashboard Highlighting Recruiter Objective And Key Results Digital Recruitment For Efficient
This slide showcases recruitment dashboard which helps recruiters access their objectives and key results OKRs. It provides details about department, source, applied, business development, interview activity, etc. Deliver an outstanding presentation on the topic using this Dashboard Highlighting Recruiter Objective And Key Results Digital Recruitment For Efficient Dispense information and present a thorough explanation of Interview Activity, Recruiter Objective using the slides given. This template can be altered and personalized to fit your needs. It is also available for immediate download. So grab it now.
-
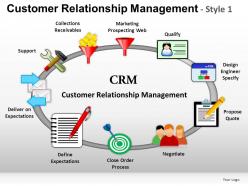 Customer relationship 2 powerpoint presentation slides
These high quality, editable pre-designed powerpoint slides and powerpoint templates have been carefully created by our professional team to help you impress your audience. Each graphic in every powerpoint slide is vector based and is 100% editable in powerpoint. Each and every property of any slide - color, size, shading etc can be modified to build an effective powerpoint presentation. Use these slides to convey complex business concepts in a simplified manner. Any text can be entered at any point in the powerpoint slide. Simply DOWNLOAD, TYPE and PRESENT!
-
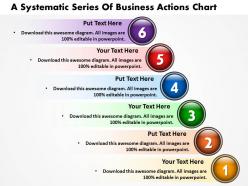 A systematic series of business actions chart powerpoint templates ppt presentation slides 812
It is an amazing graphic to explain the pros and cons of each Topic. You can easily use these diagrams to mention the facts and figures effectively
-
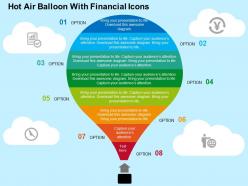 Hot air balloon with financial icons flat powerpoint design
Slide runs smoothly on all software. Hassle-free conversion to JPG and PDF formats. Graphics pixelation does not occur when projected on widescreen screen. Works with google slides without issues. High resolution PPT graphics for better sharpness. Customize by adding company logo, trademark, name. No space constraints when including titles/sub titles. Useful in businesses, startups, project management, strategic organizations and more.
-
 Ug magnifier for business peoples search flat powerpoint design
Useful for businesses, startups and not-for profit organizations as well. Also, a great tool for recruitment companies. Option to convert slides to JPG and PDF formats. Widescreen mode available. Trouble free compatibility with google slides for far reaching effects. Excellent PowerPoint graphics with option to amend features like shape, size and color of the icon or object of your choice.
-
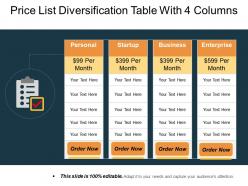 Price list diversification table with 4 columns
Presenting price list diversification table with 4 columns. This is a price list diversification table with 4 columns. This is a four stage process. The stages in this process are price list table with 4 boxes, price list differentiation design with 5 columns, price list diversification table with 4 columns, service price list with service type and 4 columns.
-
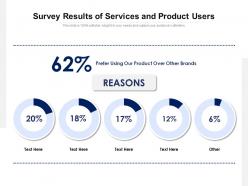 Survey results of services and product users
Presenting this set of slides with name Survey Results Of Services And Product Users. The topics discussed in these slides are Survey Results Of Services And Product Users. This is a completely editable PowerPoint presentation and is available for immediate download. Download now and impress your audience.
-
 Project management issue tracking dashboard
Introducing our Project Issue Management Dashboard With Budget And Risks Status set of slides. The topics discussed in these slides are Project Management Issue Tracking Dashboard. This is an immediately available PowerPoint presentation that can be conveniently customized. Download it and convince your audience.
-
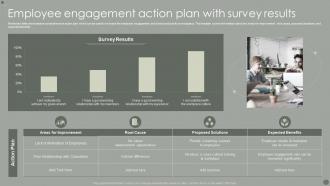 Employee Engagement Action Plan With Survey Results
Mentioned slide showcases a comprehensive action plan which can be used to increase the employee engagement and boost productivity at workplace. The template covers information about the areas for improvement, root cause, proposed solutions, and expected benefits. Presenting our well-structured Employee Engagement Action Plan With Survey Results. The topics discussed in this slide are Employee Engagement, Action Plan, Survey Results. This is an instantly available PowerPoint presentation that can be edited conveniently. Download it right away and captivate your audience.
-
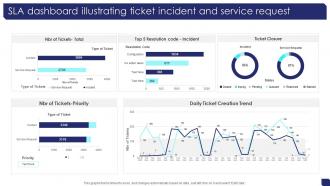 SLA Dashboard Illustrating Ticket Incident And Service Request
Introducing our SLA Dashboard Illustrating Ticket Incident And Service Request set of slides. The topics discussed in these slides are Resolution Code, Ticket Closure, Daily Ticket Creation Trend. This is an immediately available PowerPoint presentation that can be conveniently customized. Download it and convince your audience.
-
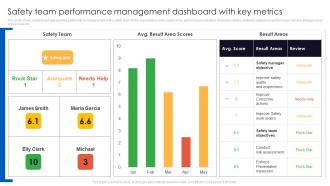 Safety Team Performance Management Dashboard Snapshot With Key Metrics
This slide shows a dashboard representing performance measurement of the safety team of the organization on the basis of key performance indicators. It includes details related to safety team performance ranking, average result area scores etc. Presenting our well structured Safety Team Performance Management Dashboard Snapshot With Key Metrics. The topics discussed in this slide are Safety Team Performance, Management Dashboard, Key Metrics. This is an instantly available PowerPoint presentation that can be edited conveniently. Download it right away and captivate your audience.
-
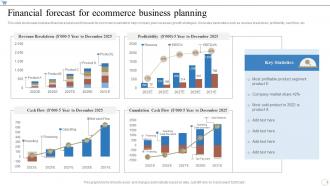 Financial Forecast For Ecommerce Business Planning
This slide showcases business financial analysis and forecasts for ecommerce website to help company plan necessary growth strategies. It includes parameters such as revenue breakdown, profitability, cash flow, etc. Presenting our well-structured Financial Forecast For Ecommerce Business Planning. The topics discussed in this slide are Financial Forecast, Ecommerce Business Planning. This is an instantly available PowerPoint presentation that can be edited conveniently. Download it right away and captivate your audience.
-
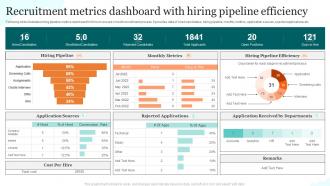 Recruitment Metrics Dashboard With Hiring Pipeline Efficiency
Following slide illustrates hiring pipeline metrics dashboard for firms to ensure smooth recruitment process. It provides data of hired candidates, hiring pipeline, monthly metrics, application sources, rejected applications etc. Introducing our Recruitment Metrics Dashboard With Hiring Pipeline Efficiency set of slides. The topics discussed in these slides are Hiring Pipeline, Monthly Metrics, Hiring Pipeline Efficiency. This is an immediately available PowerPoint presentation that can be conveniently customized. Download it and convince your audience.
-
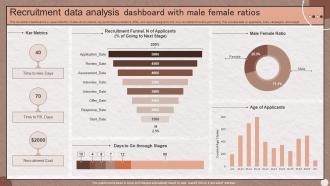 Recruitment data analysis dashboard with male female ratios
This recruitment dashboard is a visual collection of data driven metrics, key performance indicators KPIs , and reports designed to tell how recruitment funnel is performing. This includes data on applicants, hires, campaigns, and budget. Presenting our well structured Recruitment data analysis dashboard with male female ratios. The topics discussed in this slide are Dashboard, Analysis, Recruitment. This is an instantly available PowerPoint presentation that can be edited conveniently. Download it right away and captivate your audience.
-
 Globes country continents outlines powerpoint slides and ppt templates db
These high quality, editable pre-designed powerpoint slides and powerpoint templates have been carefully created by our professional team to help you impress your audience. Each graphic in every powerpoint slide is vector based and is 100% editable in powerpoint.Each and every property of any slide - color, size, shading etc can be modified to build an effective powerpoint presentation. Use these slides to convey complex business concepts in a simplified manner. Any text can be entered at any point in the powerpoint slide. Simply DOWNLOAD, TYPE and PRESENT
-
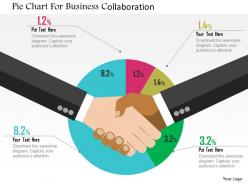 Pie chart for business collaboration flat powerpoint design
We are proud to present our pie chart for business collaboration flat powerpoint design. Graphic of pie chart has been used to craft this power point template diagram. This PPT diagram contains the concept of business collaboration. Use this PPT diagram for business presentations.
-
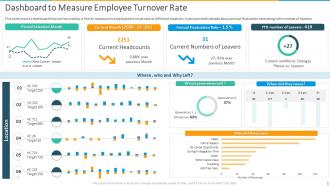 Dashboard To Measure Employee Turnover Rate Introducing Employee Succession Planning
Deliver an outstanding presentation on the topic using this Dashboard To Measure Employee Turnover Rate Introducing Employee Succession Planning. Dispense information and present a thorough explanation of Current Headcounts, Dashboard To Measure, Employee Turnover Rate using the slides given. This template can be altered and personalized to fit your needs. It is also available for immediate download. So grab it now.
-
 Project Risk Management Progress Dashboard
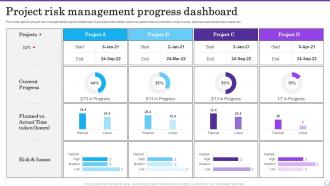
This slide depicts project risk management progress dashboard. It provides information about key performance indicators, risks, issues, planned and actual hours spent, etc. Introducing our Project Risk Management Progress Dashboard set of slides. The topics discussed in these slides are Projects, Current Progress, progress dashboard. This is an immediately available PowerPoint presentation that can be conveniently customized. Download it and convince your audience.
-
 Retail Insights Using Iot Technology
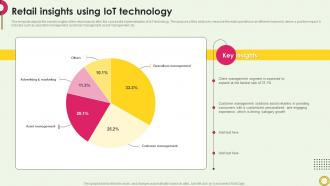
This template depicts the overall insights of the retail industry after the successful implementation of IoT technology. The purpose of this slide is to measure the retail operation in an efficient manner to derive a positive impact. It includes such as operation management, customer management, asset management, etc. Present the topic in a bit more detail with this Retail Insights Using Iot Technology. Use it as a tool for discussion and navigation on Client Management Segment, Customer Management Solutions. This template is free to edit as deemed fit for your organization. Therefore download it now.
-
 Guide On Defining Roles Of Stablecoins Overview Of Tether Usdt As Top Stablecoin BCT SS
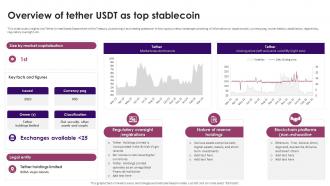
This slide covers insights into Tether United States Department of the Treasury, positioning it as a leading stablecoin in the cryptocurrency landscape consisting of information on issuance year, currency peg, owner details, classification, legal entity, regulatory oversight, etc. Present the topic in a bit more detail with this Guide On Defining Roles Of Stablecoins Overview Of Tether Usdt As Top Stablecoin BCT SS. Use it as a tool for discussion and navigation on Nature Of Reserve Holdings, Blockchain Platforms, Regulatory Oversight Or Registrations. This template is free to edit as deemed fit for your organization. Therefore download it now.
-
 Leadership Training Progress Results Dashboard
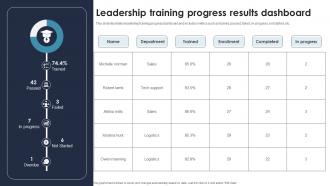
This slide illustrates leadership training progress dashboard and includes metrics such as trained, passed, failed, in- progress, not started, etc. Introducing our Leadership Training Progress Results Dashboard set of slides. The topics discussed in these slides are Department, Enrollment, In Progress.This is an immediately available PowerPoint presentation that can be conveniently customized. Download it and convince your audience.
-
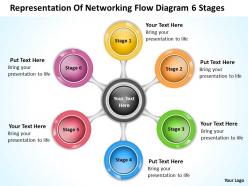 Business flow diagram example of networking 6 stages powerpoint templates
Use of high resolution images and the graphics. User friendly structure of the slides. Access to edit the content, style, size and orientation of the PPT slides. All the slides are compatible with Google Slides. Valuable for the business presenters, management and the entrepreneurs.
-
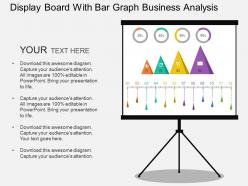 Display board with bar graph business analysis flat powerpoint design
We are proud to present our display board with bar graph business analysis flat powerpoint design. This power point template diagram has been crafted with graphic of display board and bar graph. This PPT diagram contains the concept of business analysis. Use this PPT diagram for business and marketing related presentations.
-
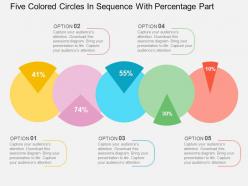 Five colored circles in sequence with percentage part flat powerpoint design
Adjustable PPT Slide with percentage values. Smoothly convertible into numerous format options such as JPG or PDF. Provides a professional outlook to your PowerPoint presentation. Customization of each PowerPoint graphic and text as per your industry requirement. Multiple display option such as standard and widescreen view. Freedom to customize it with company name and logo. PPT slides goes well with Google slides.
-
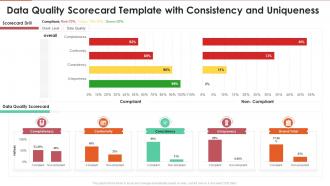 Data quality scorecard template with consistency and uniqueness
Present the topic in a bit more detail with this Data Quality Scorecard Template With Consistency And Uniqueness. Use it as a tool for discussion and navigation on Completeness, Conformity, Consistency, Uniqueness, Grand Total . This template is free to edit as deemed fit for your organization. Therefore download it now.
-
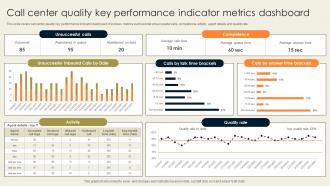 Call Center Quality Key Performance Indicator Metrics Dashboard
This slide covers call center quality key performance indicator dashboard. It involves metrics such as total unsuccessful calls, competence, activity, agent details and quality rate. Introducing our Call Center Quality Key Performance Indicator Metrics Dashboard set of slides. The topics discussed in these slides are Unsuccessful Calls, Competence, Quality Rate. This is an immediately available PowerPoint presentation that can be conveniently customized. Download it and convince your audience.
-
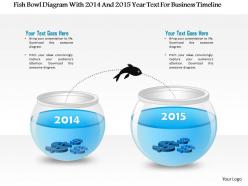 1214 fish bowl diagram with 2014 and 2015 year text for business timeline powerpoint presentation
Presentation slides can be viewed in standard and widescreen view. Fast to download, share and insert in the presentation. PowerPoint designs goes well with Google slides. Easily amendable presentation image design. They display a professional image of your organization. They provide high-quality performance. They have time-saving abilities.
-
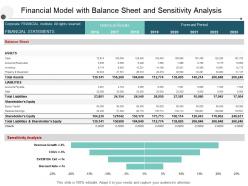 Financial model with balance sheet and sensitivity analysis
Presenting this set of slides with name - Financial Model With Balance Sheet And Sensitivity Analysis. This is a two stage process. The stages in this process are Financial Analysis, Income Statement, Balance Sheet.


