Finance PowerPoint Templates, Presentation Slide Diagrams & PPT Graphics
- Sub Categories
-
- 30 60 90 Day Plan
- Advertising
- Agile Development
- Aims and Objectives
- Arrows
- Before and After
- Blockchain Bitcoin
- Boxes
- Business
- Calender
- Case Study
- Celebrations
- Certificates
- Challenges Opportunities
- Channel Distribution
- Children
- Communication
- Competitive Landscape
- Computer
- Concepts
- Construction Management
- Corporate
- Crowdfunding
- Current State Future State
- Custom PowerPoint Diagrams
- Digital Transformation
- Dos and Donts
- Economics
- Education
- Environment
- Events
- Festival
- Finance
- Financials
- Food
- Game
- Gap Analysis
- Generic
- Geographical
- Health
- Heatmaps
- Holidays
- Icons
- Input Process Output
- Internet
- Key Messages
- Key Wins
- Ladder
- Leadership
- Lists
- Lucky Draw
- Management
- Marketing
- Measuring
- Medical
- Music
- News
- Next Steps
- People Process Technology
- Pillars
- Planning
- Post-it-Notes
- Problem Statement
- Process
- Proposal Management
- Pros and Cons
- Puzzle
- Puzzles
- Recruitment Strategy
- Religion
- Research and Development
- Risk Mitigation Strategies
- Roadmap
- Selling
- Shapes
- Short Term Long Term
- Social
- Stairs
- Start Stop Continue
- Strategy
- Symbol
- Technology
- Thesis Defense Dissertation
- Timelines
- Traffic
- Transition Plan
- Transportation
- Vehicles
- Venture Capital Funding
- Warning
- Winners
- Word Cloud
-
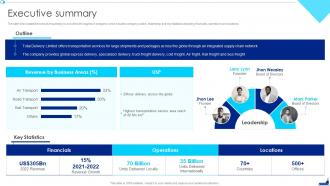 Shipping Company Profile Executive Summary Ppt Infographics Deck
The slide showcases the executive summary to provide brief insights of company which includes company outline, leadership and key statistics depicting financials, operations and locations. Deliver an outstanding presentation on the topic using this Shipping Company Profile Executive Summary Ppt Infographics Deck. Dispense information and present a thorough explanation of Financials, Revenue Business Areas, Operations using the slides given. This template can be altered and personalized to fit your needs. It is also available for immediate download. So grab it now.
-
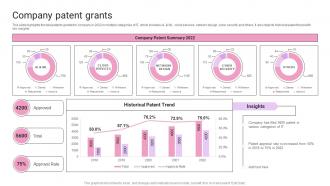 Company Patent Grants IT Products And Services Company Profile Ppt Background
This slide highlights the total patents granted to company in 2022 in multiple categories of IT, which includes AL and ML. cloud services, network design, cyber security and others. It also depicts historical patent trend with key insights. Deliver an outstanding presentation on the topic using this Company Patent Grants IT Products And Services Company Profile Ppt Background. Dispense information and present a thorough explanation of Company Patent Summary, Historical Patent Trend using the slides given. This template can be altered and personalized to fit your needs. It is also available for immediate download. So grab it now.
-
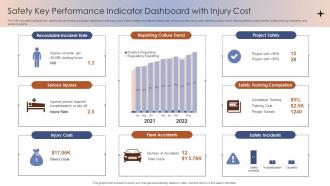 Safety Key Performance Indicator Dashboard With Injury Cost
The following slide highlights the safety key performance indicator dashboard with injury cost. It showcases recordable incident rate, serious injuries, injury cost, reporting culture trend, fleet accidents, project safety, safety training completion and safety incidents Presenting our well-structured Safety Key Performance Indicator Dashboard With Injury Cost. The topics discussed in this slide are Fleet Accidents, Safety Incidents, Project Safety, Reporting Culture Trend. This is an instantly available PowerPoint presentation that can be edited conveniently. Download it right away and captivate your audience.
-
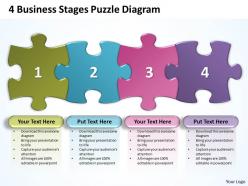 4 business stages puzzle diagram powerpoint templates ppt presentation slides 0812
It is all there in bits and pieces. Individual components well researched and understood in their place. Now you need to get it all together to form the complete picture and reach the goal. You have the ideas and plans on how to go about it. Use this template to illustrate your method, piece by piece, and interlock the whole process in the minds of your audience.
-
 0115 3d men with team text for teamwork powerpoint template
PPT model does not pixelate, while being projected on big screen. Flexible option for converting into JPEG/JPG or PDF format. Watermark on PowerPoint slides is easy to remove. Easy to embed company logo/trademark/logo. Step by step guide for customizing presentation illustrations. All the business analyst, marketers, economist, and scholars can use this PPT slide design for their needs.
-
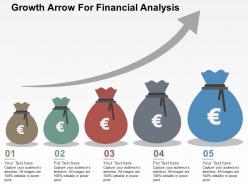 Growth arrow for financial analysis flat powerpoint design
We are proud to present our growth arrow for financial analysis flat powerpoint design. Concept of growth and financial analysis has been displayed in this power point template diagram. This PPT diagram contains the graphic of growth arrow. Use this PPT diagram for business and finance related presentations.
-
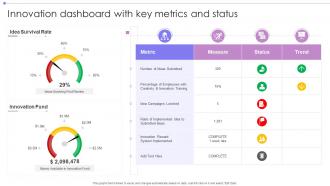 Innovation Dashboard Snapshot With Key Metrics And Status
Presenting our well-structured Innovation Dashboard Snapshot With Key Metrics And Status. The topics discussed in this slide are Innovation Fund, Idea Survival Rate. This is an instantly available PowerPoint presentation that can be edited conveniently. Download it right away and captivate your audience.
-
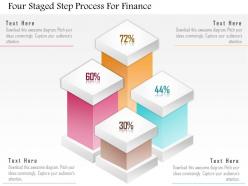 1214 four staged step process for finance powerpoint template
Creative and Innovative PowerPoint presentation design. Equipped with numerous beneficial qualities required for a successful presentation. The quality is well appreciated by the high-profile businesses. These can be easily tailored without putting much effort. Presentation slide comes in standard and widescreen view. Easily transformable into JPEG and PDF document.
-
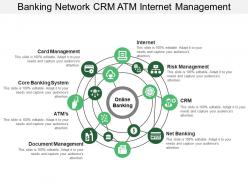 Banking network crm atm internet management
Presenting this set of slides with name - Banking Network Crm Atm Internet Management. This is a eight stage process. The stages in this process are Banking Network, Banking Hub, Banking System.
-
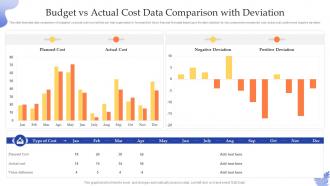 Budget Vs Actual Cost Data Comparison With Deviation
This slide illustrates data comparison of budgeted vs actual cost incurred that can help organization to forecast their future financial forecasts based upon the data collected. Its key components are planned cost, actual cost, positive and negative deviation. Introducing our Budget Vs Actual Cost Data Comparison With Deviation set of slides. The topics discussed in these slides are Planned Cost, Actual Cost, Negative Deviation, Positive Deviation. This is an immediately available PowerPoint presentation that can be conveniently customized. Download it and convince your audience.
-
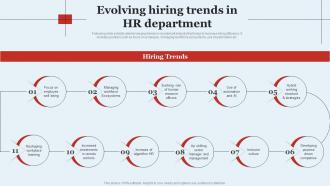 Evolving Hiring Trends In HR Department Optimizing HR Operations Through
Following slide exhibits latest emerging trends in recruitment industry that helps to increase hiring efficiency. It includes pointers such as focus on employee, managing workforce ecosystems, use of automation etc.Introducing Evolving Hiring Trends In HR Department Optimizing HR Operations Through to increase your presentation threshold. Encompassed with eleven stages, this template is a great option to educate and entice your audience. Dispence information on Managing Workforce Ecosystems, Increased Investments, Inclusive Culture, using this template. Grab it now to reap its full benefits.
-
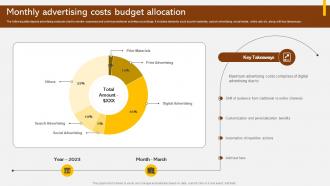 Monthly Advertising Costs Budget Allocation Adopting Integrated Marketing Communication MKT SS V
The following slide depicts advertising costs pie chart to monitor expenses and control promotional activities accordingly. It includes elements such as print materials, search advertising, social media, online ads etc. along with key takeaways. Present the topic in a bit more detail with this Monthly Advertising Costs Budget Allocation Adopting Integrated Marketing Communication MKT SS V. Use it as a tool for discussion and navigation on Costs, Budget, Digital. This template is free to edit as deemed fit for your organization. Therefore download it now.
-
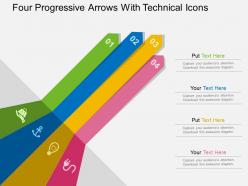 Four progressive arrows with technical icons flat powerpoint design
Proofing and editing can be done with ease in PPT design. Smooth functioning is ensured by the presentation slide show on all software’s. Color, style and position can be standardized, supports font size which can be read from a distance. When projected on the wide screen the PPT layout does not sacrifice on pixels or color resolution. Can be used by the technical support department, businessmen, managers and other professionals to have a setup to highlight different characteristics. Supports good compatibly with the Google slides.
-
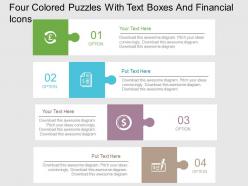 Four colored puzzles with text boxes and financial icons flat powerpoint design
Pre made high determination PPT plan perfect for sales, business, banking, chattered accountant and marketing professionals. Prepared to utilize consequently spares valuable time. Manual altering alternative to modify shading, content and textual style according to particular style. Format subjects with enough space to embed content, titles, logos and organization name. Impermanent watermark blurs with only a tick. Speedy and simple downloading process. Simple to switch PPT design in JPG or PDF organize. Battling fit with Google slides.
-
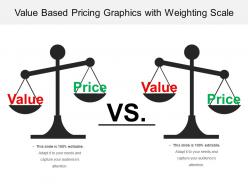 Value based pricing graphics with weighting scale
Presenting this set of slides with name - Value Based Pricing Graphics With Weighting Scale. This is a two stage process. The stages in this process are Value Based Pricing, Value Optimized Pricing, Value Pricing Strategy.
-
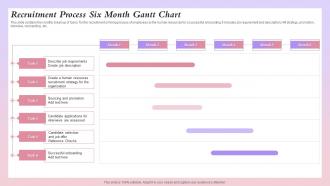 Recruitment Process Six Month Gantt Chart
This slide contains the monthly break up of tasks for the recruitment or hiring process of employees by the human resources for a successful onboarding. It includes job requirement and description, HR strategy, promotion, interview, onboarding , etc. Plan, track and synchronize the most important tasks of any project with this exemplary Recruitment Process Six Month Gantt Chart. This lucrative template can be used to manage the project efficiently. You can enter all the vital components of the project like the start date, duration, and status of each task to keep the owners accountability in check. Create a highly proficient scheduling plan and measure its progress with this elaborative layout. In addition, you can add your activities in the taskbar included in this template and edit it to handle your project effectively. This template is ideal for project management, business plans, student projects, and assignments. So download and captivate your audience.
-
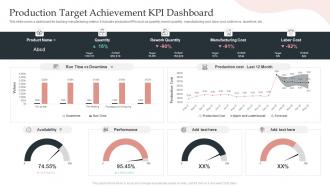 Production Target Achievement KPI Dashboard
This slide covers a dashboard for tracking manufacturing metrics. It includes production KPIs such as quantity, rework quantity, manufacturing cost, labor cost, runtime vs. downtime, etc. Presenting our well-structured Production Target Achievement KPI Dashboard. The topics discussed in this slide are Rework Quantity, Quantity, Manufacturing Cost, Labor Cost. This is an instantly available PowerPoint presentation that can be edited conveniently. Download it right away and captivate your audience.
-
 Recruitment And Selection Process Dashboard With Declining Reasons And Gender Ratio
This slide displays a collection of key performance indicators and reports to provide an overview of the recruitment funnel and process. It includes details about monthly metrics, hiring efficiency, application sources, etc. Presenting our well-structured Recruitment And Selection Process Dashboard With Declining Reasons And Gender Ratio. The topics discussed in this slide are Recruitment, Selection Process Dashboard, Declining Reasons, Gender Ratio. This is an instantly available PowerPoint presentation that can be edited conveniently. Download it right away and captivate your audience.
-
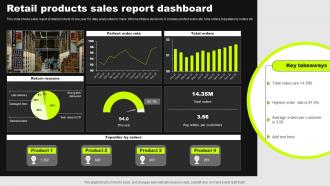 Retail Products Sales Report Dashboard
This slide shows sales report of retail products of one year for data analysation to make informed future decisions. It includes perfect order rate, total orders,topsellers by orders etc. Introducing our Retail Products Sales Report Dashboard set of slides. The topics discussed in these slides are Perfect Order Rate, Topseller By Orders. This is an immediately available PowerPoint presentation that can be conveniently customized. Download it and convince your audience.
-
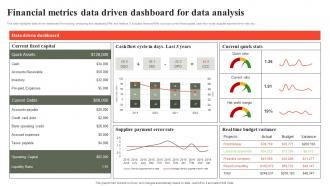 Financial Metrics Data Driven Dashboard For Data Analysis
This slide highlights data driven dashboard for tracking, analyzing and displaying KPIs and metrics. It includes financial KPIs such as current fixed capital, cash flow cycle, supplier payment error rate, etc. Introducing our Financial Metrics Data Driven Dashboard For Data Analysis set of slides. The topics discussed in these slides are Quick Assets, Current Fixed Capital. This is an immediately available PowerPoint presentation that can be conveniently customized. Download it and convince your audience.
-
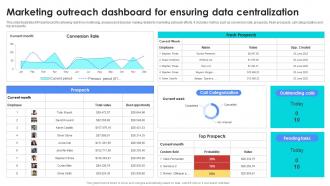 Marketing Outreach Dashboard For Ensuring Data Centralization
This slide illustrates KPI dashboard for allowing real time monitoring, analysis and decision making related to marketing outreach efforts. It includes metrics such as conversion rate, prospects, fresh prospects, call categorization and top prospects. Presenting our well structured Marketing Outreach Dashboard For Ensuring Data Centralization. The topics discussed in this slide are Dashboard, Ensuring, Data. This is an instantly available PowerPoint presentation that can be edited conveniently. Download it right away and captivate your audience.
-
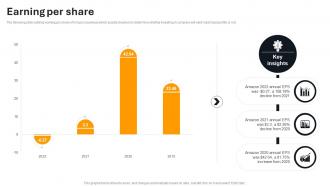 Earning Per Share Amazon Company Profile Ppt Infographic Template Styles CP SS
The following slide outlines earning per share of Amazon business which assists investors to determine whether investing in company will yield maximized profits or not. Present the topic in a bit more detail with this Earning Per Share Amazon Company Profile Ppt Infographic Template Styles CP SS Use it as a tool for discussion and navigation on Earning Per Share This template is free to edit as deemed fit for your organization. Therefore download it now.
-
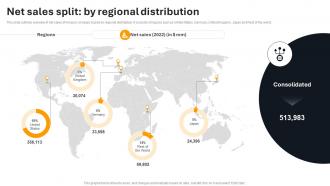 Net Sales Split By Regional Distribution Amazon Company Profile Ppt File Visual Aids CP SS
This slide outlines overview of net sales of Amazon company based on regional distribution. It consists of regions such as United States, Germany, United Kingdom, Japan and Rest of the world. Deliver an outstanding presentation on the topic using this Net Sales Split By Regional Distribution Amazon Company Profile Ppt File Visual Aids CP SS Dispense information and present a thorough explanation of Net Sales Split, Regional Distribution using the slides given. This template can be altered and personalized to fit your needs. It is also available for immediate download. So grab it now.
-
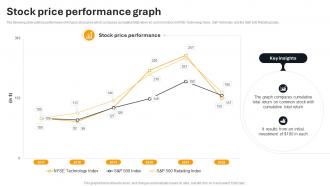 Stock Price Performance Graph Amazon Company Profile Ppt Show Gallery CP SS
The following slide outlines performance of Amazon stock price which compares cumulative total return on common stock in NYSE Technology Index, SandP 500 Index and the SandP 500 Retailing Index. Deliver an outstanding presentation on the topic using this Stock Price Performance Graph Amazon Company Profile Ppt Show Gallery CP SS Dispense information and present a thorough explanation of Stock Price Performance Graph using the slides given. This template can be altered and personalized to fit your needs. It is also available for immediate download. So grab it now.
-
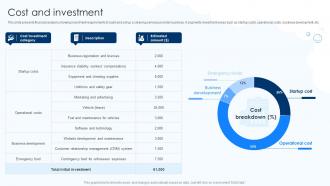 Cost And Investment Cleaning Business Startup Go To Market Strategy GTM SS
This slide presents financial analysis showing investment requirements to build and set up a cleaning services provider business. It segments investment areas such as startup costs, operational costs, business development, etc. Present the topic in a bit more detail with this Cost And Investment Cleaning Business Startup Go To Market Strategy GTM SS Use it as a tool for discussion and navigation on Operational Costs, Cost Breakdown This template is free to edit as deemed fit for your organization. Therefore download it now.
-
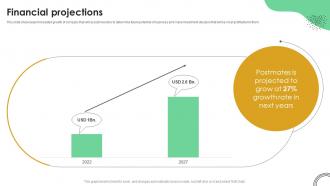 Financial Projections Online Food Ordering App Investor Funding Elevator Pitch Deck
This slide showcases forecasted growth of company that will assist investors to determine future potential of business and make investment decision that will be most profitable for them. Present the topic in a bit more detail with this Financial Projections Online Food Ordering App Investor Funding Elevator Pitch Deck. Use it as a tool for discussion and navigation on Financial Projections. This template is free to edit as deemed fit for your organization. Therefore download it now.
-
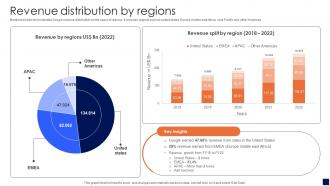 Revenue Distribution By Regions Smart Electronics Manufacturing Company Profile CP SS V
Mentioned slide demonstrates Google revenue distribution on the basis of regions. It includes regions such as united states, Europe middle east Africa, Asia Pacific and other Americas. Present the topic in a bit more detail with this Revenue Distribution By Regions Smart Electronics Manufacturing Company Profile CP SS V. Use it as a tool for discussion and navigation on Revenue Distribution, Regions. This template is free to edit as deemed fit for your organization. Therefore download it now.
-
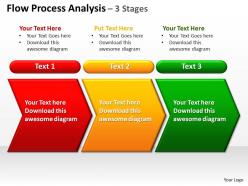 Flow process analysis 3 stages powerpoint diagrams presentation slides graphics 0912
This diagram is particularly useful for displaying how a process currently functions or could ideally function.
-
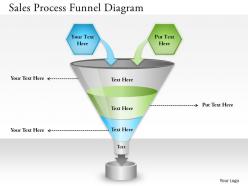 0314 business ppt diagram sales process funnel diagram powerpoint template
Maintenance of superior quality visuals throughout the presentation. Compatible with wide screen output, without the fear of pixilation. Can be effectively used with any number of online and offline software. The business slide example is harmonious with multiple format options. Give it a more personalized look with your company logo and name. Edit the PPT shape, colors, shade, text and more for making it more specific to your content. Used by marketing consultants, students, sales staff, sales managers and project managers.
-
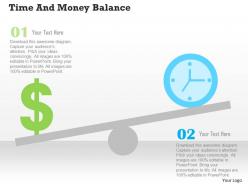 Time and money balance flat powerpoint design
We are proud to present our time and money balance flat powerpoint design. Concept of time and balance has been displayed in this power point template with suitable graphics. This PPT diagram contains the graphics of dollar and clock on balancing scale. Use this PPT for finance and business related presentations.
-
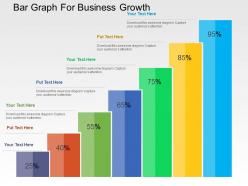 Bar graph for business growth flat powerpoint design
Easily editable PowerPoint slide as color, text and font are alterable. Access to insert or exclude the business related aspects such as logo, icon and image. Presentation template can be downloaded and saved into JPEG and PDF document. Similar designs obtainable with different stages. Adaptable to wide screen view without the problem of pixilation. Totally compatible PPT design with Google slides.
-
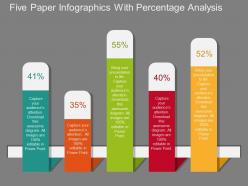 Pptx five paper infographics with percentage analysis flat powerpoint design
The amazing graphics are fully editable in terms of the colour, size, and placement. Choose the desired file format among JPEG, JPG and PDF to save the template. The easy showcase with Google slides is available along with the high-resolution display. Add the required content and other company specifications in a simplified manner. Remove watermark after downloading of the template.
-
 Revenue bridge graph showing sales growth
Presenting this set of slides with name Revenue Bridge Graph Showing Sales Growth. The topics discussed in these slide is Revenue Bridge Graph Showing Sales Growth. This is a completely editable PowerPoint presentation and is available for immediate download. Download now and impress your audience.
-
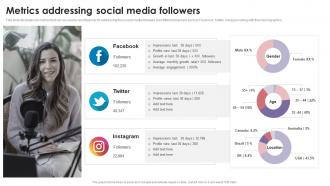 Metrics Addressing Social Media Followers
This slide illustrates key metrics that can be used by an influencer for addressing their social media followers over different channels such as Facebook, Twitter, Instagram along with their demographics. Deliver an outstanding presentation on the topic using this Metrics Addressing Social Media Followers. Dispense information and present a thorough explanation of Metrics Addressing, Social Media Followers using the slides given. This template can be altered and personalized to fit your needs. It is also available for immediate download. So grab it now.
-
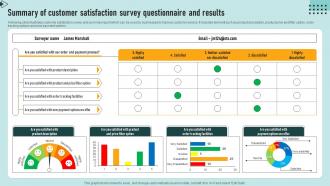 Summary Of Customer Satisfaction Survey Questionnaire And Results Survey SS
Following slide illustrates customer satisfaction survey and summary report which can be used by businesses to improve customer service. It included element such as product description, product price and filter option, order tracking options and new payment options Introducing our Summary Of Customer Satisfaction Survey Questionnaire And Results Survey SS set of slides. The topics discussed in these slides are Customer, Satisfaction, Survey. This is an immediately available PowerPoint presentation that can be conveniently customized. Download it and convince your audience.
-
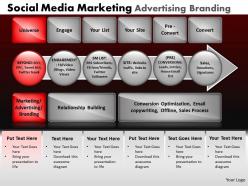 Social media marketing advertising branding powerpoint slides and ppt templates db
These high quality, editable pre-designed powerpoint slides and powerpoint templates have been carefully created by our professional team to help you impress your audience. Each graphic in every powerpoint slide is vector based and is 100% editable in powerpoint.Each and every property of any slide - color, size, shading etc can be modified to build an effective powerpoint presentation. Use these slides to convey complex business concepts in a simplified manner. Any text can be entered at any point in the powerpoint slide. Simply DOWNLOAD, TYPE and PRESENT
-
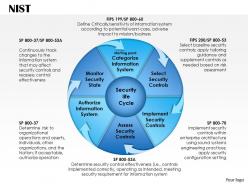 0514 risk management framework Powerpoint Presentation
Entirely amendable presentation slide as colors, icons, and text can be change as per the need. Personalize the PPT design with brand name, emblem and design. Download is instant and convertible into software programs such as JPEG and PDF. Presentation template available with preference to download with different nodes and stages. Stress-free to present amongst large set of audience as available in widescreen view option.
-
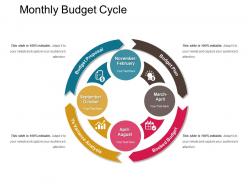 Monthly budget cycle
Presenting Monthly Budget Cycle which is designed professionally for your convenience. You can modify the color, font, font types, and font size of the slides as per your requirements. It can be changed into formats like PDF, JPG, PNG. This template is adaptable with Google Slides which makes it easily accessible at once. It is readily available in both standard and widescreen aspect ratios.
-
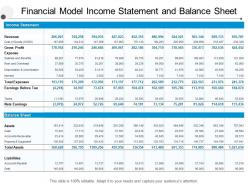 Financial model income statement and balance sheet
Presenting this set of slides with name - Financial Model Income Statement And Balance Sheet. This is a two stage process. The stages in this process are Financial Analysis, Income Statement, Balance Sheet.
-
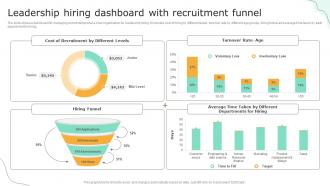 Leadership Hiring Dashboard With Recruitment Funnel
The slide shows a dashboard for managing recruitment process of an organization for leadership hiring. It includes cost of hiring by different levels, turnover rate by different age groups, hiring funnel and average time taken by each department for hiring. Presenting our well-structured Leadership Hiring Dashboard With Recruitment Funnel. The topics discussed in this slide are Leadership Hiring, Dashboard, Recruitment Funnel. This is an instantly available PowerPoint presentation that can be edited conveniently. Download it right away and captivate your audience.
-
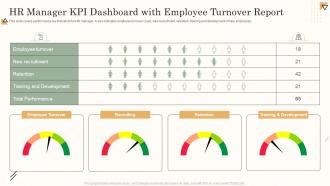 HR Manager KPI Dashboard With Employee Turnover Report
This slide covers performance key indicators for HR manager. It also indicates employee turnover count, new recruitment, retention, training and development of new employees. Introducing our HR Manager KPI Dashboard With Employee Turnover Report set of slides. The topics discussed in these slides are HR Manager, KPI Dashboard, With Employee, Turnover Report. This is an immediately available PowerPoint presentation that can be conveniently customized. Download it and convince your audience.
-
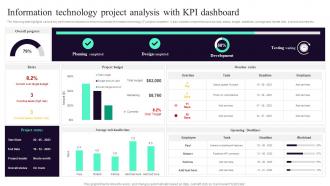 Information Technology Project Analysis With KPI Dashboard
The following slide highlights various key performance indicators to ensure successful information technology IT project completion. It also includes components such as risks, status, budget, deadlines, average task handle time, overdue activities etc. Introducing our Information Technology Project Analysis With KPI Dashboard set of slides. The topics discussed in these slides are Planning Completed, Design Completed, Development, Testing Waiting. This is an immediately available PowerPoint presentation that can be conveniently customized. Download it and convince your audience.
-
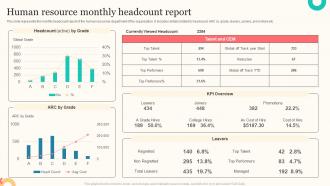 Human Resource Monthly Headcount Report
This slide represents the monthly headcount report of the human resources department of the organization. It includes details related to headcount, ARC by grade, leavers, joiners, promotions etc. Presenting our well structured Human Resource Monthly Headcount Report. The topics discussed in this slide are Human Resource, Monthly Headcount Report, Currently Viewed Headcount. This is an instantly available PowerPoint presentation that can be edited conveniently. Download it right away and captivate your audience.
-
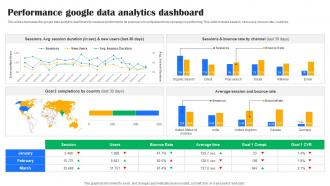 Performance Google Data Analytics Dashboard
This slide showcases the google data analytics dashboard to measure performance. Its purpose is to understand how campaign is performing. This slide includes session, new users, bounce rate, countries. Introducing our Performance Google Data Analytics Dashboard set of slides. The topics discussed in these slides are Performance, Google Data Analytics, Dashboard This is an immediately available PowerPoint presentation that can be conveniently customized. Download it and convince your audience.
-
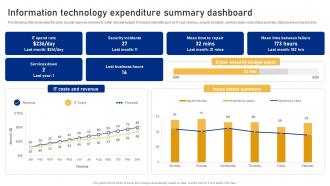 Information Technology Expenditure Summary Dashboard Cyber Risk Assessment
The following slide showcases the cyber security expense overview to better allocate budget. It includes elements such as IT cost, revenue, security incidents, services down, issue status summary, total business hours lost etc. Deliver an outstanding presentation on the topic using this Information Technology Expenditure Summary Dashboard Cyber Risk Assessment Dispense information and present a thorough explanation of Security Incidents, Costs And Revenue, Issue Status Summary using the slides given. This template can be altered and personalized to fit your needs. It is also available for immediate download. So grab it now.
-
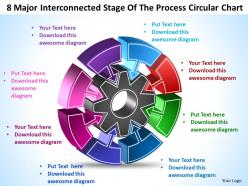 8 major interconnected stage of the process circular chart templates ppt presentation slides 812
This diagram provides an overview of the interactions of different factors in a company.
-
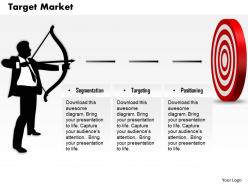 0514 target market examples powerpoint presentation
Straightforward download in easy steps. Works smoothly with other software and totally compatible with Google slides. No pixelation of the high resolution infographics on wide screen projections. Insert anywhere between your own slides. Edit the text with no length constraints. Completely modifiable size and orientation of PPT icons according to requirement. Ideal for marketers, advertisers, marketing consultants etc.
-
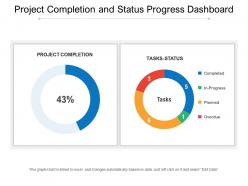 Project completion and status progress dashboard
Presenting this set of slides with name Project Completion And Status Progress Dashboard. The topics discussed in these slides are Progress Dashboard, Chart And Graph, Finance, Marketing. This is a completely editable PowerPoint presentation and is available for immediate download. Download now and impress your audience.
-
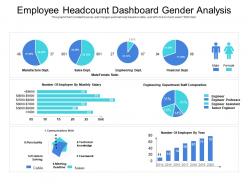 Employee headcount dashboard gender analysis
Presenting this set of slides with name Employee Headcount Dashboard Gender Analysis. The topics discussed in these slides are Employee, Headcount, Dashboard, Gender Analysis. This is a completely editable PowerPoint presentation and is available for immediate download. Download now and impress your audience.
-
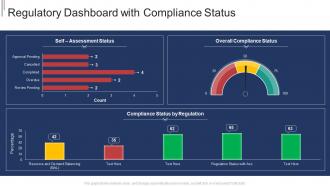 Regulatory dashboard with compliance status
Introducing our Regulatory Dashboard With Compliance Status set of slides. The topics discussed in these slides are Regulatory Dashboard With Compliance Status. This is an immediately available PowerPoint presentation that can be conveniently customized. Download it and convince your audience.
-
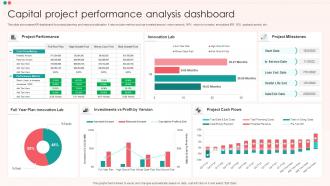 Capital Project Performance Analysis Dashboard
This slide showcases KPI dashboard for project planning and resource allocation. It also include metrics such as invested amount, return amount, NPV, return to investor, annualized IRR, ROI, payback period, etc. Introducing our Capital Project Performance Analysis Dashboard set of slides. The topics discussed in these slides are Project Performance, Innovation Lab, Project Milestones. This is an immediately available PowerPoint presentation that can be conveniently customized. Download it and convince your audience.
-
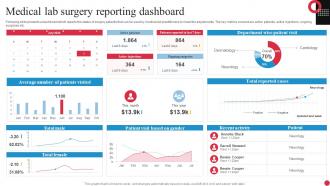 Medical Lab Surgery Reporting Dashboard
Following slide presents a dashboard which reports the status of surgery patients that can be used by medical lab practitioners to make the adjustments. The key metrics covered are active patients, active injections, ongoing surgeries etc. Introducing our Medical Lab Surgery Reporting Dashboard set of slides. The topics discussed in these slides are Active Patients, Department. This is an immediately available PowerPoint presentation that can be conveniently customized. Download it and convince your audience.
-
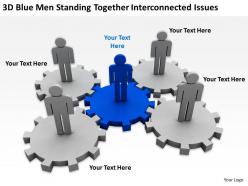 3d blue men standing together interconnected issues ppt graphics icons
We are proud to present our 3d blue men standing together interconnected issues ppt graphics icons. This 3D man diagram representing pie chart will help you to organize the interconnected factors of Business. You have noted down some very fruitful ideas that have occurred to you at random moments. Organize them all and prioritize them effectively.
-
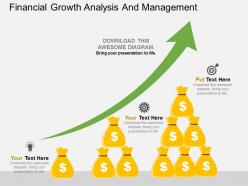 New financial growth analysis and management flat powerpoint design
Presenting new financial growth analysis and management flat powerpoint design. This Power Point template diagram has been crafted with graphic of growth arrow and coin bar graph diagram. This PPT diagram contains the concept of financial growth analysis and management. Use this PPT diagram for business and technology related presentations.
-
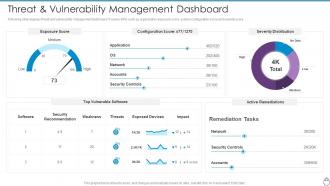 Cybersecurity Risk Management Framework Threat And Vulnerability Management Dashboard
Following slide displays threat and vulnerability management dashboard. It covers KPIs such as organization exposure score, system configuration score and severity score. Present the topic in a bit more detail with this Cybersecurity Risk Management Framework Threat And Vulnerability Management Dashboard. Use it as a tool for discussion and navigation on Exposure Score, Configuration Score, Severity Distribution, Weakness, Threats. This template is free to edit as deemed fit for your organization. Therefore download it now.
-
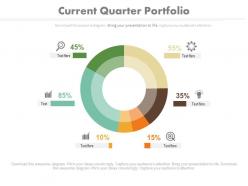 Apt current quarter portfolio for business analysis powerpoint slides
Other than providing you with an excellent experience this PPT slide can be used by professionals for discussing financial and business matters using a flow chart. You can easily ungroup the elements shown in the diagram and according to your liking. Download this slide and insert your company's logo for a professional look and experience it in full screen version.
-
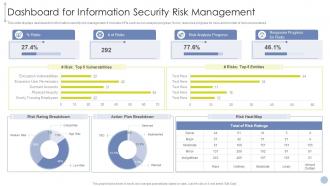 Obtaining ISO 27001 Certificate Dashboard For Information Security Risk Management
This slide displays dashboard for information security risk management. It includes KPIs such as risk analysis progress, percent risk, response progress for risks and number of risks encountered. Deliver an outstanding presentation on the topic using this Obtaining ISO 27001 Certificate Dashboard For Information Security Risk Management. Dispense information and present a thorough explanation of Risk Analysis Progress, Response Progress Risks, Risk Rating Breakdown using the slides given. This template can be altered and personalized to fit your needs. It is also available for immediate download. So grab it now.
-
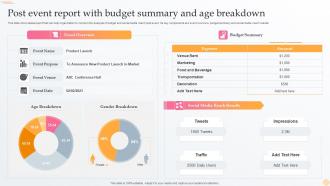 Post Event Report With Budget Summary And Age Breakdown
This slide showcases report that can help organization to conduct the analysis of budget and social media reach post event. Its key components are event overview, budget summary and social media reach results Introducing our Post Event Report With Budget Summary And Age Breakdown set of slides. The topics discussed in these slides are Post Event Report, Budget Summary, Age Breakdown. This is an immediately available PowerPoint presentation that can be conveniently customized. Download it and convince your audience.
-
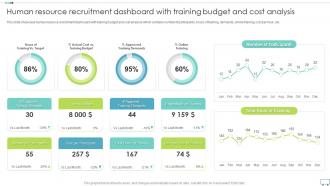 Human Resource Recruitment Dashboard With Training Budget And Cost Analysis
This slide showcase human resource recruitment dashboard with training budget and cost analysis which contains number of participants, hours of training, demands, online training, cost per hour, etc. Introducing our Human Resource Recruitment Dashboard With Training Budget And Cost Analysis set of slides. The topics discussed in these slides are Human Resource Recruitment, Dashboard, Training Budget, Cost Analysis. This is an immediately available PowerPoint presentation that can be conveniently customized. Download it and convince your audience.
-
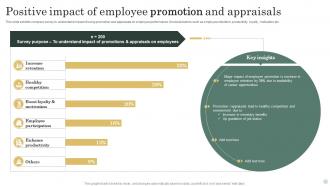 Positive Impact Of Employee Promotion And Appraisals
This slide exhibits company survey to understand impact of using promotion and appraisals on employee performance. It include factors such as employee retention, productivity, loyalty, motivation etc. Introducing our Positive Impact Of Employee Promotion And Appraisals set of slides. The topics discussed in these slides are Increase Retention, Healthy Competition, Employee Participation. This is an immediately available PowerPoint presentation that can be conveniently customized. Download it and convince your audience.


