Finance PowerPoint Templates, Presentation Slide Diagrams & PPT Graphics
- Sub Categories
-
- 30 60 90 Day Plan
- Advertising
- Agile Development
- Aims and Objectives
- Arrows
- Before and After
- Blockchain Bitcoin
- Boxes
- Business
- Calender
- Case Study
- Celebrations
- Certificates
- Challenges Opportunities
- Channel Distribution
- Children
- Communication
- Competitive Landscape
- Computer
- Concepts
- Construction Management
- Corporate
- Crowdfunding
- Current State Future State
- Custom PowerPoint Diagrams
- Digital Transformation
- Dos and Donts
- Economics
- Education
- Environment
- Events
- Festival
- Finance
- Financials
- Food
- Game
- Gap Analysis
- Generic
- Geographical
- Health
- Heatmaps
- Holidays
- Icons
- Input Process Output
- Internet
- Key Messages
- Key Wins
- Ladder
- Leadership
- Lists
- Lucky Draw
- Management
- Marketing
- Measuring
- Medical
- Music
- News
- Next Steps
- People Process Technology
- Pillars
- Planning
- Post-it-Notes
- Problem Statement
- Process
- Proposal Management
- Pros and Cons
- Puzzle
- Puzzles
- Recruitment Strategy
- Religion
- Research and Development
- Risk Mitigation Strategies
- Roadmap
- Selling
- Shapes
- Short Term Long Term
- Social
- Stairs
- Start Stop Continue
- Strategy
- Symbol
- Technology
- Thesis Defense Dissertation
- Timelines
- Traffic
- Transition Plan
- Transportation
- Vehicles
- Venture Capital Funding
- Warning
- Winners
- Word Cloud
-
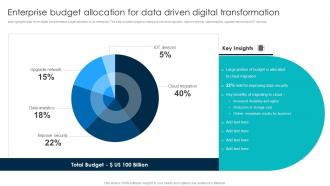 Enterprise Budget Allocation For Data Driven Digital Transformation
This slide highlights data driven digital transformation budget allocation in an enterprise. This slide includes budget on tasks such as cloud migration, improve security, data analytics, upgrade network and IOT devices. Introducing our Enterprise Budget Allocation For Data Driven Digital Transformation set of slides. The topics discussed in these slides are Deeper Customer Intelligence, Reimagined Processes, New Business Opportunities. This is an immediately available PowerPoint presentation that can be conveniently customized. Download it and convince your audience.
-
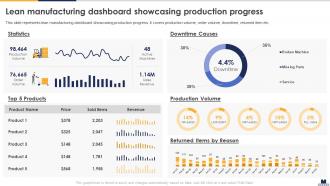 Lean Manufacturing Dashboard Showcasing Production Progress Implementing Lean Production
This slide represents lean manufacturing dashboard showcasing production progress. It covers production volume, order volume, downtime, returned item etc. Present the topic in a bit more detail with this Lean Manufacturing Dashboard Showcasing Production Progress Implementing Lean Production. Use it as a tool for discussion and navigation on Statistics, Downtime Causes, Production Volume. This template is free to edit as deemed fit for your organization. Therefore download it now.
-
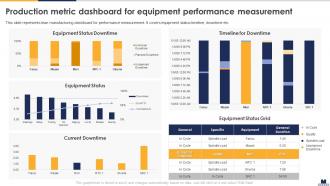 Production Metric Dashboard Implementing Lean Production
This slide represents lean manufacturing dashboard for performance measurement. It covers equipment status timeline, downtime etc. Deliver an outstanding presentation on the topic using this Production Metric Dashboard Implementing Lean Production. Dispense information and present a thorough explanation of Equipment Status Downtime, Equipment Status Grid, Timeline For Downtime using the slides given. This template can be altered and personalized to fit your needs. It is also available for immediate download. So grab it now.
-
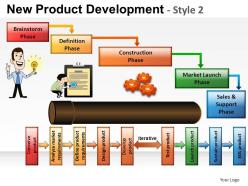 New product development 2 powerpoint presentation slides
These high quality, editable pre-designed powerpoint slides and powerpoint templates have been carefully created by our professional team to help you impress your audience. Each graphic in every powerpoint slide is vector based and is 100% editable in powerpoint. Each and every property of any slide - color, size, shading etc can be modified to build an effective powerpoint presentation. Use these slides to convey complex business concepts in a simplified manner. Any text can be entered at any point in the powerpoint slide. Simply DOWNLOAD, TYPE and PRESENT!
-
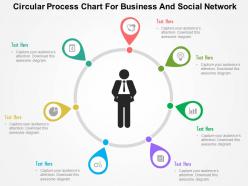 Circular process chart for business and social network flat powerpoint design
We are proud to present our circular process chart for business and social network flat powerpoint design. Graphic of circular process chart has been used to design this power point template diagram. This PPT diagram contains the concept of social networking. Use this PPT diagram for business and social network related presentations.
-
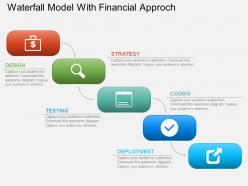 Hm waterfall model with financial approach powerpoint template
We are proud to present our hm waterfall model with financial approach powerpoint template. This power point template diagram has been crafted with graphic of waterfall model . This PPT diagram contains the concept of financial approach representation. Use this PPT diagram for finance and business related presentations.
-
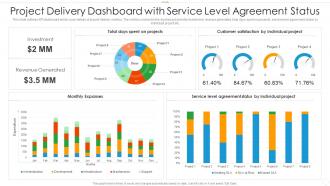 Project delivery dashboard with service level agreement status
This slide outlines KPI dashboard which cover details of project delivery metrics. The metrics covered in the dashboard are total investment, revenue generated, total days spent on projects, service level agreement status by individual project etc. Introducing our Project Delivery Dashboard With Service Level Agreement Status set of slides. The topics discussed in these slides are Project Delivery Dashboard With Service Level Agreement Status. This is an immediately available PowerPoint presentation that can be conveniently customized. Download it and convince your audience.
-
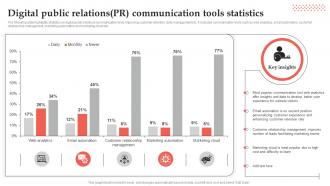 Digital Public Relations Pr Communication Tools Statistics
The following slide highlights statistics on digital public relations communication tools improving customer retention, data management etc. It includes communication tools such as web analytics, email automation, customer relationship management, marketing automation and marketing cloud etc. Presenting our well structured Digital Public Relations Pr Communication Tools Statistics. The topics discussed in this slide are Popular Communication, Develop Better User.This is an instantly available PowerPoint presentation that can be edited conveniently. Download it right away and captivate your audience.
-
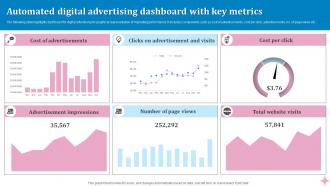 Automated Digital Advertising Dashboard With Key Metrics
The following slide highlights dashboard for digital advertising for graphical representation of marketing performance. It includes components such as cost of advertisements, cost per click, advertisements, no. of page views etc. Introducing our Automated Digital Advertising Dashboard With Key Metrics set of slides. The topics discussed in these slides are Advertisement Impressions, Cost Per Click. This is an immediately available PowerPoint presentation that can be conveniently customized. Download it and convince your audience.
-
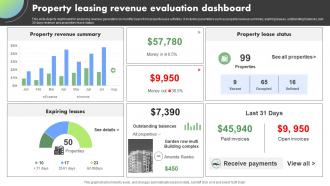 Property Leasing Revenue Evaluation Dashboard
This slide depicts dashboard for analysing revenue generation on monthly basis from property lease activities. It includes parameters such as property revenue summary, expiring leases, outstanding balances, last 30 days revenue and properties lease status. Introducing our Property Leasing Revenue Evaluation Dashboard set of slides. The topics discussed in these slides are Property Revenue Summary, Property Lease Status. This is an immediately available PowerPoint presentation that can be conveniently customized. Download it and convince your audience.
-
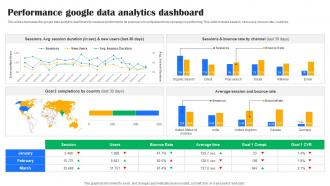 Performance Google Data Analytics Dashboard
This slide showcases the google data analytics dashboard to measure performance. Its purpose is to understand how campaign is performing. This slide includes session, new users, bounce rate, countries. Introducing our Performance Google Data Analytics Dashboard set of slides. The topics discussed in these slides are Performance, Google Data Analytics, Dashboard This is an immediately available PowerPoint presentation that can be conveniently customized. Download it and convince your audience.
-
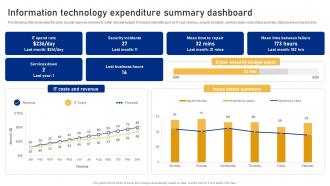 Information Technology Expenditure Summary Dashboard Cyber Risk Assessment
The following slide showcases the cyber security expense overview to better allocate budget. It includes elements such as IT cost, revenue, security incidents, services down, issue status summary, total business hours lost etc. Deliver an outstanding presentation on the topic using this Information Technology Expenditure Summary Dashboard Cyber Risk Assessment Dispense information and present a thorough explanation of Security Incidents, Costs And Revenue, Issue Status Summary using the slides given. This template can be altered and personalized to fit your needs. It is also available for immediate download. So grab it now.
-
 Strategic alignment process diagarm ppt powerpoint slides
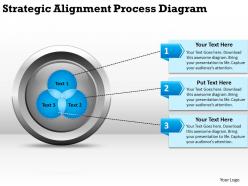
Best for strategy planners, change managers, IT professionals and operations managers. 100 % pre built to save time. Professional presentation image with a arty touch. From PowerPoint background to text, color, layout and font edit anything. Apply resizing without compromising with high res. Goes well with Google slides. Simple PDF or JPG format conversion process. Easy and fast single click downloading process.
-
 0314 business ppt diagram business ideas scale graphics powerpoint template
Highly beneficial flat PowerPoint Slide for highlighting business ideas. Makes the information clear in the mind of the audience. Editable visuals, colors and text. Easy to edit and customize as per your needs. Beneficial for industry professionals, technologists, managers, executives, researchers, sales people, etc. Flexible presentation designs can be presented in standard and widescreen view. Have a futuristic and realistic approach. Privilege of insertion of logo and trademarks for more personalization. Easy to download and save.
-
 0115 3d arrow diagram for growth and development powerpoint template
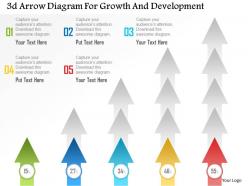
Presentation diagram harmonized well with Google slides. Alter the PowerPoint slide by addition of business label. One click download and simple to transform into JPEG and PDF document. Precise and easy to comprehend information. Top quality PPT template. Preference to present design in standard and widescreen display view. PowerPoint design can be downloaded with different nodes and stages.
-
 Business case summary with graph and key findings
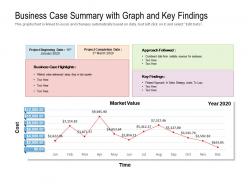
Presenting this set of slides with name Business Case Summary With Graph And Key Findings. The topics discussed in these slides are Business Case Highlights, Approach Followed, Key Findings, Market Value, Cost. This is a completely editable PowerPoint presentation and is available for immediate download. Download now and impress your audience.
-
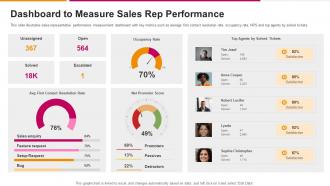 Dashboard Snapshot To Measure Sales Rep Performance Successful Sales Strategy To Launch
This slide illustrates sales representative performance measurement dashboard with key metrics such as average first contact resolution rate, occupancy rate, NPS and top agents by solved tickets. Present the topic in a bit more detail with this Dashboard Snapshot To Measure Sales Rep Performance Successful Sales Strategy To Launch. Use it as a tool for discussion and navigation on Dashboard To Measure Sales Rep Performance. This template is free to edit as deemed fit for your organization. Therefore download it now.
-
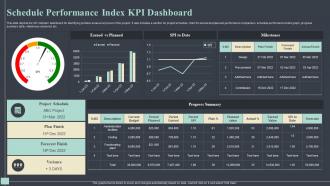 Schedule Performance Index KPI Dashboard
This slide depicts the SPI indicator dashboard for identifying problem areas at any level of the project. It also includes a section for project schedule, chart for earned and planned performance comparison, schedule performance index graph, progress summary table, milestones achieved, etc. Introducing our Schedule Performance Index KPI Dashboard set of slides. The topics discussed in these slides are Schedule Performance, Project Schedule, Forecast Finish. This is an immediately available PowerPoint presentation that can be conveniently customized. Download it and convince your audience.
-
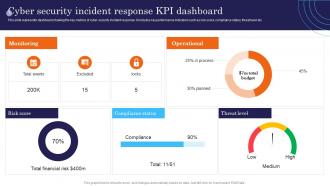 Cyber Security Incident Response KPI Dashboard Incident Response Strategies Deployment
This slide represents dashboard showing the key metrics of cyber security incident response. It includes key performance indicators such as risk score, compliance status, threat level etc. Deliver an outstanding presentation on the topic using this Cyber Security Incident Response KPI Dashboard Incident Response Strategies Deployment. Dispense information and present a thorough explanation of Monitoring, Operational, Score using the slides given. This template can be altered and personalized to fit your needs. It is also available for immediate download. So grab it now.
-
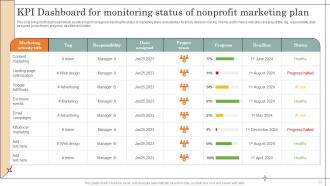 KPI Dashboard For Monitoring Status Of Nonprofit Marketing Plan
This slide brings forth dashboard which assists project managers in tracking the status of marketing plans and activities for timely decision making. The key performance indicators are project title, tag, responsibility, date assigned, project team, progress, deadline and status. Presenting our well structured KPI Dashboard For Monitoring Status Of Nonprofit Marketing Plan. The topics discussed in this slide are Marketing Activity, Influencer Marketing, Email Campaigns. This is an instantly available PowerPoint presentation that can be edited conveniently. Download it right away and captivate your audience.
-
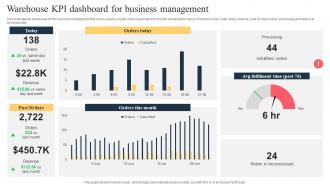 Warehouse KPI Dashboard For Business Management
This slide depicts warehouse KPI for business management that can be used by supply chain organization to monitor overall performance. It involves today order, today revenue, past 30 days orders, processing and returns to be processed. Introducing our Warehouse KPI Dashboard For Business Management set of slides. The topics discussed in these slides are Orders Today, Orders This Month. This is an immediately available PowerPoint presentation that can be conveniently customized. Download it and convince your audience.
-
 0514 business consulting diagram arrow graph for business growth powerpoint slide template
These Presentation designs, contents, themes, symbols are perfectly reorganize able according to necessity. They have sufficient space to reinstate the dummy data with the company logo, emblem etc. These Presentation graphics are germane for the business experts, students and management professionals from divergent sectors. These PowerPoint images are simply customizable in to other file configuration like PDF or JPG Well served with all Google slides and other software’s.
-
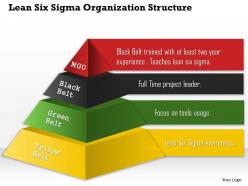 0514 lean six sigma organization structure powerpoint presentation
Runs very well with softwares and is easy to download. Compatible with Google slides. Picture graphics do not break when the layout is projected on a bigger screen. No issues in adding titles and sub-titles. Customisable PPT layout with respect to color, design and font text. Convertible into common formats like JPEG and PDF. Beneficial for professionals facilitating presentations related to company structure.
-
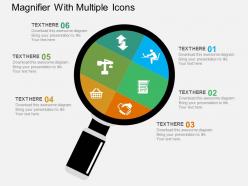 Magnifier with multiple icons flat powerpoint design
We are proud to present our magnifier with multiple icons flat powerpoint design. Graphic of magnifier and multiple icons has been used to craft this power point template diagram. This PPT diagram contains the concept of data search. Use this PPT diagram for business and marketing related presentations.
-
 Credit card payment icon template ppt slide examples
Presenting credit card payment icon template PPT slide examples PPT slide. This PPT is widely applicable by a team of managers and business analyst who foresee the business in light of change. It has impressive picture quality with high resolution. 100 percent editable slide design. There is freedom to execute the changes in color, font, text and more as per one’s personal choice. Ease of personalization with your company name and logo. It is compatible with a wide variety of format options and also harmonious with a set of software options, available both online and offline.
-
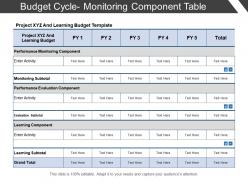 Budget cycle monitoring component table
Presenting budget cycle monitoring component table. This is a budget cycle monitoring component table. This is a five stage process. The stages in this process are budget cycle, budget circle, budget process.
-
 Project cost task design development delivery management labor material
Presenting this set of slides with name - Project Cost Task Design Development Delivery Management Labor Material. This is a four stage process. The stages in this process are Project Budgeting, Project Financing, Project Cost.
-
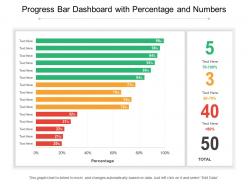 Progress bar dashboard with percentage and numbers
Presenting this set of slides with name Progress Bar Dashboard With Percentage And Numbers. The topics discussed in these slides are Progress Dashboard, Chart And Graph, Finance, Marketing. This is a completely editable PowerPoint presentation and is available for immediate download. Download now and impress your audience.
-
 Coin stack in front of money bag icon
Presenting this set of slides with name Coin Stack In Front Of Money Bag Icon. This is a three stage process. The stages in this process are Coin Stack In Front Of Money Bag Icon. This is a completely editable PowerPoint presentation and is available for immediate download. Download now and impress your audience.
-
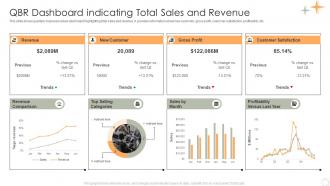 QBR Dashboard Indicating Total Sales And Revenue
This slide shows quarterly business review dashboard highlighting total sales and revenue. It provides information about new customer, gross profit, customer satisfaction, profitability, etc. Presenting our well structured QBR Dashboard Indicating Total Sales And Revenue. The topics discussed in this slide are Revenue, New Customer, Gross Profit, Customer Satisfaction. This is an instantly available PowerPoint presentation that can be edited conveniently. Download it right away and captivate your audience.
-
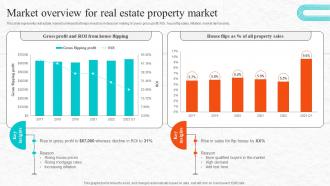 Fix And Flip Process For Property Renovation Market Overview For Real Estate Property
This slide represents real estate market summary that helps investors in decision making. It covers gross profit, ROI, house flip sales, inflation, market demand etc. Present the topic in a bit more detail with this Fix And Flip Process For Property Renovation Market Overview For Real Estate Property. Use it as a tool for discussion and navigation on House Flips, Property Sales, ROI. This template is free to edit as deemed fit for your organization. Therefore download it now.
-
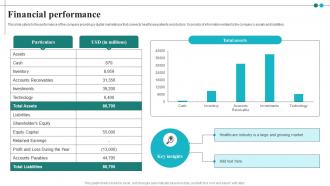 Financial Performance Remote Patient Care Marketplace Investor Funding Elevator Pitch Deck
This slide caters to the performance of the company providing a digital marketplace that connects healthcare patients and doctors. It consists of information related to the companys assets and liabilities. Present the topic in a bit more detail with this Financial Performance Remote Patient Care Marketplace Investor Funding Elevator Pitch Deck. Use it as a tool for discussion and navigation on Healthcare Industry, Key Insights, Growing Market. This template is free to edit as deemed fit for your organization. Therefore download it now.
-
 Real Estate Rental Feasibility Study
This slide showcases real estate rental feasibility study as per the number of bedrooms to show growth in market rental properties and rise in demand for housing from the year 2018 to 2023. Introducing our Real Estate Rental Feasibility Study set of slides. The topics discussed in these slides are Market Rent Per Unit, Rise In Interest Rate, Rental Properties. This is an immediately available PowerPoint presentation that can be conveniently customized. Download it and convince your audience.
-
 Two idea clusters powerpoint slides presentation diagrams templates
We are proud to present our two idea clusters powerpoint slides presentation diagrams templates. This diagram contains an idea which combines into one. It shows to your group how they mesh together to drive the whole. It help you capture alternate viewpoints or to evaluate options for their merit or value
-
 Money bag with dollar symbol flat powerpoint design
We are proud to present our money bag with dollar symbol flat powerpoint design. This power point template diagram has been crafted with graphic of money bag and dollar symbol. This PPT diagram contains the concept of money protection. Use this PPT diagram for business and finance related presentations.
-
 Power Business Intelligence Report For Tracking Financial Performance
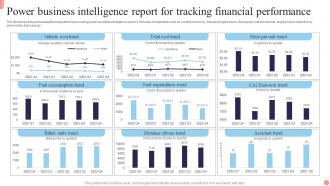
The following slide showcases financial performance using power business intelligence report. It includes components such as monthly economy, reduced engine hours, decrease in carbon dioxide, engine hours reduction by automobile, fuel savings. Presenting our well structured Power Business Intelligence Report For Tracking Financial Performance. The topics discussed in this slide are Consumption Trend, Expenditure Trend, Emission Trend. This is an instantly available PowerPoint presentation that can be edited conveniently. Download it right away and captivate your audience.
-
 Enterprise resource planning manufacturing powerpoint slides and ppt templates db
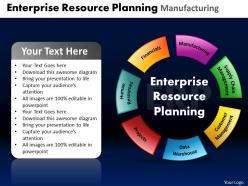
These high quality, editable pre-designed powerpoint slides and powerpoint templates have been carefully created by our professional team to help you impress your audience. Each graphic in every powerpoint slide is vector based and is 100% editable in powerpoint.Each and every property of any slide - color, size, shading etc can be modified to build an effective powerpoint presentation. Use these slides to convey complex business concepts in a simplified manner. Any text can be entered at any point in the powerpoint slide. Simply DOWNLOAD, TYPE and PRESENT
-
 1214 four water drops with percentage values powerpoint presentation
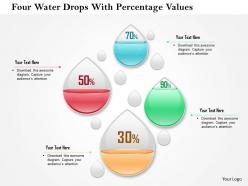
Fabulous introduction of plans and hues. Fantastic quality pictures which don't pixelate when anticipated on wide screen. Similarity with different organization alternatives like JPEG and JPG. Agreeable with various on the web and disconnected programming choices. Fully editable slide graphics. Compatible with various programming design like JPEG, JPG and PDF. Directive slides are given to help you in modifying the layout look and feel.
-
 Financial metrics and kpi diagram presentation visual aids
Presenting financial metrics and kpi diagram presentation visual aids. This is a financial metrics and kpi diagram presentation visual aids. This is a three stage process. The stages in this process are operating profit last 12 months, total income act vs forecast between 2009 and 2010, income by qtr by tr between 2007 and 2010.
-
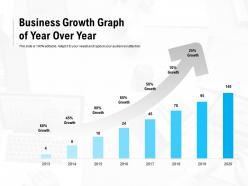 Business growth graph of year over year
Presenting this set of slides with name Business Growth Graph Of Year Over Year. This is a eight stage process. The stages in this process are Business Growth Graph Of Year Over Year. This is a completely editable PowerPoint presentation and is available for immediate download. Download now and impress your audience.
-
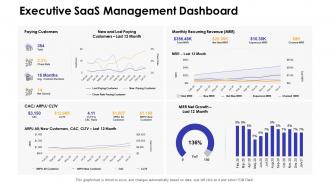 Dashboards by function executive saas management dashboard
Deliver an outstanding presentation on the topic using this Dashboards By Function Executive Saas Management Dashboard. Dispense information and present a thorough explanation of Management, Dashboard, Executive using the slides given. This template can be altered and personalized to fit your needs. It is also available for immediate download. So grab it now.
-
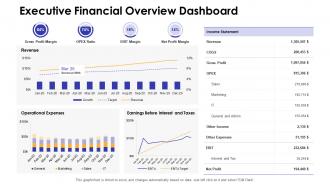 Executive financial overview dashboard snapshot by function
Present the topic in a bit more detail with this Executive Financial Overview Dashboard Snapshot By Function. Use it as a tool for discussion and navigation on Executive Financial Overview Dashboard. This template is free to edit as deemed fit for your organization. Therefore download it now.
-
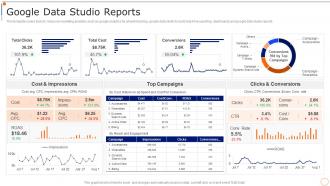 Content Marketing Playbook Google Data Studio Reports
This template covers tools to measure marketing analytics such as google analytics for all web tracking, google data studio to build real time reporting dashboards and google data studio reports. Present the topic in a bit more detail with this Content Marketing Playbook Google Data Studio Reports. Use it as a tool for discussion and navigation on Google Data Studio Reports. This template is free to edit as deemed fit for your organization. Therefore download it now.
-
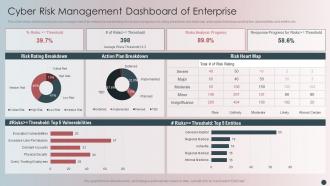 Cyber Risk Management Dashboard Of Enterprise
This slide shows dashboard of cyber risk management of an enterprise representing risk analysis progress, risk rating breakdown and heat map, action plan breakdown and top five vulnerabilities and entities etc. Introducing our Cyber Risk Management Dashboard Of Enterprise set of slides. The topics discussed in these slides are Cyber Risk Management, Dashboard Enterprise. This is an immediately available PowerPoint presentation that can be conveniently customized. Download it and convince your audience.
-
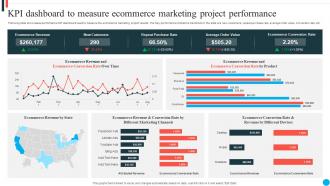 KPI Dashboard To Measure Ecommerce Marketing Project Performance
Following slide showcases performance KPI dashboard used to measure the ecommerce marketing project results. The Key performance indicators mentioned in the slide are new customers, repeat purchase rate, average order value, conversion rate, etc. Presenting our well-structured KPI Dashboard To Measure Ecommerce Marketing Project Performance. The topics discussed in this slide are KPI Dashboard, Measure, Ecommerce Marketing, Project Performance. This is an instantly available PowerPoint presentation that can be edited conveniently. Download it right away and captivate your audience.
-
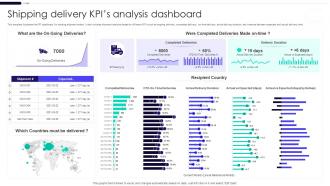 Shipping Delivery KPIs Analysis Dashboard
This template illustrates the KPI dashboard for tracking shipment orders. It also includes shipment analysis based on different KPIs such as ongoing delivery, completed delivery, on time delivery, actual delivery duration, and variance between expected and actual delivery time. Presenting our well-structured Shipping Delivery KPIs Analysis Dashboard. The topics discussed in this slide are Shipping Delivery, KPIS Analysis, Dashboard. This is an instantly available PowerPoint presentation that can be edited conveniently. Download it right away and captivate your audience.
-
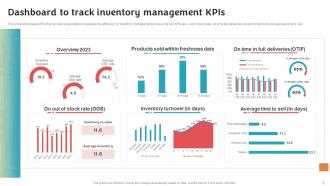 Dashboard To Track Inventory Management Stock Inventory Procurement And Warehouse
This slide showcases KPIs that can help organization to evaluate the efficiency of inventory management process. Its key KPIs are out of stock rate, on time full deliveries, inventory turnover and average time to sell. Present the topic in a bit more detail with this Dashboard To Track Inventory Management Stock Inventory Procurement And Warehouse. Use it as a tool for discussion and navigation on Products Sold, Inventory Turnover, Average Time To Sell. This template is free to edit as deemed fit for your organization. Therefore download it now.
-
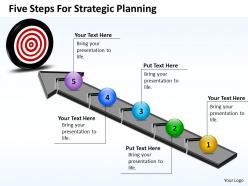 Business powerpoint templates five steps for strategic planning sales ppt slides
This PowerPoint template shows Step Plan which consists of 5 Stages. It can be used to to show grouped or related information.
-
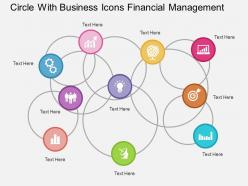 Circle with business icons financial management flat powerpoint design
We are proud to present our circle with business icons financial management flat powerpoint design. Graphic of business icons in circle has been used to craft this power point template diagram. This PPT diagram contains the concept of financial management. Use this PPT diagram for finance and business related presentations.
-
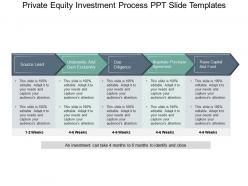 Private equity investment process ppt slide templates
Presenting private equity investment process ppt slide templates. This is a private equity investment process ppt slide templates. This is a five stage process. The stages in this process are investment, venture capital, funding, private equity.
-
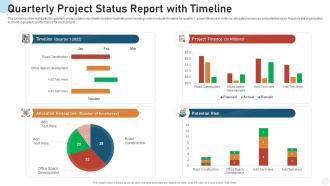 Quarterly project status report with timeline
Introducing our Quarterly Project Status Report With Timeline set of slides. The topics discussed in these slides are Timeline, Project Finance, Potential Risk. This is an immediately available PowerPoint presentation that can be conveniently customized. Download it and convince your audience.
-
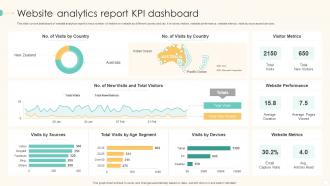 Website Analytics Report KPI Dashboard Snapshot
Introducing our Website Analytics Report KPI Dashboard Snapshot set of slides. The topics discussed in these slides are Website Analytics Report, KPI Dashboard Snapshot. This is an immediately available PowerPoint presentation that can be conveniently customized. Download it and convince your audience.
-
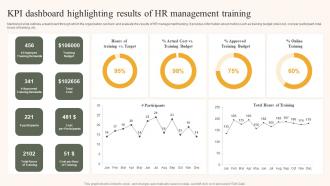 KPI Dashboard Highlighting Results Of HR Management Training
Mentioned slide outlines a dashboard through which the organization can track and evaluate the results of HR management training. It provides information about metrics such as training budget, total cost, cost per participant, total hours of training, etc. Presenting our well structured KPI Dashboard Highlighting Results Of HR Management Training. The topics discussed in this slide are Training Budget, Total Cost, Cost Per Participants. This is an instantly available PowerPoint presentation that can be edited conveniently. Download it right away and captivate your audience.
-
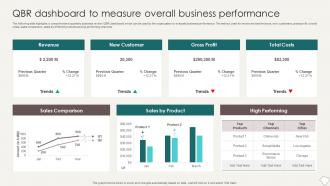 QBR Dashboard To Measure Overall Business Performance
The following slide highlights a comprehensive quarterly business review QBR dashboard which can be used by the organization to evaluate business performance. The metrics used for review are total revenue, new customers, gross profit, overall costs, sales comparison, sales by different products and top performing channels. Introducing our QBR Dashboard To Measure Overall Business Performance set of slides. The topics discussed in these slides are Revenue, New Customer, Gross Profit, Total Costs. This is an immediately available PowerPoint presentation that can be conveniently customized. Download it and convince your audience.
-
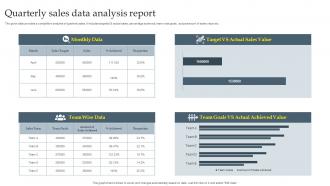 Quarterly Sales Data Analysis Report
The given slide provides a competitive analysis of quarterly sales. It includes targeted and actual sales, percentage achieved, team wise goals, actual amount of sales value etc. Presenting our well-structured Quarterly Sales Data Analysis Report. The topics discussed in this slide are Quarterly Sales, Data Analysis Report. This is an instantly available PowerPoint presentation that can be edited conveniently. Download it right away and captivate your audience.
-
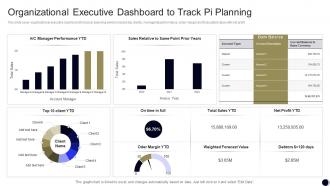 Organizational Executive Dashboard To Track PI Planning
This slide cover organizational executive dashboard to track pi planning which includes top clients, managerial performance, order margin and forecasted value with net profit Presenting our well-structured Organizational Executive Dashboard To Track PI Planning. The topics discussed in this slide are Organizational, Executive Dashboard, Track PI Planning. This is an instantly available PowerPoint presentation that can be edited conveniently. Download it right away and captivate your audience.
-
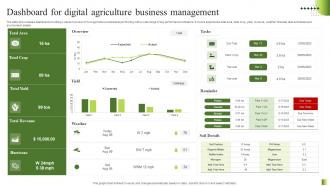 Dashboard For Digital Agriculture Business Management
Presenting our well structured Dashboard For Digital Agriculture Business Management. The topics discussed in this slide are Overview, Tasks, Soil Details. This is an instantly available PowerPoint presentation that can be edited conveniently. Download it right away and captivate your audience. The slide showcases a dashboard providing a visual overview of how agriculture business is performing with a wide range of key performance indicators. It covers aspects like total area, total crop, yield, revenue, weather forecast, task schedules and environment details.
-
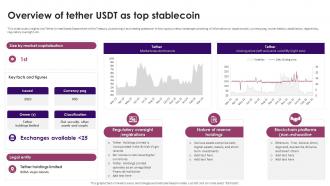 Guide On Defining Roles Of Stablecoins Overview Of Tether Usdt As Top Stablecoin BCT SS
This slide covers insights into Tether United States Department of the Treasury, positioning it as a leading stablecoin in the cryptocurrency landscape consisting of information on issuance year, currency peg, owner details, classification, legal entity, regulatory oversight, etc. Present the topic in a bit more detail with this Guide On Defining Roles Of Stablecoins Overview Of Tether Usdt As Top Stablecoin BCT SS. Use it as a tool for discussion and navigation on Nature Of Reserve Holdings, Blockchain Platforms, Regulatory Oversight Or Registrations. This template is free to edit as deemed fit for your organization. Therefore download it now.
-
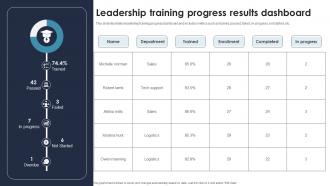 Leadership Training Progress Results Dashboard
This slide illustrates leadership training progress dashboard and includes metrics such as trained, passed, failed, in- progress, not started, etc. Introducing our Leadership Training Progress Results Dashboard set of slides. The topics discussed in these slides are Department, Enrollment, In Progress.This is an immediately available PowerPoint presentation that can be conveniently customized. Download it and convince your audience.
-
 12 pieces 3x4 rectangular jigsaw puzzle matrix powerpoint templates 0812
This template is skillfully designed and is completely editable to suit all the needs and requirements of the user. The color of the font, its size, style, and all other elements can be customized according to the user's desire The text in the PPT placeholder can be replaced with the desired information making this template highly flexible and adaptable as well. This template is also compatible with various Microsoft versions and formats like Google Slides, JPG, PDF, etc so the user will face no issue in saving it in the format of his choice.


