Finance PowerPoint Templates, Presentation Slide Diagrams & PPT Graphics
- Sub Categories
-
- 30 60 90 Day Plan
- Advertising
- Agile Development
- Aims and Objectives
- Arrows
- Before and After
- Blockchain Bitcoin
- Boxes
- Business
- Calender
- Case Study
- Celebrations
- Certificates
- Challenges Opportunities
- Channel Distribution
- Children
- Communication
- Competitive Landscape
- Computer
- Concepts
- Construction Management
- Corporate
- Crowdfunding
- Current State Future State
- Custom PowerPoint Diagrams
- Digital Transformation
- Dos and Donts
- Economics
- Education
- Environment
- Events
- Festival
- Finance
- Financials
- Food
- Game
- Gap Analysis
- Generic
- Geographical
- Health
- Heatmaps
- Holidays
- Icons
- Input Process Output
- Internet
- Key Messages
- Key Wins
- Ladder
- Leadership
- Lists
- Lucky Draw
- Management
- Marketing
- Measuring
- Medical
- Music
- News
- Next Steps
- People Process Technology
- Pillars
- Planning
- Post-it-Notes
- Problem Statement
- Process
- Proposal Management
- Pros and Cons
- Puzzle
- Puzzles
- Recruitment Strategy
- Religion
- Research and Development
- Risk Mitigation Strategies
- Roadmap
- Selling
- Shapes
- Short Term Long Term
- Social
- Stairs
- Start Stop Continue
- Strategy
- Symbol
- Technology
- Thesis Defense Dissertation
- Timelines
- Traffic
- Transition Plan
- Transportation
- Vehicles
- Venture Capital Funding
- Warning
- Winners
- Word Cloud
-
 Debt as business problem icon
Presenting this set of slides with name Debt As Business Problem Icon. This is a one stage process. The stages in this process are Business, Problem, Businessmen, Solution. This is a completely editable PowerPoint presentation and is available for immediate download. Download now and impress your audience.
-
 Cost saving strategy icon with piggy bank
Presenting this set of slides with name Cost Saving Strategy Icon With Piggy Bank. This is a one stage process. The stages in this process are Cost Saving, Strategy Icon, Piggy Bank. This is a completely editable PowerPoint presentation and is available for immediate download. Download now and impress your audience.
-
 Hand holding property investment icon
Presenting this set of slides with name Hand Holding Property Investment Icon. This is a one stage process. The stages in this process are Hand Holding Property Investment Icon. This is a completely editable PowerPoint presentation and is available for immediate download. Download now and impress your audience.
-
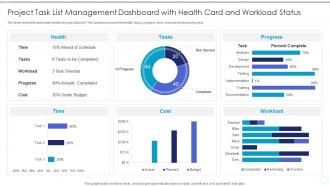 Project Task List Management Dashboard With Health Card And Workload Status
The slide shows the dashboard related to project task list. The dashboard covers the health, tasks, progress, time, cost and workload of project. Presenting our well structured Project Task List Management Dashboard With Health Card And Workload Status. The topics discussed in this slide are Management, Dashboard, Workload. This is an instantly available PowerPoint presentation that can be edited conveniently. Download it right away and captivate your audience.
-
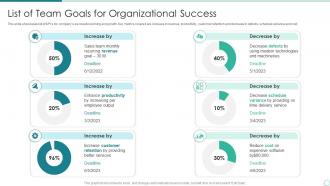 List Of Team Goals For Organizational Success In Powerpoint And Google Slides
This slide showcases list of KPIs for companys successful working and growth. Key metrics covered are increase in revenue, productivity, customer retention and decrease in defects, schedule variance and cost. Introducing our List Of Team Goals For Organizational Success In Powerpoint And Google Slides set of slides. The topics discussed in these slides are Revenue Goal, Increase Customer Retention, Enhance Productivity. This is an immediately available PowerPoint presentation that can be conveniently customized. Download it and convince your audience.
-
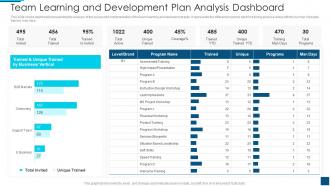 Team Learning And Development Plan Analysis Dashboard
This slide shows dashboard representing the analysis of the successful implementation of the team learning and development plan. It represents the different programs held for training purpose along with the number of people trained, man days. Introducing our Team Learning And Development Plan Analysis Dashboard set of slides. The topics discussed in these slides are Development, Analysis, Dashboard. This is an immediately available PowerPoint presentation that can be conveniently customized. Download it and convince your audience.
-
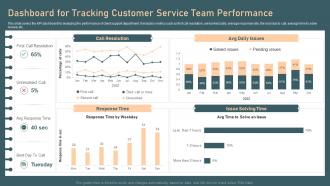 Identifying And Optimizing Customer Dashboard For Tracking Customer Service Team Performance
This slide covers the KPI dashboard for analyzing the performance of client support department. It includes metrics such as first call resolution, unresolved calls, average response rate, the best day to call, average time to solve issues, etc. Deliver an outstanding presentation on the topic using this Identifying And Optimizing Customer Dashboard For Tracking Customer Service Team Performance. Dispense information and present a thorough explanation of Dashboard For Tracking, Customer Service Team Performance using the slides given. This template can be altered and personalized to fit your needs. It is also available for immediate download. So grab it now.
-
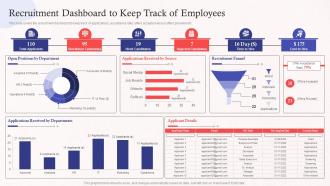 Recruitment Dashboard To Keep Track Of Employees Promoting Employer Brand On Social Media
This slide covers the recruitment dashboard to keep track of applications, acceptance ratio, offers accepted versus offers provided etc. Present the topic in a bit more detail with this Recruitment Dashboard To Keep Track Of Employees Promoting Employer Brand On Social Media. Use it as a tool for discussion and navigation on Recruitment Dashboard To Keep, Track Of Employees. This template is free to edit as deemed fit for your organization. Therefore download it now.
-
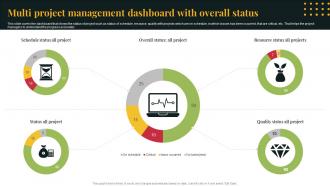 Multi Project Management Dashboard With Overall Status
This slide covers the dashboard that shows the status of project such as status of schedule, resource, quality with projects which are on schedule, in which issues has been occurred, that are critical, etc. That helps the project managers to understand the progress accurately. Presenting our well structured Multi Project Management Dashboard With Overall Status. The topics discussed in this slide are Schedule Status All Project, Resource Status All Projects, Dashboard With Overall Status. This is an instantly available PowerPoint presentation that can be edited conveniently. Download it right away and captivate your audience.
-
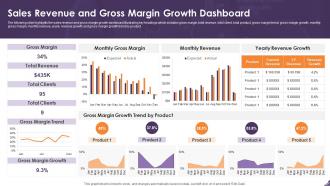 Sales Revenue And Gross Margin Growth Dashboard
The following slide highlights the sales revenue and gross margin growth dashboard illustrating key headings which includes gross margin, total revenue, total client, total product, gross margin trend, gross margin growth, monthly gross margin, monthly revenue, yearly revenue growth and gross margin growth trend by product. Introducing our Sales Revenue And Gross Margin Growth Dashboard set of slides. The topics discussed in these slides are Sales Revenue, Gross Margin Growth, Dashboard. This is an immediately available PowerPoint presentation that can be conveniently customized. Download it and convince your audience.
-
 Customer Satisfaction Survey Feedback Report For Ecommerce Website
This slide showcases customer feedback report for ecommerce website survey that can help organization to improve the navigation and usability of website on the basis of data collected. Its key components are ratings and satisfaction report. Introducing our Customer Satisfaction Survey Feedback Report For Ecommerce Website set of slides. The topics discussed in these slides are Customer Satisfaction Survey, Feedback Report, Ecommerce Website. This is an immediately available PowerPoint presentation that can be conveniently customized. Download it and convince your audience.
-
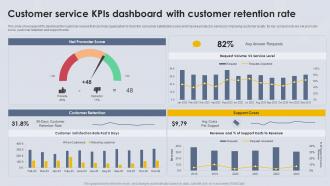 Customer Service KPIs Dashboard With Customer Retention Rate
This slide showcases KPIs dashboard for customer service that can help organization to track the consumer satisfaction score and improve product or service by improving customer loyalty. Its key components are net promoter score, customer retention and support costs. Introducing our Customer Service KPIs Dashboard With Customer Retention Rate set of slides. The topics discussed in these slides are Support Costs, Customer Retention, Net Promoter Score. This is an immediately available PowerPoint presentation that can be conveniently customized. Download it and convince your audience.
-
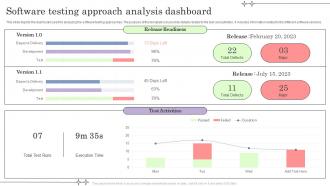 Software Testing Approach Analysis Dashboard
This slide depicts the dashboard used for analyzing the software testing approaches. The purpose of this template is to provide details related to the test and activities. It includes information related to the different software versions. Presenting our well structured Software Testing Approach Analysis Dashboard. The topics discussed in this slide are Software Testing, Approach Analysis Dashboard. This is an instantly available PowerPoint presentation that can be edited conveniently. Download it right away and captivate your audience.
-
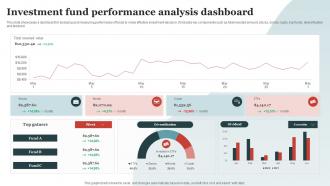 Investment Fund Performance Analysis Dashboard
This slide showcases a dashboard for analyzing and measuring performance of funds to make effective investment decision. It includes key components such as total invested amount, stocks, bonds, crypto, top funds, diversification and dividend. Introducing our Investment Fund Performance Analysis Dashboard set of slides. The topics discussed in these slides are Investment Fund, Performance Analysis Dashboard. This is an immediately available PowerPoint presentation that can be conveniently customized. Download it and convince your audience.
-
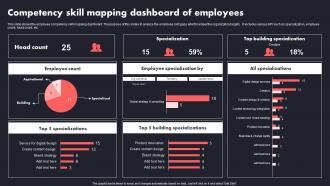 Competency Skill Mapping Dashboard Of Employees
This slide shows the employee competency skill mapping dashboard. The purpose of this slides to analyze the employee skill gaps which hamper the organization targets. It includes various KPI such as specialization, employee count, head count, etc. Presenting our well structured Competency Skill Mapping Dashboard Of Employees The topics discussed in this slide are Employee Count, Employee SpecializationThis is an instantly available PowerPoint presentation that can be edited conveniently. Download it right away and captivate your audience.
-
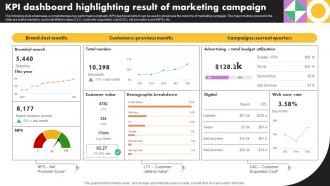 Kpi Dashboard Highlighting Result Business Marketing Strategies Mkt Ss V
The following slide showcases a comprehensive key performance indicator KPI dashboard which can be used to showcase the outcome of marketing campaign. The major metrics covered in the slide are brand mentions, customer lifetime value CLV, customer acquisition cost CAC, net promoter score NPS, etc. Present the topic in a bit more detail with this Kpi Dashboard Highlighting Result Business Marketing Strategies Mkt Ss V Use it as a tool for discussion and navigation on Customers, Campaigns This template is free to edit as deemed fit for your organization. Therefore download it now.
-
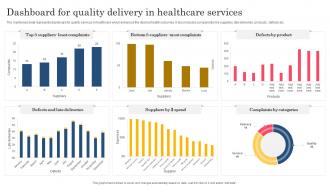 Dashboard For Quality Delivery In Healthcare Services
The mentioned slide represents dashboard for quality services in healthcare which enhances the desired health outcomes. It also includes components like suppliers, late deliveries, products, defects etc. Presenting our well structured Dashboard For Quality Delivery In Healthcare Services. The topics discussed in this slide are Least Complaints, Defects And Late Deliveries, Complaints By Categories. This is an instantly available PowerPoint presentation that can be edited conveniently. Download it right away and captivate your audience.
-
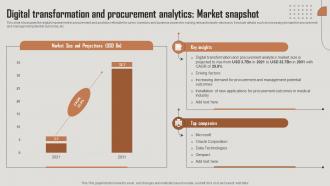 Digital Transformation And Procurement Analytics Market Snapshot
This slide showcases the digital improvement in procurement and analytics referable for users, investors and business owners for making relevant industry decisions. It include details such as increasing demand for procurement and management potential outcomes, etc. Introducing our Digital Transformation And Procurement Analytics Market Snapshot set of slides. The topics discussed in these slides are Market Size And Projections, Top Companies. This is an immediately available PowerPoint presentation that can be conveniently customized. Download it and convince your audience.
-
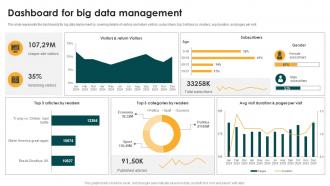 Dashboard For Big Data Management Big Data Analytics And Management
This slide represents the dashboards for big data deployment by covering details of visitors and return visitors, subscribers, top 3 articles by readers, avg duration, and pages per visit. Present the topic in a bit more detail with this Dashboard For Big Data Management Big Data Analytics And Management. Use it as a tool for discussion and navigation on Dashboard For Big Data Management. This template is free to edit as deemed fit for your organization. Therefore download it now.
-
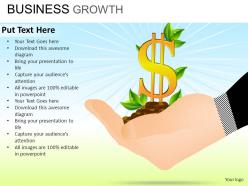 Business growth powerpoint presentation slides
These high quality, editable pre-designed powerpoint slides have been carefully created by our professional team to help you impress your audience. Each graphic in every slide is vector based and is 100% editable in powerpoint. Each and every property of any slide - color, size, shading etc can be modified to build an effective powerpoint presentation. Use these slides to convey complex business concepts in a simplified manner. Any text can be entered at any point in the powerpoint slide. Simply DOWNLOAD, TYPE and PRESENT!
-
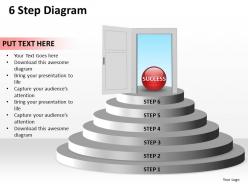 6 step diagram powerpoint slides presentation diagrams templates
This template is skillfully designed and is completely editable to suit all the needs and requirements of the user. The color of the font, its size, style, and all other elements can be customized according to the user's desire The text in the PPT placeholder can be replaced with the desired information making this template highly flexible and adaptable as well. This template is also compatible with various Microsoft versions and formats like Google Slides, JPG, PDF, etc so the user will face no issue in saving it in the format of his choice.
-
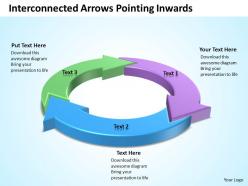 Interconnected arrows pointing inwards in circle powerpoint templates images 1121
This 3D Circular Diagram in Green, Purple and Blue color can be helpful on explaining three different approaches connected to each other for business process.
-
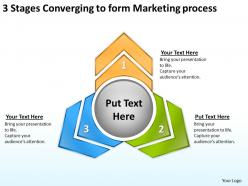 3 stages converging to form marketing process circular network ppt powerpoint templates
Marketing is a way of thinking and an approach to business that is based on the organisations attempt to meet its customers needs. Use this diagram to evolve the strategy to take you down the required path with effective marketing along the way.
-
 Business powerpoint templates marketing process vertical steps sales ppt slides
We present our Business PowerPoint Templates marketing process vertical steps Sales PPT Slides PowerPoint templates. This Vertical steps diagram is used to graphically represent a progression of steps or actions, such as in a workflow or similar process.
-
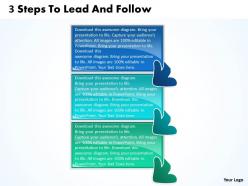 3 steps to lead and follow flowchart free powerpoint templates
Perfect resolution of the icons and the pictures in the slides. Allow instant downloading of the slide template. Trouble-free insertion of the brand name in the background. Offer 100% access to edit and modify the slide design. Beneficial for the sales and marketing professionals and the business managers.
-
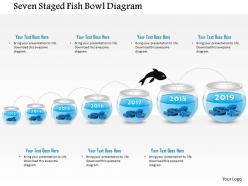 1214 seven staged fish bowl diagram powerpoint presentation
We are proud to present our 1214 seven staged fish bowl diagram powerpoint presentation. This Power Point template has been designed with seven staged fish bowl diagram. This PPT depicts the concept of finance and business process flow. Use this PPT for your business and finance related presentations.
-
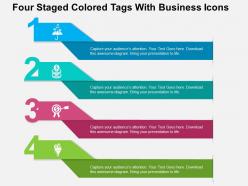 Four staged colored tags with business icons flat powerpoint design
We are proud to present our four staged colored tags with business icons flat powerpoint design. Graphic of four staged colored tags and business icons has been used to craft this power point template diagram. This PPT diagram contains the concept of result analysis .Use this PPT diagram for finance and business related presentations.
-
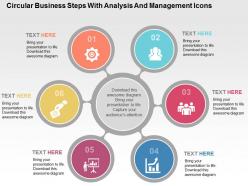 Circular business steps with analysis and management icons flat powerpoint design
We are proud to present our circular business steps with analysis and management icons flat powerpoint design. This power point template diagram has been crafted with graphic of circular business steps. This PPT diagram contains the concept of business process analysis. Use this PPT diagram for business and management related presentations.
-
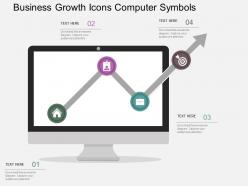 Business growth icons computer symbols flat powerpoint design
We are proud to present our business growth icons computer symbols flat powerpoint design. Concept of business growth has been displayed in this power point template diagram. This PPT diagram contains the graphic of icons and computer symbols. Use this PPT diagram for business and technology related presentations.
-
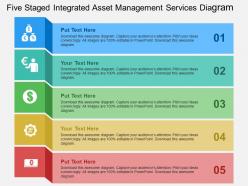 Five staged integrated asset management services diagram flat powerpoint design
We are proud to present our five staged integrated asset management services diagram flat powerpoint design. Five staged colored tags diagram has been displayed in this power point template diagram. This PPT diagram contains the concept of asset management and service. Use this PPT diagram for business and marketing related presentations.
-
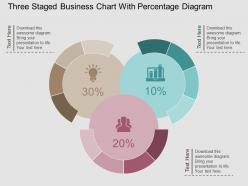 Sw three staged business chart with percentage diagram flat powerpoint design
Presenting sw three staged business chart with percentage diagram flat powerpoint design. Three staged business chart diagram and percentage has been used to craft this power point template diagram. This PPT diagram contains the concept of financial analysis and business data representation. Use this PPT diagram for business and finance related presentations.
-
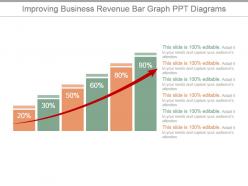 Improving business revenue bar graph ppt diagrams
Presenting improving business revenue bar graph ppt diagrams. This is a improving business revenue bar graph ppt diagrams. This is a six stage process. The stages in this process are business, finance, percentage, marketing, strategy, success, analysis.
-
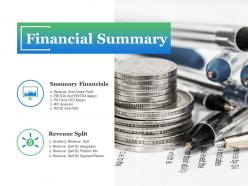 Financial summary ppt outline
Presenting this set of slides with name - Financial Summary Ppt Outline. This is a two stage process. The stages in this process are Summary Financials, Revenue Split, Financial Summary, Business, Marketing.
-
 Stock exchange image with a graph
Presenting this set of slides with name Stock Exchange Image With A Graph. The topics discussed in these slides are Marketing, Strategy, Dollar, Finance. This is a completely editable PowerPoint presentation and is available for immediate download. Download now and impress your audience.
-
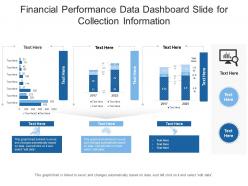 Financial performance data dashboard snapshot slide for collection information powerpoint template
This is a Financial Performance Data Dashboard Snapshot Slide For Collection Information Powerpoint Template that you can use to present real-time information about your business. With a variety of graphical representations that are in-line with the current trends, this is a great way to display quantified data and stats. This is also a great PowerPoint slide to make informed decisions based on the data and results depicted. Since this template can accommodate a lot of statistical information in one-go it can be put to use by different department heads of the organization. This PPT slide can also be used to present a thorough discussion on various KPIs, all excel-linked and susceptible to innumerable changes. Thus helping in the portrayal of calculative data in a highly professional format. Not only this, but it can also be reproduced in JPG, PNG, and PDF formats. Therefore, reinvent the wheel by downloading this PPT slide now.
-
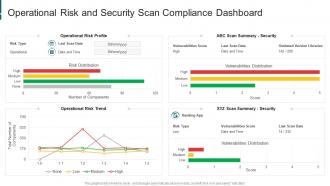 Operational risk and security scan compliance dashboard
Presenting our well structured Operational Risk And Security Scan Compliance Dashboard. The topics discussed in this slide are Operational Risk, Security, Vulnerabilities Distribution. This is an instantly available PowerPoint presentation that can be edited conveniently. Download it right away and captivate your audience.
-
 Raise Early Stage Funding Angel Investors Key Revenue Streams Of The Company
This slide shows major streams from where the company gets generates its Revenue like Subscription Fees, Indirect Sources, Third party Licensing etc. Present the topic in a bit more detail with this Raise Early Stage Funding Angel Investors Key Revenue Streams Of The Company. Use it as a tool for discussion and navigation on Indirect Sources Such, Product Subscription, Revenue Stream Here. This template is free to edit as deemed fit for your organization. Therefore download it now.
-
 Customer Satisfaction Survey Dashboard For New Product Concept Testing
This slide covers survey results dashboard based on concept testing of product. It includes results based on customer satisfaction and effort score, net promoter score, average response time, etc. Presenting our well-structured Customer Satisfaction Survey Dashboard For New Product Concept Testing. The topics discussed in this slide are Customer Satisfaction, Survey, Dashboard, New Product Concept, Testing. This is an instantly available PowerPoint presentation that can be edited conveniently. Download it right away and captivate your audience.
-
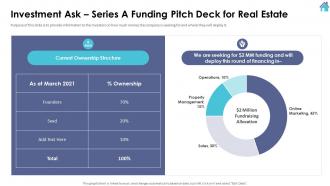 Series A Investor Funding Elevator Investment Ask Series A Funding Pitch Deck For Real Estate
Purpose of this slide is to provide information to the investors on how much money the company is seeking for and where they will deploy it. Deliver an outstanding presentation on the topic using this Series A Investor Funding Elevator Investment Ask Series A Funding Pitch Deck For Real Estate. Dispense information and present a thorough explanation of Property Management, Online Marketing, Fundraising Allocation using the slides given. This template can be altered and personalized to fit your needs. It is also available for immediate download. So grab it now.
-
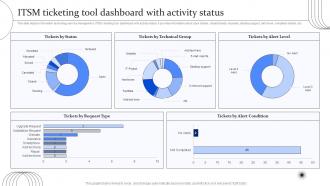 Digital Transformation Of Help Desk Management ITSM Ticketing Tool Dashboard With Activity Status
This slide depicts information technology service management ITSM ticketing tool dashboard with activity status. It provides information about open tickets, closed tickets, requests, desktop support, alert level, completed tickets, etc. Present the topic in a bit more detail with this Digital Transformation Of Help Desk Management ITSM Ticketing Tool Dashboard With Activity Status. Use it as a tool for discussion and navigation on ITSM Ticketing, Tool Dashboard, Activity Status. This template is free to edit as deemed fit for your organization. Therefore download it now.
-
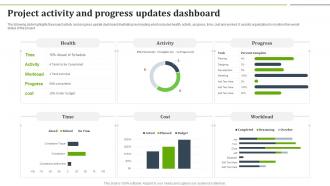 Project Activity And Progress Updates Dashboard
The following slide highlights the project activity and progress update dashboard illustrating key heading which includes health, activity, progress, time, cost and worked. It assists organization to monition the overall status of the project. Presenting our well structured Project Activity And Progress Updates Dashboard. The topics discussed in this slide are Progress, Workload, Health, Cost. This is an instantly available PowerPoint presentation that can be edited conveniently. Download it right away and captivate your audience.
-
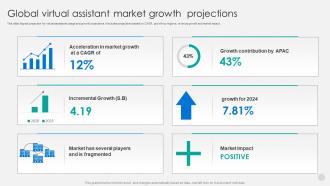 Global Virtual Assistant Market Growth Projections
This slide depicts projection for virtual assistants usage and growth projections. It includes projections based on CAGR, growth by regions, revenue growth and market impact. Introducing our Global Virtual Assistant Market Growth Projections set of slides. The topics discussed in these slides are Incremental Growth, Market Impact, Growth Contribution. This is an immediately available PowerPoint presentation that can be conveniently customized. Download it and convince your audience.
-
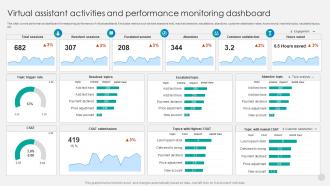 Virtual Assistant Activities And Performance Monitoring Dashboard
This slide covers performance dashboard for measuring performance of virtual assistants. It includes metrics such as total sessions held, resolved sessions, escalations, abandons, customer satisfaction rates, hours saved, resolved topics, escalated topics, etc. Introducing our Virtual Assistant Activities And Performance Monitoring Dashboard set of slides. The topics discussed in these slides are Resolved Sessions, Escalated Session, Customer Satisfaction. This is an immediately available PowerPoint presentation that can be conveniently customized. Download it and convince your audience.
-
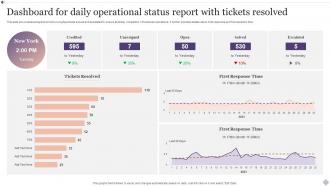 Dashboard For Daily Operational Status Report With Tickets Resolved
This slide showcases analytics to track everyday tickets solved and escalated to ensure its timely completion of business operations. It further includes details about first response and full resolution time. Presenting our well structured Dashboard For Daily Operational Status Report With Tickets Resolved. The topics discussed in this slide are Tickets Resolved, Solved, Response Time. This is an instantly available PowerPoint presentation that can be edited conveniently. Download it right away and captivate your audience.
-
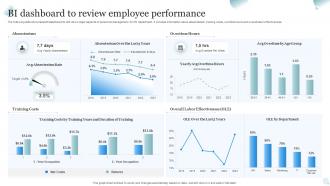 BI Dashboard To Review Employee Performance
The following slide showcases BI dashboard to drill down major aspects of personnel management for HR department. It includes information about absenteeism, training costs, overtime hours and overall labor effectiveness. Introducing our BI Dashboard To Review Employee Performance set of slides. The topics discussed in these slides are Training Costs, Labor Effectiveness, Overtime Hours. This is an immediately available PowerPoint presentation that can be conveniently customized. Download it and convince your audience.
-
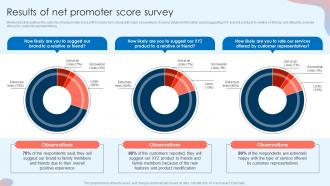 Results Of Net Promoter Score Survey Customer Attrition Rate Prevention
Mentioned slide outlines the outcome of net promoter score NPS survey form along with major observations. It covers detailed information about suggesting XYZ brand and products to relative or friends, and rating the services offered by customer representatives. Deliver an outstanding presentation on the topic using this Results Of Net Promoter Score Survey Customer Attrition Rate Prevention. Dispense information and present a thorough explanation of Observations, Product, Customer Representatives using the slides given. This template can be altered and personalized to fit your needs. It is also available for immediate download. So grab it now.
-
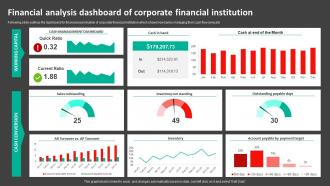 Financial Analysis Dashboard Of Corporate Financial Institution
Following slide outlines the dashboard for financial examination of corporate financial institution which shows how banks managing their cash flow annually. Presenting our well structured Financial Analysis Dashboard Of Corporate Financial Institution. The topics discussed in this slide are Cash Management Dashboard, Sales Outstanding, Inventory Out Standing. This is an instantly available PowerPoint presentation that can be edited conveniently. Download it right away and captivate your audience.
-
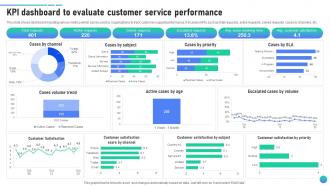 KPI Dashboard To Evaluate Customer Service Client Assistance Plan To Solve Issues Strategy SS V
This slide shows dashboard including various metrics which can be used by organizations to track customer support performance. It includes KPIs such as total requests, active requests, solved requests, cases by channels, etc. Present the topic in a bit more detail with this KPI Dashboard To Evaluate Customer Service Client Assistance Plan To Solve Issues Strategy SS V. Use it as a tool for discussion and navigation on Active Requests, Solved Requests. This template is free to edit as deemed fit for your organization. Therefore download it now.
-
 Financial Projection Business Model Of Zoom Ppt Icon Graphic Images BMC SS
This slide presents the financial projections showcasing company anticipated revenue growth. The projections are based on comprehensive market analysis and historical performance. Deliver an outstanding presentation on the topic using this Financial Projection Business Model Of Zoom Ppt Icon Graphic Images BMC SS. Dispense information and present a thorough explanation of Financial Projection, Historical Performance, Comprehensive Market Analysis using the slides given. This template can be altered and personalized to fit your needs. It is also available for immediate download. So grab it now.
-
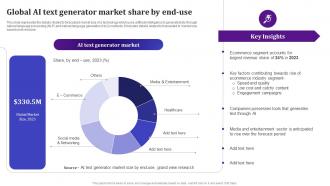 Global AI Text Generator Market Share By End Use AI Text To Voice Convertor Tools AI SS V
This slide represents the details related to forecasted market size of a technology which uses artificial intelligence to generate texts through natural language processing NLP and natural language generation NLG methods. It includes details related to forecasted AI market size based on its end use. Deliver an outstanding presentation on the topic using this Global AI Text Generator Market Share By End Use AI Text To Voice Convertor Tools AI SS V. Dispense information and present a thorough explanation of Media And Entertainment, Healthcare, E Commerce using the slides given. This template can be altered and personalized to fit your needs. It is also available for immediate download. So grab it now.
-
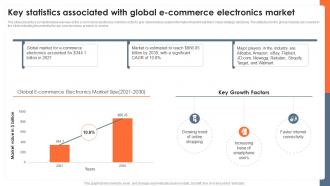 Key Statistics Associated With Global E Commerce Global Consumer Electronics Outlook IR SS
The slide presents a comprehensive overview of the e-commerce electronics market in order to give stakeholders useful information that will help them make strategic decisions. The statistics for the global markets are covered in the slide indicating the potential for any new business, product, or service. Present the topic in a bit more detail with this Key Statistics Associated With Global E Commerce Global Consumer Electronics Outlook IR SS. Use it as a tool for discussion and navigation on Global Market, E Commerce, Electronics Accounted. This template is free to edit as deemed fit for your organization. Therefore download it now.
-
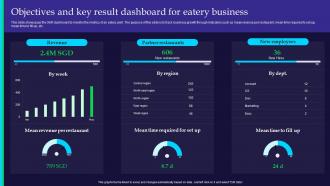 Objectives And Key Result Dashboard For Eatery Business
This slide showcases the OKR dashboard to monitor the metrics of an eatery joint. The purpose of this slide is to track business growth through indicators such as mean revenue per restaurant, mean time required to set up, mean time to fill up, etc. Presenting our well structured Objectives And Key Result Dashboard For Eatery Business The topics discussed in this slide are Revenue, Partner Restaurants, New Employees This is an instantly available PowerPoint presentation that can be edited conveniently. Download it right away and captivate your audience.
-
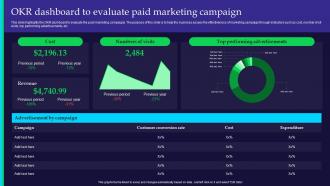 OKR Dashboard To Evaluate Paid Marketing Campaign
This slide highlights the OKR dashboard to evaluate the paid marketing campaigns. The purpose of this slide is to help the business assess the effectiveness of marketing campaign through indicators such as cost, number of sit visits, top performing advertisements, etc. Presenting our well structured OKR Dashboard To Evaluate Paid Marketing Campaign The topics discussed in this slide are Advertisement By Campaign, Performing Advertisements This is an instantly available PowerPoint presentation that can be edited conveniently. Download it right away and captivate your audience.
-
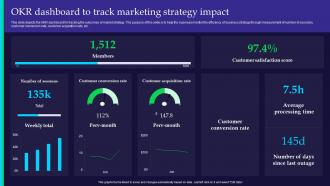 OKR Dashboard To Track Marketing Strategy Impact
This slide depicts the OKR dashboard for tracking the outcomes of market strategy. The purpose of this slide is to help the business monitor the efficiency of business strategy through measurement of number of sessions, customer conversion rate, customer acquisition rate, etc. Presenting our well structured OKR Dashboard To Track Marketing Strategy Impact The topics discussed in this slide are Customer Conversion, Customer Acquisition, Customer Satisfaction This is an instantly available PowerPoint presentation that can be edited conveniently. Download it right away and captivate your audience.
-
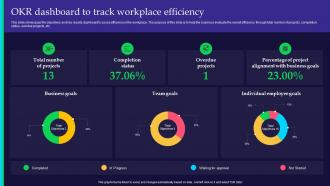 OKR Dashboard To Track Workplace Efficiency
This slide showcases the objectives and key results dashboard to asses efficiency in the workplace. The purpose of this slide is to help the business evaluate the overall efficiency through total number of projects, completion status, overdue projects, etc. Introducing our OKR Dashboard To Track Workplace Efficiency set of slides. The topics discussed in these slides are Completion Status, Overdue Projects, Business Goals This is an immediately available PowerPoint presentation that can be conveniently customized. Download it and convince your audience.
-
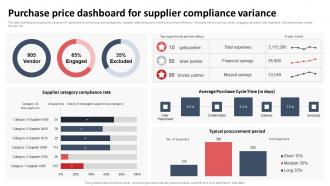 Purchase Price Dashboard For Supplier Compliance Variance
This slide illustrates purchase price variance KPI dashboard for enhancing cost management, supplier relationships and overall procurement efficiency. It includes metrics such as vendor, engaged, excluded, total expenses, financial savings, missed savings, etc. Introducing our Purchase Price Dashboard For Supplier Compliance Variance set of slides. The topics discussed in these slides are Supplier Category, Typical Procurement Period This is an immediately available PowerPoint presentation that can be conveniently customized. Download it and convince your audience.
-
 Wealth planning process 1 powerpoint presentation slides
These high quality, editable pre-designed powerpoint slides and powerpoint templates have been carefully created by our professional team to help you impress your audience. Each graphic in every powerpoint slide is vector based and is 100% editable in powerpoint. Each and every property of any slide - color, size, shading etc can be modified to build an effective powerpoint presentation. Use these slides to convey complex business concepts in a simplified manner. Any text can be entered at any point in the powerpoint slide. Simply DOWNLOAD, TYPE and PRESENT!
-
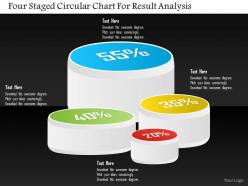 El four staged circular chart for result analysis powerpoint template
We are proud to present our el four staged circular chart for result analysis powerpoint template. Four staged circular chart has been used to craft this PPT diagram. This PPT contains the concept of result analysis. Use this PPT in your business and sales presentation and display any kind of result analysis in a graphical way.
-
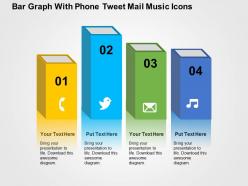 Bar graph with phone tweet mail music icons flat powerpoint design
We are proud to present our bar graph with phone tweet mail music icons flat powerpoint design. This power point template diagram has been designed with graphic of bar graph, tweet and phone . This diagram template contains the concept of social media communication. Use this diagram template for business and social media related presentations.
-
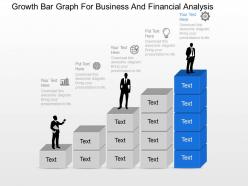 Growth bar graph for business and financial analysis powerpoint template slide
Meticulous PowerPoint template very convenient for management scholars, professionals from various fields etc., Comfortably adjustable into different configurations like PDF or JPG, Easy to insert your brand name or company emblem in the PPT templates , Redraft able subject matter, PowerPoint images, types , font etc., Dressed well with all Google slides and other operating software’s.


