Finance PowerPoint Templates, Presentation Slide Diagrams & PPT Graphics
- Sub Categories
-
- 30 60 90 Day Plan
- Advertising
- Agile Development
- Aims and Objectives
- Arrows
- Before and After
- Blockchain Bitcoin
- Boxes
- Business
- Calender
- Case Study
- Celebrations
- Certificates
- Challenges Opportunities
- Channel Distribution
- Children
- Communication
- Competitive Landscape
- Computer
- Concepts
- Construction Management
- Corporate
- Crowdfunding
- Current State Future State
- Custom PowerPoint Diagrams
- Digital Transformation
- Dos and Donts
- Economics
- Education
- Environment
- Events
- Festival
- Finance
- Financials
- Food
- Game
- Gap Analysis
- Generic
- Geographical
- Health
- Heatmaps
- Holidays
- Icons
- Input Process Output
- Internet
- Key Messages
- Key Wins
- Ladder
- Leadership
- Lists
- Lucky Draw
- Management
- Marketing
- Measuring
- Medical
- Music
- News
- Next Steps
- People Process Technology
- Pillars
- Planning
- Post-it-Notes
- Problem Statement
- Process
- Proposal Management
- Pros and Cons
- Puzzle
- Puzzles
- Recruitment Strategy
- Religion
- Research and Development
- Risk Mitigation Strategies
- Roadmap
- Selling
- Shapes
- Short Term Long Term
- Social
- Stairs
- Start Stop Continue
- Strategy
- Symbol
- Technology
- Thesis Defense Dissertation
- Timelines
- Traffic
- Transition Plan
- Transportation
- Vehicles
- Venture Capital Funding
- Warning
- Winners
- Word Cloud
-
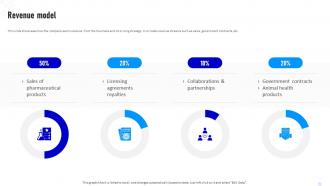 Revenue Model Pfizer Business Model Ppt File Background Designs BMC SS
This slide showcases how the company earns revenue from the business and its pricing strategy. It includes revenue streams such as sales, government contracts, etc. Deliver an outstanding presentation on the topic using this Revenue Model Pfizer Business Model Ppt File Background Designs BMC SS. Dispense information and present a thorough explanation of Licensing Agreements Royalties, Sales Of Pharmaceutical Products, Collaborations And Partnerships using the slides given. This template can be altered and personalized to fit your needs. It is also available for immediate download. So grab it now.
-
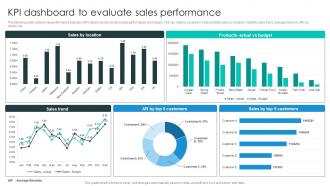 KPI Dashboard To Evaluate Sales Business Growth Plan To Increase Strategy SS V
The following slide outlines key performance indicator KPI dashboard to monitor sales performance of company. The key metrics covered in slide are total sales by location, monthly sales trend, average revenue AR by clients, etc. Present the topic in a bit more detail with this KPI Dashboard To Evaluate Sales Business Growth Plan To Increase Strategy SS V. Use it as a tool for discussion and navigation on Evaluate, Performance, Sales. This template is free to edit as deemed fit for your organization. Therefore download it now.
-
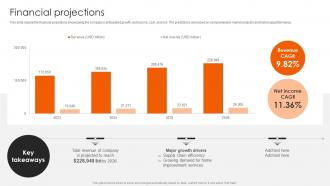 Financial Projections Home Depot Business Model BMC SS
This slide display the financial projections showcasing the companys anticipated growth, net income, cost, and risk. The predictions are based on comprehensive market analysis and historical performance. Present the topic in a bit more detail with this Financial Projections Home Depot Business Model BMC SS Use it as a tool for discussion and navigation on Financial Projections This template is free to edit as deemed fit for your organization. Therefore download it now.
-
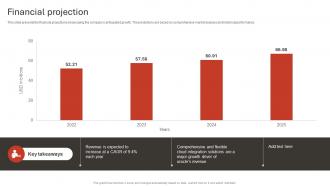 Financial Projection Oracle Business Model BMC SS
This slide presents the financial projections showcasing the companys anticipated growth. The predictions are based on comprehensive market analysis and historical performance. Present the topic in a bit more detail with this Financial Projection Oracle Business Model BMC SS Use it as a tool for discussion and navigation on Financial Projection This template is free to edit as deemed fit for your organization. Therefore download it now.
-
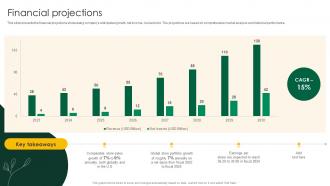 Financial Projections Starbucks Business Model BMC SS
This slide presents the financial projections showcasing companys anticipated growth, net income, cost and risk. The projections are based on comprehensive market analysis and historical performance. Present the topic in a bit more detail with this Financial Projections Starbucks Business Model BMC SS Use it as a tool for discussion and navigation on Financial Projections This template is free to edit as deemed fit for your organization. Therefore download it now.
-
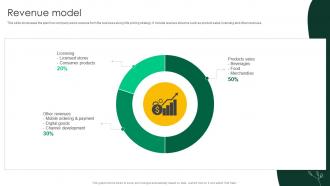 Revenue Model Starbucks Business Model BMC SS
This slide showcases the plan how company earns revenue from the business along it its pricing strategy. It include revenue streams such as product sales, licensing and other revenues. Present the topic in a bit more detail with this Revenue Model Starbucks Business Model BMC SS Use it as a tool for discussion and navigation on Consumer Products, Other Revenues, Products Sales This template is free to edit as deemed fit for your organization. Therefore download it now.
-
 3d symbols powerpoint presentation slides
These high quality, editable pre-designed powerpoint slides have been carefully created by our professional team to help you impress your audience. Each graphic in every slide is vector based and is 100% editable in powerpoint. Each and every property of any slide - color, size, shading etc can be modified to build an effective powerpoint presentation. Use these slides to convey complex business concepts in a simplified manner. Any text can be entered at any point in the powerpoint slide. Simply DOWNLOAD, TYPE and PRESENT!
-
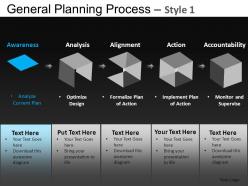 General planning process 1 powerpoint presentation slides db
These high quality, editable pre-designed powerpoint slides and powerpoint templates have been carefully created by our professional team to help you impress your audience. Each graphic in every powerpoint slide is vector based and is 100% editable in powerpoint. Each and every property of any slide - color, size, shading etc can be modified to build an effective powerpoint presentation. Use these slides to convey complex business concepts in a simplified manner. Any text can be entered at any point in the powerpoint slide. Simply DOWNLOAD, TYPE and PRESENT!
-
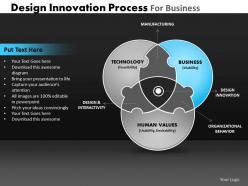 Design innovation process for business powerpoint slides and ppt templates db
These high quality, editable pre-designed powerpoint slides and powerpoint templates have been carefully created by our professional team to help you impress your audience. Each graphic in every powerpoint slide is vector based and is 100% editable in powerpoint.Each and every property of any slide - color, size, shading etc can be modified to build an effective powerpoint presentation. Use these slides to convey complex business concepts in a simplified manner. Any text can be entered at any point in the powerpoint slide. Simply DOWNLOAD, TYPE and PRESENT
-
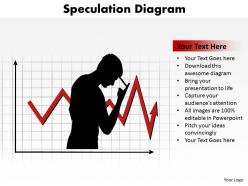 Speculation diagram financial crisis silhouette of man sad looking down powerpoint templates 0712
This PowerPoint diagram showing a graph. It is useful in stock market
-
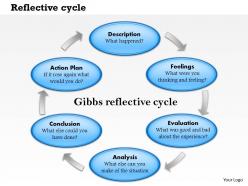 0514 reflective cycle powerpoint presentation
We are proud to present our 0514 reflective cycle powerpoint presentation. This PPT slide shows a reflective cycle diagram. You too have got the framework of your companys growth in place. Show the flow or progression of steps in a process. Deliver amazing presentations to mesmerize your audience.
-
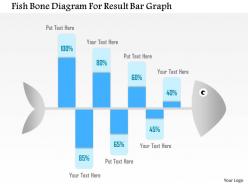 1114 fish bone diagram for result bar graph powerpoint template
The stunning bar graph Ppt template carries the superior resolution quality. The Ppt is loaded with the amazing features of digital volume equalizer and control knob. Shape the Ppt as per your desire by changing its colours, object orientation, and dimensions. Tune in the slides easily with the Google slides and enjoy the downloading in desired file format.
-
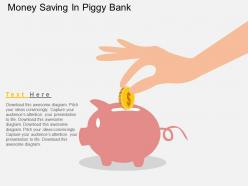 Money saving in piggy bank flat powerpoint design
We are proud to present our money saving in piggy bank flat powerpoint design. Concept of money saving has been displayed in this power point template diagram. This PPT diagram contains the graphic of piggy bank .Use this PPT diagram for business and finance related presentations.
-
 Wk dollar notes with gold dollar coins flat powerpoint design
Presenting wk dollar notes with gold dollar coins flat powerpoint design. This Power Point template diagram has been crafted with graphic of dollar note and coins diagram. This PPT diagram contains the concept of financial target achievement and analysis Use this PPT diagram for business and finance related presentations.
-
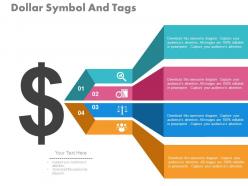 View dollar symbol and tags for strategic planning processes flat powerpoint design
Presenting view dollar symbol and tags for strategic planning processes flat powerpoint design. This Power Point template diagram has been crafted with graphic of dollar symbols and tags diagram. This PPT diagram contains the concept of strategic planning processes. Use this PPT diagram for business and marketing related presentations.
-
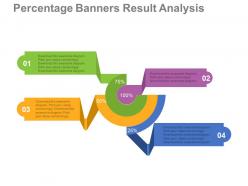 Pptx four percentage banners result analysis flat powerpoint design
Presenting pptx four percentage banners result analysis flat powerpoint design. This Power Point template diagram slide has been crafted with graphic of four percentage banners. This PPT slide contains the concept of business result analysis representation .Use this PPT slide for business and finance related presentations.
-
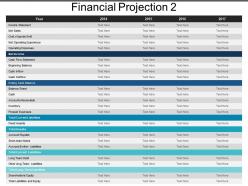 Financial projection 2 presentation pictures
Presenting Financial Projection 2 Presentation Pictures. The PPT is completely customizable and ready to use. You can change the font size, font type, colors of the template as per requirement. It can be viewed and saved in JPG or PDF format. The slide sample is fully compatible with Google Slides. The stages and texts present in the PowerPoint sample are 100% editable and very easy to download.
-
 Cash icon showing dollar money bills with dollar sign
Presenting this set of slides with name - Cash Icon Showing Dollar Money Bills With Dollar Sign. This is a two stage process. The stages in this process are Cash Icon, Money Icon, Income Icon.
-
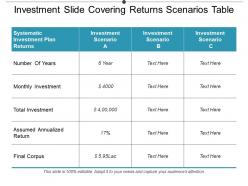 Investment slide covering returns scenarios table
Presenting this set of slides with name - Investment Slide Covering Returns Scenarios Table. This is a three stage process. The stages in this process are Investment Slide, Mutual Funds, Funds To Buy.
-
 Financial dollar ppt powerpoint presentation diagram templates
Presenting this set of slides with name - Financial Dollar Ppt Powerpoint Presentation Diagram Templates. This is a three stage process. The stages in this process are Financial, Maximum, Medium, Minimum, Dollar, Percentage.
-
 Technology perspective technology foresight ppt powerpoint presentation inspiration information cpb
Presenting this set of slides with name Technology Perspective Technology Foresight Ppt Powerpoint Presentation Inspiration Information Cpb. This is an editable Powerpoint three stages graphic that deals with topics like Technology Perspective Technology Foresight to help convey your message better graphically. This product is a premium product available for immediate download and is 100 percent editable in Powerpoint. Download this now and use it in your presentations to impress your audience.
-
 Saving income icon with dollar sign
Introducing our premium set of slides with Saving Income Icon With Dollar Sign. Ellicudate the three stages and present information using this PPT slide. This is a completely adaptable PowerPoint template design that can be used to interpret topics like Saving Income Icon With Dollar Sign. So download instantly and tailor it with your information.
-
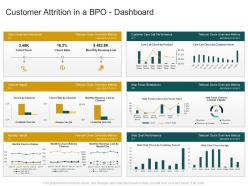 Customer attrition in a bpo dashboard revenue customer churn in a bpo company case competition
Present the topic in a bit more detail with this Customer Attrition In A BPO Dashboard Revenue Customer Churn In A BPO Company Case Competition. Use it as a tool for discussion and navigation on Channel Impact, Telecom Churn Overview Metrics, Customer Care Call Performance, Monthly Trends, Web Chart Performance. This template is free to edit as deemed fit for your organization. Therefore download it now.
-
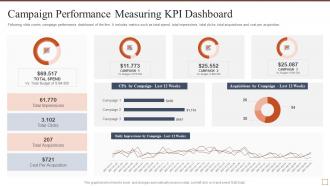 Campaign performance measuring kpi dashboard effective brand building strategy
Present the topic in a bit more detail with this Campaign Performance Measuring KPI Dashboard Effective Brand Building Strategy. Use it as a tool for discussion and navigation on Campaign Performance Measuring KPI DashboardFollowing slide covers campaign performance dashboard of the firm. It includes metrics such as total spend, total impressions, total clicks, total acquisitions and cost per acquisition. . This template is free to edit as deemed fit for your organization. Therefore download it now.
-
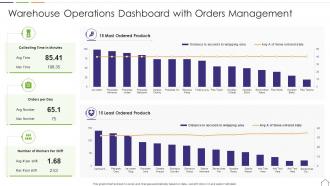 Warehouse Operations Dashboard With Orders Management
This graph or chart is linked to excel, and changes automatically based on data. Just left click on it and select edit data. Presenting our well structured Warehouse Operations Dashboard With Orders Management. The topics discussed in this slide are Collecting Time in Minutes, 15 Most Ordered Products, Orders per Day, Number of Workers Per Shift, 15 Least Ordered Products. This is an instantly available PowerPoint presentation that can be edited conveniently. Download it right away and captivate your audience.
-
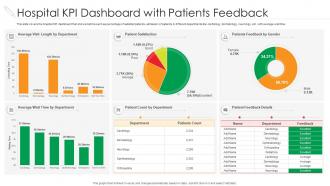 Hospital KPI Dashboard With Patients Feedback
This slide covers the hospital KPI dashboard that shows metrics such as percentage of satisfied patients, admission of patients in different departments like cardiology, dermatology, neurology, etc. with average wait time. Introducing our Hospital KPI Dashboard With Patients Feedback set of slides. The topics discussed in these slides are Average Visit Length By Department, Patient Satisfaction, Patients Feedback By Gender, Patient Feedback Details, Patient Count By Department, Average Wait Time By Department. This is an immediately available PowerPoint presentation that can be conveniently customized. Download it and convince your audience.
-
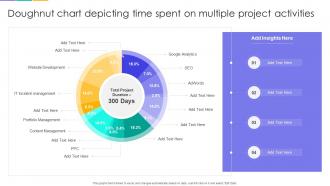 Doughnut Chart Depicting Time Spent On Multiple Project Activities
Presenting our well-structured Doughnut Chart Depicting Time Spent On Multiple Project Activities. The topics discussed in this slide are Portfolio Management, Content Management, IT Incident Management, Website Development. This is an instantly available PowerPoint presentation that can be edited conveniently. Download it right away and captivate your audience.
-
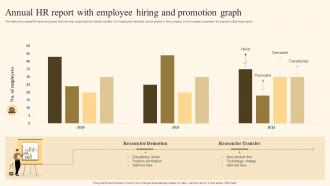 Annual HR Report With Employee Hiring And Promotion Graph
This slide showcases HR report and graph that can help organization to identify number of of employees demoted and promoted in the company. It showcases comparison for a period of last three years Presenting our well-structured Annual HR Report With Employee Hiring And Promotion Graph. The topics discussed in this slide are HR Report, Employee Hiring, Promotion Graph. This is an instantly available PowerPoint presentation that can be edited conveniently. Download it right away and captivate your audience.
-
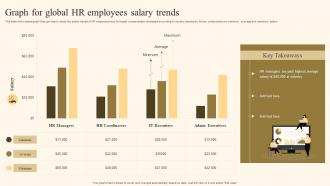 Graph For Global HR Employees Salary Trends
This slide showcases graph that can help to study the salary trends of HR employees and formulate compensation strategies according to industry standards. Its key components are minimum, average and maximum salary Introducing our Graph For Global HR Employees Salary Trends set of slides. The topics discussed in these slides are Graph, Global, HR, Employees Salary Trends. This is an immediately available PowerPoint presentation that can be conveniently customized. Download it and convince your audience.
-
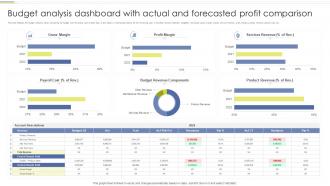 Budget Analysis Dashboard With Actual And Forecasted Profit Comparison
This slide displays the budget analysis report comparing the budget with the actual year to date data. It also helps in making estimations for the remaining year. It includes variance between budgeted and actual gross margin results, service revenue, profit margin, product revenue, payroll cost, etc. Introducing our Budget Analysis Dashboard With Actual And Forecasted Profit Comparison set of slides. The topics discussed in these slides are Gross Margin, Profit Margin, Payroll Cost, Services Revenue. This is an immediately available PowerPoint presentation that can be conveniently customized. Download it and convince your audience.
-
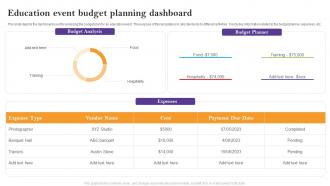 Education Event Budget Planning Dashboard
This slide depicts the dashboard used for analyzing the budget plan for an education event. The purpose of this template is to allocate funds to different activities. It includes information related to the budget planner, expenses, etc. Introducing our Education Event Budget Planning Dashboard set of slides. The topics discussed in these slides are Budget Analysis, Budget Planner, Education Event. This is an immediately available PowerPoint presentation that can be conveniently customized. Download it and convince your audience.
-
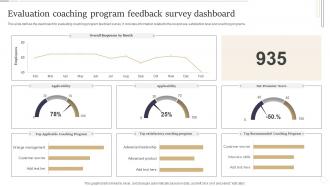 Evaluation Coaching Program Feedback Survey Dashboard
This slide defines the dashboard for evaluating coaching program feedback survey. It includes information related to the responses, satisfaction level and coaching programs. Presenting our well structured Evaluation Coaching Program Feedback Survey Dashboard. The topics discussed in this slide are Evaluation Coaching, Program Feedback, Survey Dashboard. This is an instantly available PowerPoint presentation that can be edited conveniently. Download it right away and captivate your audience.
-
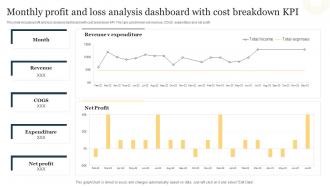 Monthly Profit And Loss Analysis Dashboard With Cost Breakdown KPI
This slide includes profit and loss analysis dashboard with cost breakdown KPI. The kpis used herein are revenue, COGS, expenditure and net profit. Presenting our well structured Monthly Profit And Loss Analysis Dashboard With Cost Breakdown KPI. The topics discussed in this slide are Revenue Expenditure, Net Profit, Revenue. This is an instantly available PowerPoint presentation that can be edited conveniently. Download it right away and captivate your audience.
-
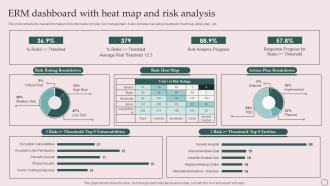 Erm Dashboard With Heat Map And Risk Analysis
This slide contains the overall information of an information of cyber risk management. It also includes risk rating breakdown, heat map, action plan, etc. Introducing our Erm Dashboard With Heat Map And Risk Analysis set of slides. The topics discussed in these slides are Dashboard, Heat Map, Risk Analysis. This is an immediately available PowerPoint presentation that can be conveniently customized. Download it and convince your audience.
-
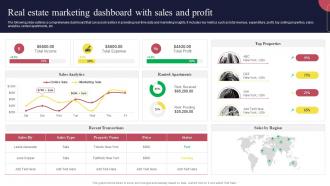 Real Estate Marketing Strategies Real Estate Marketing Dashboard With Sales And Profit
The following slide outlines a comprehensive dashboard that can assist realtors in providing real time data and marketing insights. It includes key metrics such as total revenue, expenditure, profit, top selling properties, sales analytics, rented apartments, etc. Deliver an outstanding presentation on the topic using this Real Estate Marketing Strategies Real Estate Marketing Dashboard With Sales And Profit. Dispense information and present a thorough explanation of Real Estate Marketing, Dashboard, Sales And Profit, Ranted Apartments using the slides given. This template can be altered and personalized to fit your needs. It is also available for immediate download. So grab it now.
-
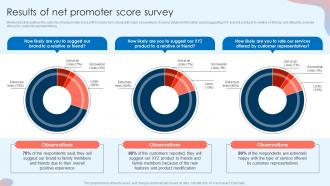 Results Of Net Promoter Score Survey Customer Attrition Rate Prevention
Mentioned slide outlines the outcome of net promoter score NPS survey form along with major observations. It covers detailed information about suggesting XYZ brand and products to relative or friends, and rating the services offered by customer representatives. Deliver an outstanding presentation on the topic using this Results Of Net Promoter Score Survey Customer Attrition Rate Prevention. Dispense information and present a thorough explanation of Observations, Product, Customer Representatives using the slides given. This template can be altered and personalized to fit your needs. It is also available for immediate download. So grab it now.
-
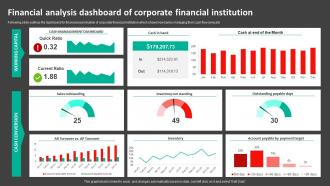 Financial Analysis Dashboard Of Corporate Financial Institution
Following slide outlines the dashboard for financial examination of corporate financial institution which shows how banks managing their cash flow annually. Presenting our well structured Financial Analysis Dashboard Of Corporate Financial Institution. The topics discussed in this slide are Cash Management Dashboard, Sales Outstanding, Inventory Out Standing. This is an instantly available PowerPoint presentation that can be edited conveniently. Download it right away and captivate your audience.
-
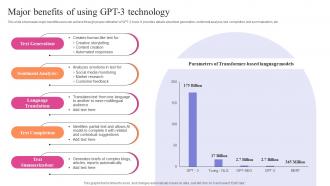 Exploring Use Cases Of OpenAI Major Benefits Of Using GPT 3 Technology ChatGPT SS V
This slide showcases major benefits users can achieve through proper utilization of GPT-3 tools. It provides details about text generation, sentiment analysis, text completion, text summarization, etc. Deliver an outstanding presentation on the topic using this Exploring Use Cases Of OpenAI Major Benefits Of Using GPT 3 Technology ChatGPT SS V. Dispense information and present a thorough explanation of Creative Storytelling, Content Creation, Social Media Monitoring, Market Research using the slides given. This template can be altered and personalized to fit your needs. It is also available for immediate download. So grab it now.
-
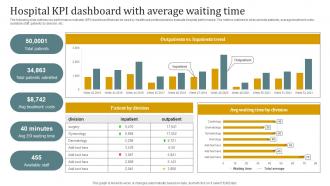 Hospital KPI Dashboard With Average Waiting Time Promotional Plan Strategy SS V
The following slide outlines key performance indicator KPI dashboard that can be used by healthcare professionals to evaluate hospital performance. The metrics outlined in slide are total patients, average treatment costs, available staff, patients by division, etc. Present the topic in a bit more detail with this Hospital KPI Dashboard With Average Waiting Time Promotional Plan Strategy SS V Use it as a tool for discussion and navigation on Outpatients, Inpatients Trend, Patient By Division This template is free to edit as deemed fit for your organization. Therefore download it now.
-
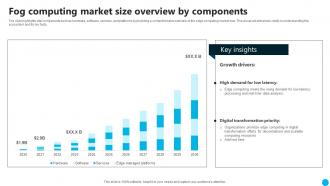 Fog Computing Market Size Overview By Components
The slide highlights vital components such as hardware, software, services, and platforms by providing a comprehensive overview of the edge computing market size. This visual aid enhances clarity in understanding the ecosystem and its key facts. Presenting our well structured Fog Computing Market Size Overview By Components. The topics discussed in this slide are Fog Computing Market Size, Overview By Components. This is an instantly available PowerPoint presentation that can be edited conveniently. Download it right away and captivate your audience.
-
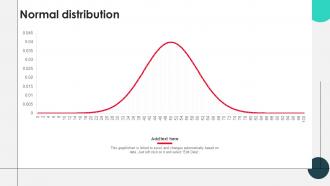 Normal Distribution PU CHART SS
Presenting our well structured Normal Distribution PU CHART SS. The topics discussed in this slide are Normal Distribution. This is an instantly available PowerPoint presentation that can be edited conveniently. Download it right away and captivate your audience.
-
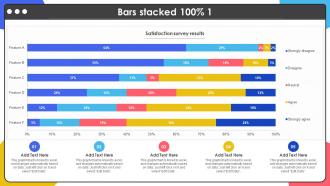 Bars Stacked 100 Percent 1 PU CHART SS
Introducing our v set of slides. The topics discussed in these slides are Bars Stacked, Percent. This is an immediately available PowerPoint presentation that can be conveniently customized. Download it and convince your audience.
-
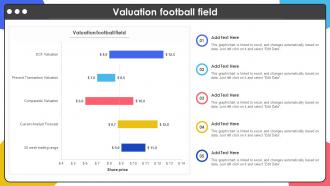 Valuation Football Field PU CHART SS
Introducing our Valuation Football Field PU CHART SS set of slides. The topics discussed in these slides are Valuation Football Field. This is an immediately available PowerPoint presentation that can be conveniently customized. Download it and convince your audience.
-
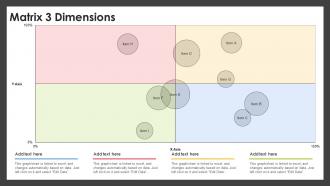 Matrix 3 Dimensions PU CHART SS
Presenting our well structured Matrix 3 Dimensions PU CHART SS. The topics discussed in this slide are Quadrant. This is an instantly available PowerPoint presentation that can be edited conveniently. Download it right away and captivate your audience.
-
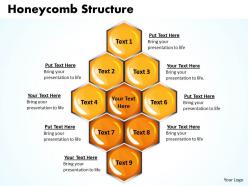 Honeycomb structure powerpoint slides presentation diagrams templates
We are proud to present our honeycomb structure powerpoint slides presentation diagrams templates. The above diagram contains the graphic of hexagonal shapes grouped together in the shape of a honeycomb. Amplify your views, ideas and thoughts from very basic aspects to the highly technical and complicated issues using this template as a tool.
-
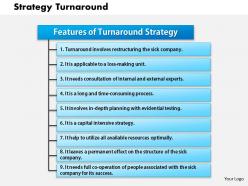 0514 strategy turnaround powerpoint presentation
Well drafted PPT design template appealing to the potential audiences, Contrasting colors for text, font, background and PowerPoint Image which can be manually altered, unaffected high resolution PowerPoint graphics maintains its impact even after customization, Flexible option to convert in JPG or PDF format as per requirement, Serves well with all the software’s and Google slides.
-
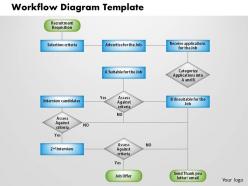 0514 workflow diagram template powerpoint presentation
We are proud to present our 0514 workflow diagram template powerpoint presentation. This business power point template is designed with workflow diagram to display any work flow for financial or business process diagram. Use tis template in your financial or business related presentation and make them more effective.
-
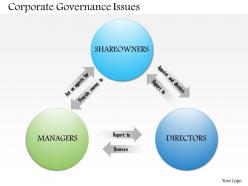 0514 corporate governance issues powerpoint presentation
We are proud to present our 0514 corporate governance issues powerpoint presentation. Corporate governance provides the framework for attaining a companys objectives it encompasses practically every sphere of management, from action plans and internal controls to performance measurement and corporate disclosure.
-
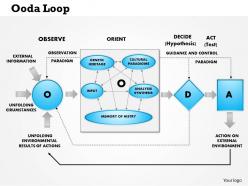 0514 ooda loop observe orient decide attack powerpoint presentation
We are proud to present our 0514 ooda loop observe orient decide attack powerpoint presentation. OODA Loop model outlines a four point decision loop that supports quick, effective and proactive decision making. You continue to cycle through the OODA Loop by observing the results of your actions.
-
 Operating expenses april to july budget table
Presenting operating expenses april to july budget table. This is a operating expenses april to july budget table. This is a four stage process. The stages in this process are operating expenses, operating costs, business expenditures.
-
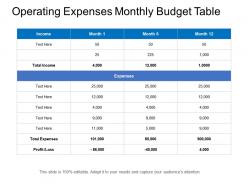 Operating expenses monthly budget table
Presenting operating expenses monthly budget table. This is a operating expenses monthly budget table. This is a three stage process. The stages in this process are operating expenses, operating costs, business expenditures.
-
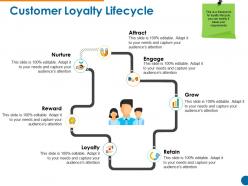 Customer loyalty lifecycle good ppt example
Presenting customer loyalty lifecycle good ppt example. This is a customer loyalty lifecycle good ppt example. This is a seven stage process. The stages in this process are attract, engage, grow, retain, loyalty.
-
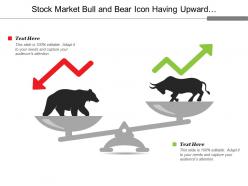 Stock market bull and bear icon having upward and downward arrow
Presenting this set of slides with name - Stock Market Bull And Bear Icon Having Upward And Downward Arrow. This is a two stage process. The stages in this process are Bull Market, Financial Market, Stock Market.
-
 Stock market icon having upward arrow and dollar
Presenting this set of slides with name - Stock Market Icon Having Upward Arrow And Dollar. This is a four stage process. The stages in this process are Bull Market, Financial Market, Stock Market.
-
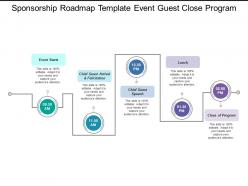 Sponsorship roadmap template event guest close program
Presenting this set of slides with name - Sponsorship Roadmap Template Event Guest Close Program. This is a five stage process. The stages in this process are Sponsorship Roadmap Template, Sponsorship Timeline Template, Sponsorship Linear Process Template.
-
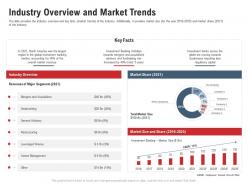 Industry overview and market trends pitchbook for acquisition deal ppt diagrams
The slide provides the industry overview and key facts market trends of the industry. Additionally, it provides market size for the year 2016 to 2025 and market share 2021 of the industry. Present the topic in a bit more detail with this Industry Overview And Market Trends Pitchbook For Acquisition Deal Ppt Diagrams. Use it as a tool for discussion and navigation on Industry Overview And Market Trends. This template is free to edit as deemed fit for your organization. Therefore download it now.
-
 Warehouse management dashboard warehousing logistics ppt designs
The slide demonstrates information regarding the warehouse management dashboard in order to track key activities. Deliver an outstanding presentation on the topic using this Warehouse Management Dashboard Warehousing Logistics Ppt Designs. Dispense information and present a thorough explanation of Volume Today, Inventory, Global Financial Performances using the slides given. This template can be altered and personalized to fit your needs. It is also available for immediate download. So grab it now.
-
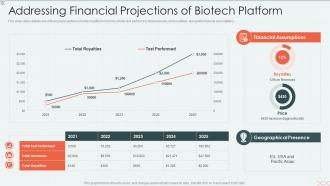 Addressing financial projections biotech biotechnology firm elevator
This slide caters details about financial projections of biotech platform in terms of total test performed, total revenues, total royalties, along with financial assumptions. Deliver an outstanding presentation on the topic using this Addressing Financial Projections Biotech Biotechnology Firm Elevator. Dispense information and present a thorough explanation of Geographical Presence, Financial Assumptions, Total Revenues, Total Royalties, Total Test Performed using the slides given. This template can be altered and personalized to fit your needs. It is also available for immediate download. So grab it now.
-
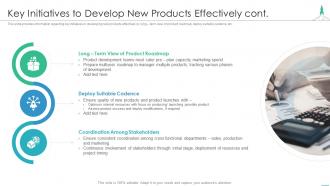 Effectively introducing new product key initiatives develop new products effectively
This slide provides information regarding key initiatives in developing new products effectively by long term view of product roadmap, deploy suitable cadence, etc. Increase audience engagement and knowledge by dispensing information using Effectively Introducing New Product Key Initiatives Develop New Products Effectively. This template helps you present information on three stages. You can also present information on Long Term View Product Roadmap, Deploy Suitable Cadence, Coordination Among Stakeholders using this PPT design. This layout is completely editable so personaize it now to meet your audiences expectations.
-
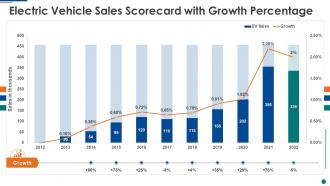 Electric vehicle sales scorecard with growth percentage ppt slides graphics
Present the topic in a bit more detail with this Electric Vehicle Sales Scorecard With Growth Percentage Ppt Slides Graphics. Use it as a tool for discussion and navigation on EV Sales, Growth, 2012 To 2022. This template is free to edit as deemed fit for your organization. Therefore download it now.


